
Glanceability Evaluation of a Physical Activity Feedback System
for Office Workers
S. T. Boerema
1,2
, R. Klaassen
3
, H. J. A. op den Akker
3
, H. J. Hermens
1,2
1
Roessingh Research and Development, Roessinghsbleekweg 33b,Enschede, the Netherlands
2
Telemedicine, University of Twente, P.O. Box 217 7500 AE, Enschede, the Netherlands
3
Human Media Interaction, University of Twente, P.O. Box 217 7500 AE, Enschede, the Netherlands
Keywords: Glanceability, Feedback, Physical Activity, User-centered Design, ICT Applications, Behaviour Change
Support System.
Abstract: This paper presents the results of a user evaluation to design a glanceable user interface presenting physical
activity feedback to office workers during the workday. The feedback is presented on a central and public
display next to the coffee machine in the office building. Users should be able to receive the feedback
quickly and easily while getting a cup of coffee − the user interface should be glanceable. The feedback
should communicate the (real-time) amount of physical activity and the progress toward the goal of the user
for a day. Three mock-ups of user interfaces were developed and evaluated in a user evaluation study.
Differences on reaction time and user preferences were found. None of these results were significant.
Adding group information to the mock-up increases reaction time and therefore lowers the glanceability
negatively.
1 INTRODUCTION
Not being sufficiently physically active is regarded
as one of the most important independent risk
factors of reduced life expectancy. It increases the
risk of obesity, coronary heart disease and stroke,
type 2 diabetes, as well as colon and breast cancer. It
is therefore recognised as one of the most important
modifiable risk factors that is causing the rising
global burden of chronic disease.
About 40% of Dutch adults are not sufficiently
physically active and over 40% are overweight or
obese. Studies showed pooled prevalence of
sedentary lifestyles for 15 European countries being
31%, whereas 17.7% of the population of 51 mainly
low- and middle-income worldwide countries were
physically inactive, indicating that inactivity may be
more prevalent in wealthier countries (Guthold et al.
2008). Many contemporary work tasks are
characterised by little or no physical activity. More
than a quarter of all employees in the Netherlands
have sedentary work and sit on average 4 hours
while being at work and travelling to and from work.
TNO Care and Prevention (Hildebrandt n.d.) states
that, in the Netherlands, employees that participate
in sports report less ill and mostly for a shorter
period then their non-sporting colleagues. This effect
is most strongly for employees with sedentary work.
Given the various health benefits of physical
activity, and the high prevalence of physical
inactivity during work, many health interventions
focus on promoting physical activity.
Providing feedback on the personal physical
activity level can create awareness and motivation to
change physical behaviour, as described in many
social cognitive models on health behaviour
(Nutbeam & Harris 2004). Physical activity
interventions focussed on sedentary workers have
been using self reporting methods (e.g.
questionnaires) and pedometers (i.e. step-counters)
(Chan et al. 2004; Dinger et al. 2007; Cocker et al.
2008). These studies provided feedback on an
individual level, not incorporating direct interference
of the social environment, while social norms are
often considered an important factor in behaviour
change, as described in the Health Belief Model, the
Social Cognitive Theory and the Theory of Planned
Behaviour (Rosenstock 1966; Bandura et al. 1977;
Ajzen 1991).
The office setting is an interesting environment
for studying group mechanisms in physical activity
feedback on the self-awareness and behaviour of
52
Boerema S., Klaassen R., Hermens H. and den Akker H. (2012).
Glanceability Evaluation of a Physical Activity Feedback System for Office Workers.
In Proceedings of the Sixth International Symposium on e-Health Services and Technologies and the Third International Conference on Green IT
Solutions, pages 52-57
DOI: 10.5220/0004474000520057
Copyright
c
SciTePress

sedentary workers. To study these group
mechanisms, a system will be developed based on
wearable physical activity sensors and a feedback
device. We envision that the feedback device will be
used by multiple users in a public space of the office
containing personal and group feedback. This vision
implies high demands on the usability and
understanding of the graphical user interface (GUI)
of the feedback device. The goal of the system is to
create awareness and motivation people to be more
physical active, which can result in a healthier
lifestyle at the office. In this system, physical
activity is measured by a hip mounted activity
monitor – which can estimate energy expenditure
based on a 3D accelerometer according to the
method of Bouten (1996) – and this data is wireless
and real-time transmitted to and processed on a
central server. Based on the data the system presents
feedback on the central display of the system, which
is located near the coffee machine in the office
building. While waiting for their cup of coffee the
system shows real-time feedback about the physical
activity until that moment of the current workday.
The goal of this research is to design a user interface
to present feedback to the users on the central
display. Because of its setting at the coffee machine
the feedback interpretation time is limited. The
designed user interface should therefore be
glanceable. Matthews defines glanceable as follows:
"By glanceable, we mean enabling users to
understand information quickly and easily.
Glanceability is critical to peripheral display design
because users need to quickly glance at and read
displayed information with minimal interruption to
their primary task" (Matthews 2006; Matthews et al.
2007).
The effect on glanceability of various user
interfaces and the addition of group information to
personal feedback will be studied during a user
evaluation, in which reaction time will be used as a
measure for ‘quickly’ and the correctness of the
interpretation of the information in the mock-up as a
measurement for ‘easily’. From the results of the
user evaluation we conclude which of the designed
user interface is the most glanceable, what is the
effect of adding group information to user interface
on the glanceability, and which user interface is
preferred by the subjects.
2 METHODOLOGY
Three mock-ups of the envisioned physical activity
feedback system were compared in a controlled user
experiment to answer the research questions. To
measure the effect of glanceability the mock-ups
were compared using a within-subject design while
the effect of adding group information to the mock-
ups was compared in a between-subject design.
Personal information and information about
sitting behaviour, workday activities, physical
activity and sport are gathered at the beginning of
the experiment.
During the actual user experiment the participant
will evaluate the three mock-ups to measure the
clarity and glanceability of the mock-ups. Two
questions were given with each mock-up: one about
the amount of physical activity and one about the
progress towards their goal. The questions were the
same for all participants. Participants in the ‘with
group information’ group had to answer a third
question about their own performance compared to
the group performance. The participants can answer
the question on a five point Likert scale (1 for very
bad, to 5 for very good) and were asked to: “answer
the question correctly and as quickly as possible”.
The correctness of the interpretation is used to
calculate the clarity of the mock-up (whether the
answer is correct or not), while the reaction time
(the time the participant needs to answer the
question) is used to calculate the glanceability of the
mock-up. Incorrect answers were excluded from
reaction time calculations.
After each mock-up participants evaluated
usability and their perception of information on the
screen. This questionnaire was adapted from
Quesenbery (2003; Stone e.a. 2005) and was
extended by two questions on their intention to use
the system in future and the attractiveness of the
system.
At the end of the experiment the participants
were invited for a short, semi-structured interview
about their preference of one of the mock-ups and
their opinion on the general idea of presenting
feedback on physical activity on a public screen in
an office environment.
The results of the reaction times and the answers
to the questionnaire of the three mock-ups were
compared using a mixed between-within ANOVA
test. The results of the questionnaires were recorded
and interesting remarks will be presented in the
result section.
2.1 Subjects
Subjects were recruited from two offices by the
snowball sampling method. The only inclusion
criterion was: doing mainly deskwork.
Glanceability Evaluation of a Physical Activity Feedback System for Office Workers
53
Participants were randomly assigned to one of
two conditions: 1) presenting three mock-ups
without the group comparison (‘no group’) and 2)
presenting three mock-ups with the group
comparison (‘group’).
2.2 Procedure
The subjects were invited to participate in the
experiment. When the subjects agreed taking part in
the experiment they received a short written
introduction on physical activity and deskwork. The
introduction included a scenario in which the
envisioned system was introduced in an office
setting.
The order of presenting the three mock-ups was
counterbalanced. During the user evaluations the
participants were observed, notes were taken and
audio recordings of the interviews were stored.
Filling in the questionnaire and evaluating the mock-
ups were done on separate computers.
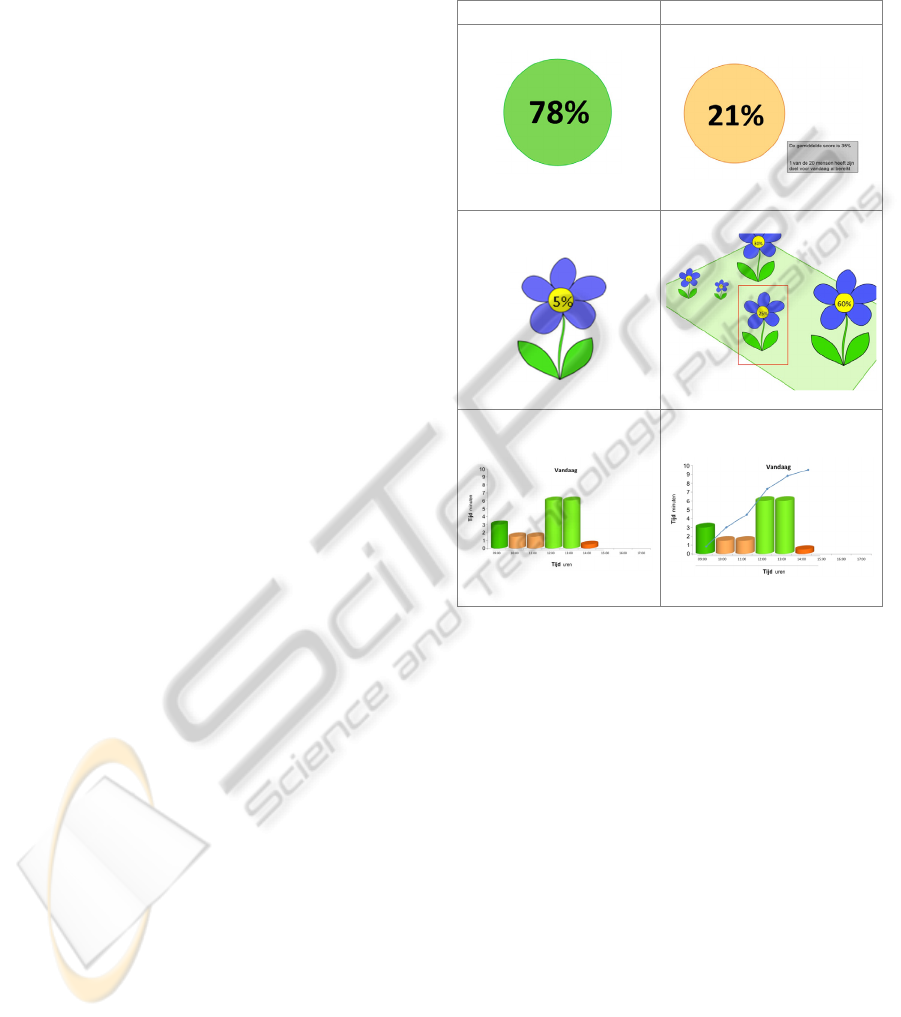
2.3 Design of Mock-ups
For both conditions three different mock-ups are a
Number, a Flower and a Graph. All user interfaces
present real-time physical activity data and the
progress of reaching the goal. In this the progress is
given in minutes of physical activity up to the
moment of walking by the feedback device and the
goal being a total of 30 minutes of physical activity
during office hours.
The first mock-up uses a number to present the
progress reaching the goal in a percentage (for
example 73%). The number presents the progress
towards the goal of the user. The background colour
presents how the user is distributing the amount of
activity over the day. Group information is added to
the mock-up by text stating the average score of the
group and the number of people that already reached
their goal.
The second mock-up uses a metaphor of a
growing flower to present the progress in physical
activity. The stage of the flower represents the
progress towards the goal of the user. The exact
percentage towards to the goal of the user is
displayed in the heart of the flower. Group
information is added to the mock-up by the
metaphor of a garden. Every flower represents a user
of the system. The garden provides an overview of
all the activities of all users.
The third mock-up presents physical activity of
the user in a graph. This mock-up is an improved
mock-up of the system and is based on the work of
Boerema (2009). The graph provides an overview of
the amount of physical activity per hour. Group
information is shown in the mock-up by a line that
shows the average level of physical activity of the
group. The six mock-ups are given in Figure 1.
No Group Group
Number
Number
Flower
Flower
Graph Graph
Figure 1: Overview of the six mock-ups.
3 RESULTS
3.1 Subjects
Twenty seven people participated in the experiment.
From this, four were excluded from the data analysis
because they did not understand the experimental
setup, and expressed this during the experiment.
From the remaining 23 subjects, 12 were male and
11 female, with an average age of 31 ± 7 years.
The participants were all office workers
(researchers, administrative staff or undergraduate
students). They reported to have an average working
day of 8.1 ± 0.5 hours on which they spend on
average 7.1 ± 1.0 hours, sitting. On the question
whether they engage in sports, 14 subjects
responded positive, 3 negative, and 6 answered
‘rarely’, On the question whether the subject
considers himself or herself physically active above
EHST/ICGREEN 2012
54

the average, the response on a 5 point Likert scale:
not agree – agree, was 3 ± 1.2, which means that
they were neutral about their physical activity level
compared to others.
Twelve participants were assigned to the mock-
ups without the group comparison and 11
participants were assigned to the mock-ups with the
group comparison.
3.2 Intention to Use
After reading the scenario, participants rated their
intention to use the system, on a Likert scale 1-5:
negative – positive. They average response was 3.4
± 1.0, meaning that they were slightly positive on
using the system. There was no correlation between
the self reported engagement in sports, the physical
activity level and intention to use.
After each mock-up, intention to use was asked
again. Randomization of the mock-ups was tested by
studying order effects in intention to use. There was
no trend in intention to use answers neither towards
the positive nor the negative, therefore answers per
mock-up can be compared without correcting for the
order in which they were presented to the subject.
In both the ‘no group’ and ‘group’ conditions
comparison the intention to use was the lowest after
seeing the ‘Graph’: 2.5 ± 1.3. Intention to use after
‘Number’ was on average 3.3 ± 1.0 and after
‘Flower’, 2.8 ± 1.2. Only in the No Group condition
the intention to use after Flower was below 3, being
neutral. Results per condition are shown in Figure 2.
3.3 Correctness
In the ‘no group’ condition only one subject
answered ‘I don’t know’ while using the Graph
mock-up. In the ‘Group’ condition multiple subjects
answered ‘I don’t know’, three subjects while using
the Number mock-up, three subjects while using the
Flower mock-up and one subject while using the
Graph mock-up.
All information perception questions were
correctly answered, except for the ‘no group’ Flower
condition, which was mostly answered as showing
sufficient physical activity (while the flower
displayed a lower level of physical activity) and a
good progress towards the goal (while the flowers
displayed a bad progress towards their goal).
3.4 Reaction Time
The randomisation of the mock-ups was also tested
by studying order effect on reaction time. There was
Figure 2: Intention to use the system per condition
(‘No Group’ and ‘Group’), self reported on a 5 point
Likert scale: negative – positive. Self reports are given
after reading the scenario and after seeing each mock-up.
no order effect in reaction time for the questions,
indicating that reaction times can be compared
without correcting for the order in which subjects
have seen the mock-ups.
In figure 3 and 4 are the average reaction times
given per group, per mock-up. The reaction time on
question 2 (Q2) is in all cases much shorter than on
question 1 (Q1). For the first question the reaction
time is shorter for the No Group condition.
3.5 Interviews
At the end of the user evaluation the participants
indicated their preference for the mock-ups. Ten
participants preferred the Number, eight participants
preferred the Flower and five participants preferred
the Graph. The participants were asked to state their
opinion about presenting feedback in a public and
central place. Fifteen participants indicated that it
was no problem to show their physical activity level
on a central and public display. Eight participants
indicated that they have issues with the idea of
public and central feedback. These participants
expressed privacy concerns or were not interested at
all in these kinds of feedback systems. Nineteen
participants indicated that they would join a system
like this in their office, if it would be introduced.
4 DISCUSSION & CONCLUSION
The results of the user evaluation showed no
significant differences between the reaction times of
the different mock-ups. The Number and Graph
showed the shortest response time, see figure 3 and
4. These differences can be explained from the
design of the mock-ups. Presenting progress towards
Glanceability Evaluation of a Physical Activity Feedback System for Office Workers
55
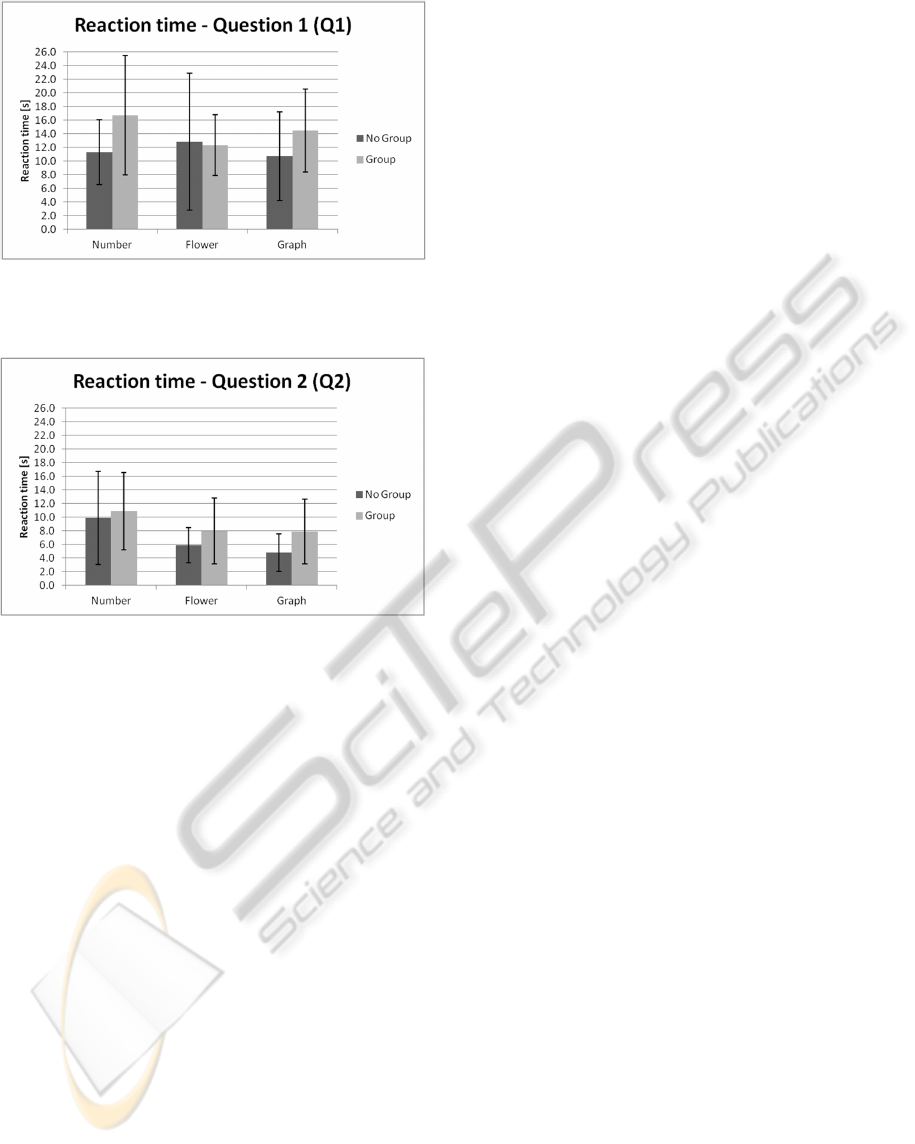
Figure 3: Average reaction time and standard deviation of
question 1 about “sufficient physical activity”, given per
condition.
Figure 4: Average reaction time and standard deviation of
question 2 about “reaching the personal goal”, given per
condition.
a goal by displaying a percentage is one of the
simplest ways. Following the definition of
glanceability this should be the most glanceable user
interface. The Graph showed more details about the
amount of physical activity. It can take longer to
process the more detailed information. Using a
flower as a metaphor for displaying the amount of
physical activity is received as joyful, but less
intuitive for displaying the amount of physical
activity.
No significant differences were found between
the two conditions of ‘no group’ and ‘group’
feedback. The ‘no group’ condition showed a shorter
reaction time for all the participants on the first two
questions. This difference can be explained by the
extra time the user needs to interpret the extra
information of the group. Group information does
affect the correctness of the answer to the question
during the user evaluation. In the ‘group’ condition
only one participant was not able to answer a
question, while seven participants of the ‘group’
condition were not able to answer one of the
questions.
The results of interviews showed that the
participants preferred the ‘number’ mock-up. The
number is also most glanceable mock-up.
A small group of participants showed privacy
concerns of displaying public and central feedback
on a large screen in an office setting.
When designing a glanceable user interface for
the system, it should be taken into account if group
information is necessary to influence the user.
5 FUTURE WORK
A next step in designing a user interface for the
system is the personification of the user interface by
adding an embodied conversation (ECA) agent to
the user interface of the system. The results from
previous studies indicate that the use of an ECA can
have a positive effect on how the feedback is
received by the user in behaviour change support
systems. This can eventually lead to a better
performance of the coaching program in the future
and a more effective way to support users to change
their behaviour (Schulman & Bickmore 2009;
Blanson Henkemans et al. 2009; Berry et al. 2005).
The results of this user evaluation and the effect of
adding an ECA to the UI are subject of future user
evaluations with a working prototype of the system.
ACKNOWLEDGEMENTS
The authors would like to thank all subjects for
participating in this study.
The work of R. Klaassen en H. op den Akker
was funded by the European Commission, within the
framework of the ARTEMIS JU SP8 SMARCOS
project 100249 - (www.smarcos-project.eu).
The work of S. Boerema and H. Hermens was
funded by the SENIOR project, within the program
of economical innovation ‘Pieken in de Delta Oost-
Nederland’, The Netherlands.
REFERENCES
Ajzen, I., 1991. The theory of planned behavior.
Organizational Behavior and Human Decision
Processes, 50(2), pp.179–211.
Bandura, A., Adams, N. & Beyer, J., 1977. Cognitive-
processes mediating behavioral change. Journal of
Personality and Social Psychology, 35(3), pp.125–
139.
EHST/ICGREEN 2012
56

Berry, D.C., Butler, L.T. & De Rosis, F., 2005. Evaluating
a realistic agent in an advice-giving task. International
Journal of Human Computer Studies, 63(3), pp.304–
327.
Blanson Henkemans, O.A. et al., 2009. An online lifestyle
diary with a persuasive computer assistant providing
feedback on self-management. Technology and Health
Care, 17(3), pp.253–267.
Boerema, S.T., 2009. Centralised physical activity
feedback; encouraging employees working in an office
setting to be sufficiently physically active. Master
Thesis. Enschede, The Netherlands: Twente
University.
Bouten, C.V.C. et al., 1996. Daily physical activity
assessment: Comparison between movement
registration and doubly labeled water. Journal of
Applied Physiology, 81(2), pp.1019–1026.
Chan, C.B., Ryan, D.A.J. & Tudor-Locke, C., 2004.
Health benefits of a pedometer-based physical activity
intervention in sedentary workers. Preventive
Medicine, 39(6), pp.1215–1222.
Cocker, K.A.D., Bourdeaudhuij, I.M.D. & Cardon, G.M.,
2008. The effect of pedometer use in combination with
cognitive and behavioral support materials to promote
physical activity. Patient Education and Counseling,
70(2), pp.209–214.
Dinger, M.K. et al., 2007. Comparison of two email-
delivered, pedometer-based interventions to promote
walking among insufficiently active women. Journal
of Science and Medicine in Sport, 10(5), pp.297–302.
Guthold, R. et al., 2008. Worldwide Variability in
Physical Inactivity. A 51-Country Survey. American
Journal of Preventive Medicine, 34(6), pp.486–494.
Hildebrandt, V.H., TNO - Meer bewegen op het werk,
Available at: http://www.tno.nl/downloads%5CTNO-
KvL%20Folder%20Meer%20bewegen%20op%20het
%20werk.pdf.
Matthews, T., 2006. Designing and evaluating glanceable
peripheral displays. In Proceedings of the Conference
on Designing Interactive Systems: Processes,
Practices, Methods, and Techniques, DIS. pp. 343–
345.
Matthews, T., Rattenbury, T. & Carter, S., 2007. Defining,
designing and evaluating peripheral displays: An
analysis using activity theory. Human-Computer
Interaction, 22(1-2), pp.221–261.
Nutbeam, D. & Harris, E., 2004. Theory in a Nutshell: A
Practical Guide to Health Promotion Theories
METRC., McGraw-Hill Book Company Australia.
Quesenbery, W., 2003. The five dimensions of Usability.
In Content & complexity: information design in
technical communication. Routledge, p. 368.
Rosenstock, I., 1966. Why people use health services.
Milbank Memorial Fund Quarterly-Health and
Society, 44(3), pp.94–127.
Schulman, D. & Bickmore, T.W., 2009. Persuading users
through counseling dialogue with a conversational
agent. In Proceedings of the 4th Int. Conf. on
Persuasive Technology. Persuasive ’09. ACM.
Stone, D. et al., 2005.
User Interface Design and
Evaluation, Morgan Kaufmann.
Glanceability Evaluation of a Physical Activity Feedback System for Office Workers
57
