
BISATIC SAR SLC IMAGE MODELLING AND
INTERFEROMERIC GENERATION
Dimitar Minchev, Andon Lazarov
Burgas Free University, Faculty of Computer Science and Engineering, Burgas, Bulgaria
mitko@bfu.bg, lazarov@bfu.bg
Keywords: SAR, InSAR, BInSAR, LFM, SLC, Signal Model, Image Modelling, Intergerogram generation.
Abstract: This work addresses the model of Bistatic Interferometric Synthetic Aperture Radar BInSAR imaging
process. BInSAR geometry with multiple satellite receivers is thoroughly mathematical described. A linear
frequency modulated (LFM) SAR signal model and single look complex (SLC) image are derived. To
verify proposed models an implementation of the processing chain, implemented in MATLAB environment
is performed.
1 INTRODUCTION
Imaging capability of Synthetic Aperture Radar
(SAR) Distributed Satellite-borne Systems (DSS)
with Bistatic Interferometric Synthetic Aperture
Radar (BInSAR) on board is already proven Earth
Remote Sensing technique. BInSAR DSS system
error analysis and design method are investigated in
(Li Wei, 2002). The potential benefits, drawbacks
and problems associated with a close formation
flight for an along-track interferometry SAR mission
is discussed in (Eberhard, 2004). A generalized
approach of formation configuration of BInSAR
DDS from the point of system performance
optimization is presented in (Huang, 2007). Concept
for decomposition of solid baseline, a new method to
avoid the max detection error and simulation
experiment accompanied by very good result is
shown in (Xilong, 2007). Effective method to
eliminate the effect of baseline instability on SAR
image and interferometric measure is proposed in
(Zhang, 2007). A multi-baseline polarimetric
synthetic aperture radar interferometry (Pol-InSAR)
technique that allows more appropriate
reconstruction of the quasi-three-dimensional spatial
distribution of scattering processes within natural
media is presented in (Stebler, 2002).
The main purpose of this work is to propose a
universal geometrical model of the Earth surface
topography, as well as mathematical model of the
reflected LFM SAR signals from that relief and
algorithms for complex image extraction and
interferogram generation.
2 GEOMETRY AND
KINEMATICS OF SAR
SCENARIO
Consider Bistatic Interferometric Synthetic Aperture
Radar (BInSAR) geometry (Fig.1), defined in
coordinate system Oxyz. SAR system is located on a
satellite with a trajectory given by the following
vector equation.
⎟
⎠
⎞
⎜
⎝
⎛
−+= p
N
Tp
p
2
)(
0
VRR
(1)
where:
)0(
0
RR
=
is the distance vector from the
origin of the coordinate system to the satellite in the
moment t = 0; V is the satellite velocity vector;
p
T
is the signal repetition period; p is the index of
emitted pulses; N is the full number of emitted
pulses.The vector equation (1) is projected in
coordinate system Oxyz, which yields
⎟
⎠
⎞
⎜
⎝
⎛
−−=
⎟
⎠
⎞
⎜
⎝
⎛
−−=
⎟
⎠
⎞
⎜
⎝
⎛
−−=
p
N
TVzpz
p
N
TVypy
p
N
TVxpx
pz
py
px
2
)(
2
)(
2
)(
0
0
0
(2)
80
Minchev D. and Lazarov A.
BISATIC SAR SLC IMAGE MODELLING AND INTERFEROMERIC GENERATION.
DOI: 10.5220/0005414300800083
In Proceedings of the First International Conference on Telecommunications and Remote Sensing (ICTRS 2012), pages 80-83
ISBN: 978-989-8565-28-0
Copyright
c
2012 by SCITEPRESS – Science and Technology Publications, Lda. All rights reserved

where
)(px , )(py and )(pz are the satellite
coordinates in the moment p;
)0(
0
xx = , )0(
0
yy
=
and
)0(
0
zz = are the satellite coordinates in the
moment p = N/2;
α
=
cosVV
x
,
β
= cosVV
y
,
δ= cosVV
z
are coordinates of the velocity vector;
αcos
,
βcos
,
βcos
are the guiding cosines of the
velocity vector.
The surface depicted in coordinate system Oxyz
analytically can be presented as a two dimensional
function, i.e. z as a function of coordinates x and y,
which in discrete form is given by the following
equation (3)
()
[]
[]
[]
2
2
2253
222
)1(exp
3
1
exp
5
10
)1()(exp)1(3
,
mnmn
mnmnmnmn
mn
mnmnmn
mnmnmnmn
yx
yxyx
x
yxx
yxzz
−+−−
−
⎟
⎠
⎞
⎜
⎝
⎛
−−−
+−−−
==
(3)
where
Mmx
mn
Δ= and Nny
mn
Δ= are discrete
coordinates in the plane Oxy;
M
Δ and
N
Δ
are
dimensions of the grid’s cell; m and n - relative
discrete coordinates (indexes) on axes Ox and Oy.
Coordinates;
mn
x ,
mn
y and
mn
z define the
distance vector
mn
R of each point scatterer.
Figure 1: Bistatic InSAR Geometry.
Assume that in each grid’s cell with dimensions
(
M
Δ and
NΔ
) and coordinates (
mn
x ,
mn
y ) one
prominent point scatterer is located. During the
process of observation the distance vector
)(p
mn
R
from SAR located on the satellite to the dominant
point scatterer, defined by the geometrical vector
mn
R , can be expressed by the following vector
equation
mnmn
pp RRR −= )()(
(4)
The geometry information of the observed surface is
contained in the phase of the complex amplitude of
the reflected signal from each point scatterer which
is proportional to the module of the distance vector
)(pR
mn
defined by the expression
[][][]
222
)()()()(
mnmnmnmn
zpzypyxpxpR −+−+−=
(5)
While modelling the process of observation the
value of the parameter
)(pR
mn
is calculated for
each p, m and n.
3 LFM SAR SIGNAL MODELING
AND SLC IMAGE
RECONSTRUCTION
3.1 SAR signal modelling algorithm
1. Compute the distance from SAR to each point
scatterer from the observed surface for each
particular moment p by equation (5).
2. Compute time delay parameter for each point
scatterer from the surface
)(pt
mn
by the expression
c
pRpR
pt
RX
mn
TR
mn
mn
)()(
)(
1
+
=
(6)
where
8
3.10 c =
m/s is the speed of light,
TR
mn
R
is the
distance from transmitter to the surface;
1RX
mn
R
is the
distance from the surface to the receiver satellite.
3. Compose an one-dimensional array with entities
of all time delays
)(pt
mn
arranged in ascending
order and define minimum
)(
min
pt
mn
.
4. Compute generalized time parameter of the
reflected signal:
)()1()(),(
min
ptTkptpkE
mnmnmn
−Δ−
+
=
(7)
5. Compute LFM signal, reflected by mn–th point
scatterer for each sample k = {1, 2, …, 256} and
emitted pulse p = {1, 2,…, 256}.
()
[
]
{
}
2
),(),(exp.),( pkEbpkEjapkS
mnmnmnmn
+=
ω
(8)
6. The results of the computation of are placed in a
two dimensional array
],[ pk .
The SAR signal, reflected from a particular point
scatterer is limited within pulse duration, which can
be described by element wise multiplication of the
signal
),( pkS
mn
(8) with a rectangular function i.e.
(9)
where
),(.),(
rect,
pkS
T
E
pkS
mn
k
mn
⎟
⎟
⎠
⎞
⎜
⎜
⎝
⎛
= rect
Bisatic SAR SLC Image Modelling and Interferomeric Generation
81
⎪
⎪
⎩
⎪
⎪
⎨
⎧
≥<
<≤
=
⎟
⎟
⎠
⎞
⎜
⎜
⎝
⎛
1,0,0
10,1
kk
k
k
T
E
T
E
T
E
T
E
rect
(10)
is the rectangular function described by two
dimensional matrix [k, p], containing zeros and ones
in positions according to conditions (10).
The element wise multiplication of the matrix
),( pkS
mn
with rectangular matrix function
⎟
⎟
⎠
⎞
⎜
⎜
⎝
⎛
k
T
E
rect
yields a matrix
),(
rect,
pkS
mn
, which
contains all necessary values of the SAR, reflected
by particular pint scatterer. Superposition of
reflected SAR signals over dimensions m and n
yields the values of the interferon complex SAR
signal
),( pkS , written as entities of a two
dimensional matrix [p, k], i.e.
∑∑
==
=
M
m
N
n
mn
pkSpkS
11
rect,
),(),(
(11)
3.2 SAR SLC image reconstruction
1. Demodulation of the SAR signal by multiplication
of two dimensional matrix
),( pkS with complex
conjugated emitted signal, i.e.
[
]
{
}
2
))1(()1(exp).,(),(
~
TkbTkjpkSpkS Δ−+Δ−=
ω
(12)
2. SLC image reconstruction by standard two
dimensional fast Fourier transform
)],(
~
(FFT[FFT),( pkSpkI
kp
=
&
(13)
The matrix
),( pkI
&
represents the complex image of
the observed surface, containing amplitude and
phase information for each pixel from the surface.
In Fig. 2 real (a) and imaginary (b) parts of the
complex SAR signal are presented.
3.3 Interferogram generation
An interferogram is generated by complex conjugate
multiplication of obtained two Single Look Complex
(SLC) images.
4 NUMERICAL EXPERIMENT
Distributed Satellite-borne Systems (DSS) with
Bistatic Interferometric Synthetic Aperture Radar
(BInSAR), formed by three SAR satellite systems
observe Earth surface witch is modelled by Matlab
“peaks” function. T
R
is the transmit satellite, while
R
X1
and R
X2
are receivers satellites. Satellites’
trajectory parameters and SAR data are presented in
Table 1.
Table 1: Trajectory and SAR parameters.
T
R
R
X1
R
X2
x
0
2.10
4
10
4
1,2.10
4
y
0
2.10
4
10
4
10
4
z
0
8.10
5
8.10
5
8.10
5
Np 512 512 512
N
k
512 512 512
m_n 256 256 256
Δ 2 2 2
V(m/s) 1000 1000 1000
T
p
(s) 0.025 0.025 0.025
T
k
(s) 0.0025 0.0025 0.0025
F (Hz) 10
10
10
10
10
10
ΔF(Hz) 2.5.10
7
2,5.10
7
2,5.10
7
Baseline between T
R
and R
X1
is =
14142,136 meters. Baseline between T
R
and R
X2
is
12806,248 meters. Baseline between R
X1
and R
X2
is
2000 meters. Computational results are shown in
Figs. 2-6.
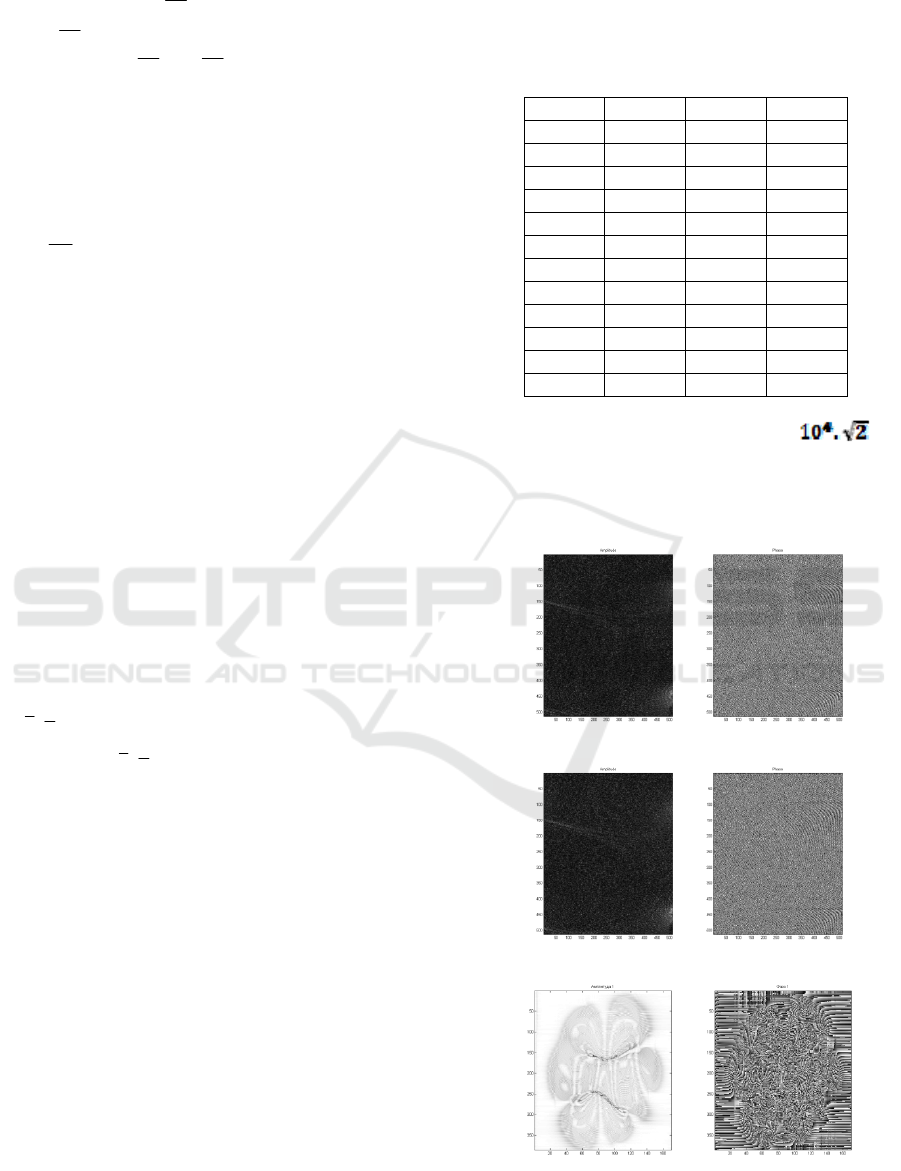
Figure 2: SAR1 SLC image
Figure 3: SAR2 SLC image
Figure 4: Reconstructed RX1 SAR image (amplitude and
phase)
First International Conference on Telecommunications and Remote Sensing
82

Figure 5: Reconstructed RX2 SAR image (amplitude and
phase)
Figure 6: Interferometric phase based on RX1 SLC image
and RX2 SLC image
In Fig. 6 clearly can be seen interferometric fringes
proportional to heights and depths of the observed surface.
5 CONCLUSION
In this work a model of Bistatic Interferometric
Synthetic Aperture Radar (BInSAR) imaging
process is discussed. Bistatic InSAR geometry with
thoroughly mathematical description of the observed
surface and kinematic equations is suggested. LFM
SAR signal’s model is derived. SLC image
reconstruction algorithm with two dimensional FFT
procedures is implemented. To verify proposed
geometrical and signal models a simulation of the
processing chain, implemented in MATLAB
environment is illustrated. SAR complex
interferogram containing amplitude and phase
information is produced.
ACKNOWLEDGEMENTS
This work is supported by NATO ESP.EAP.CLG.
983876 and MEYS, Bulgarian Science Fund the
project DTK 02/28.2009, DDVU 02/50/2010.
REFERENCES
Li Wei, Li Chunsheng, 2002. A novel system parameters
design and performance analysis method for
Distributed Satellite-borne SAR system, Advances in
Space Research, Volume 50, Issue 2, 15 July 2012,
Pages 272-281, ISSN 0273-1177, 10.1016 /j.asr.
2012.03.026, http://www.sciencedirect.com/science
/article/pii/S0273117712002244
Xilong, S., Anxi, Y., Zhen, D., Diannong, L., 2007.
Research on differential interferometry for spaceborne
bistatic SAR, (2007) International Geoscience and
Remote Sensing Symposium (IGARSS), art. no.
4423252, pp. 2118-2121., http://www.scopus.com
/inward/record.url?eid=2-s2.0-82355161233&partner
ID=40&md5=5834d01988df2fddf978780e3d16301a
O Stebler, E Meier, D Nüesch, 2002. Multi-baseline
polarimetric SAR interferometry—first experimental
spaceborne and airborne results, ISPRS Journal of
Photogrammetry and Remote Sensing, Volume 56,
Issue 3, April 2002, Pages 149-166, ISSN 0924-2716,
10.1016/S0924-2716(01)00049-1, http://www.scien
cedirect.com/science/article/pii/S0924271601000491
Zhang, Q.-L., Lu, Y.-B. 2007. The study on imaging
algorithm of formation flying satellites InSAR system,
2007 1st Asian and Pacific Conference on Synthetic
Aperture Radar Proceedings, APSAR 2007, art. no.
4418547, pp. 27-31., http://www.scopus.com/inward/
record.url?eid=2-s2.0-47349123731&partner
ID=40&md5=ade1b6b133e46f02bc5116b25b012cac
Huang, H., Liang, D., 2007. Optimization design approach
of distributed spaceborne InSAR formation, Hangkong
Xuebao/Acta Aeronautica et Astronautica Sinica, 28
(5), pp. 1168-1174., http://www.scopus.com/inward/
record.url?eid=2-s2.0-35348988096&partner
ID=40&md5=6e9eb60a36628c5d67a06ebf58346dec
Eberhard Gill, Hartmut Runge, 2004. Tight formation
flying for an along-track SAR interferometer, Acta
Astronautica, Volume 55, Issues 3–9, August–
November 2004, Pages 473-485, ISSN 0094-5765,
10.1016/j.actaastro.2004.05.044., http://www.scien
cedirect.com/science/article/pii/S0094576504001870
Bisatic SAR SLC Image Modelling and Interferomeric Generation
83
