
Continuous Nasal Airflow Resistance during Birch Pollen
Provocation Test
Tiina M. Seppänen
1
, Olli-Pekka Alho
2
, Aleksi Laajala
2
, Elina Rahkola
2
and Tapio Seppänen
1
1
Department of Computer Science and Engineering, University of Oulu, Oulu, Finland
2
Department of Otorhinolaryngology, University of Oulu, Oulu, Finland
Keywords: Allergy, Birch Pollen, Challenge, Nasal Resistance, Respiration, Provocation Test.
Abstract: Even 50% of population suffers from allergic symptoms in some countries. There is a need for an objective
measurement method giving an accurate, reliable and continuous measurement data about the dynamic nasal
function. A novel method to assess unobtrusively the continuous nasal airflow resistance using calibrated
respiratory belts is used to produce a continuous nasal airflow resistance during the birch pollen provocation
test. Ten birch pollen allergic and eleven non-allergic volunteers were recruited and measured. A
statistically significant change in the nasal airflow resistance was found due to the challenge in the allergic
group while no statistically significant change was found in the non-allergic group. Unique continuous nasal
airflow resistance curves were derived to show the dynamic changes in the nasal airflow resistance during
the provocation test. The continuous curves show in great detail fast and slow reactions to nasal
provocations, which may be helpful in studying the reactivity of patients. The presented method could
increase the reliability and accuracy of diagnostics and assessment of the effect of nasal treatments.
1 INTRODUCTION
Allergic rhinitis is diagnosed when specific antigens
can be detected in the blood and the patient has
allergic symptoms. For instance, eosionophilic cells
can be found in allergic and inflammatory
conditions. In Finnish population, about 15-25% of
people have allergic rhinitis, while in other countries
this value can be even over 50%. Allergic rhinitis is
an inheritable disease and patients with allergic
rhinitis have about threefold risk to get asthma.
Typical symptoms of the allergic rhinitis are nasal
obstruction, rhinorrhea, nasal itching, sneezing and
eye irritation (Bousquet et al., 2008). In Finland, the
birch pollen is a common cause of the allergic
symptoms such as intermittent seasonal allergic
rhinitis.
The presence of nasal allergy can be verified by
nasal provocation tests in which subjects are
challenged with the suspected allergen. After that,
changes in their subjective feelings of symptoms,
amount of secretions and the respiratory function of
nose are measured. Nasal provocation tests are done
for instance in the diagnosis of work-related
respiratory diseases (occupational asthma,
occupational rhinitis), at the beginning of
desensitization, the diagnosis of chronic rhinitis and
in scientific research.
Examples of objective ways to measure the
function of the nose are acoustic rhinometry and
rhinomanometry. Acoustic rhinometry assesses nasal
geometry by measuring cross-sectional areas of the
nasal cavities. Rhinomanometer measures
simultaneously pressure and airflow from which
nasal airflow resistance is determined (Chaaban and
Corey, 2011). Nasal cavities are measured one at a
time and the total nasal resistance is calculated based
on unilateral resistances. This makes it impossible to
determinate the accurate total resistance in a certain
time point, as there is an ongoing variation in
unilateral nasal resistance with time. Furthermore,
the resistance is described characteristically as one
number that derives only from a few breathing
cycles of data. In nasal provocation tests, the major
response is the rise in the nasal resistance. The rise is
rapid (minutes) and the timing may vary in different
individuals. This makes it difficult to be detected
with rhinomanometer. One possibility is to assess
the momentary resistance with the rhinomanometer
in certain time-intervals, but this has been shown to
give inconsistent and variable results with low
reproducibility (Pirilä et al., 1997); (Pirilä and
5
M. Seppänen T., Alho O., Laajala A., Rahkola E. and Seppänen T..
Continuous Nasal Airflow Resistance during Birch Pollen Provocation Test.
DOI: 10.5220/0004181300050010
In Proceedings of the International Conference on Bio-inspired Systems and Signal Processing (BIOSIGNALS-2013), pages 5-10
ISBN: 978-989-8565-36-5
Copyright
c
2013 SCITEPRESS (Science and Technology Publications, Lda.)

Nuutinen, 1998); (Hohlfield et al., 2010).
There is clearly a need for a method giving an
accurate, reliable and continuous measurement data
about the nasal function. This kind of measurement
could provide more information about the rapid
changes in nasal function for instance during allergy
provocation tests.
Recently, a novel method was presented to assess
nasal airflow resistance in a way that provides a
continuous resistance values and applies a minimally
obtrusive measurement method (Seppänen et al.,
2009; 2010). The pressure recording is produced
with a nasopharyngeal catheter and the flow
recording is produced with calibrated respiratory
belts. The nasal airflow resistance is calculated for
each signal sample at any sampling frequency,
making it possible to discover rapid changes in
resistance. A novel calibration method of respiratory
belts was presented in Seppänen et al. (2011). It is
an extension to the multiple linear regression method
which is conventionally used for calibration of
respiratory belts. The new method improves greatly
the accuracy of the calibration. In the data used, R
2
increased 9% for piezo belts and 10 % for inductive
belts; RMSE (Root Mean Square Error) decreased
36% for piezo belts and 43% for inductive belts. R
2
is a coefficient of determination between the
spirometer signal and the flow prediction. RMSE, in
its turn, is a measure of the difference between the
spirometer signal and flow prediction.
In this work, the above mentioned methods are
combined to study nasal airflow resistance changes
during a provocation test. The used methods and
data collection is first described. Quantitative results
of resistance changes are then presented between
two subject groups – birch pollen allergic and non-
allergic subjects - to demonstrate their reactivity to
the different protocol stages. In addition, continuous
resistance curves are presented from selected
subjects to discuss the dynamic changes in their
nasal resistance during the provocation test.
2 METHODS AND DATA
2.1 Study Subjects
Ten (3 female, 7 male) birch pollen allergic and
eleven (3 female, 8 male) non birch pollen allergic
adult volunteers were recruited. The mean (SD) age
of the allergic and non allergic subjects was 24 (1)
and 24 (3) years, respectively. A medical doctor
examined all the subjects. The specific IgE for birch
pollen was determined from blood for all of them to
determine whether they are allergic to birch pollen
or not. As mentioned in section 1, there are different
kinds of allergy symptoms. Some allergic subjects
suffer only one of them while, others can have
several symptoms. The specific IgE value does not
indicate the type of allergic symptoms.
The volunteers had to be free of any acute
respiratory symptoms during the prior two weeks to
the measurements. They also had to be free of heart
diseases, brain circulatory disorders and surgical
operations of nose. Volunteers were not allowed to
be under medication that affects the function of their
nose during a specific time period before the
measurement. They were not allowed to have a
smoke for four hours and heavy meal, caffeine or
other stimulative products for two hours before
measurement. Pregnant volunteers were rejected as
well.
The study protocol was approved by the
institutional Ethics Committee of Oulu University
Hospital. All volunteers gave written informed
consent. Background information was gathered
using a questionnaire. Measurements were carried
out in the spring before the birch pollen season.
2.2 Challenge Protocol
The signals were recorded with a polygraphic
recorder (TrackIt, Lifelines Ltd, Hampshire, UK)
with the sampling frequency of 100 Hz. The
pressure recording was produced with a
nasopharyngeal catheter (CH 06, Unomedical A/S,
Denmark) (diameter 1 mm). Figure 1 shows the
setup for the nasal pressure measurement. The
pressure data of the recorder was calibrated to
physical units (Pascal). Respiratory belts (Ultima
SmartBelt, Braebon Medical Corp., Ogdensburg,
NY, USA) were attached to the subjects’ chest and
abdomen. For calibrating the signals from
respiratory belts, simultaneous flow signal was
recorded with a spirometer (SpiroStar USB, Medikro
Oy, Kuopio, Finland), as described below.
Figure 1: Measurement of nasal pressure signal.
The subjects first sat peacefully for a period of
BIOSIGNALS2013-InternationalConferenceonBio-inspiredSystemsandSignalProcessing
6

30 min prior to the measurement. They were
instructed to sit in back upright position avoiding
movements during all measurements. First,
respiratory belt data and flow data were recorded for
one minute with the polygraphic recorder and the
spirometer, respectively. The data was used for
calibrating the respiratory signals to flow signal as
described in Section 2.3. The respiratory belts were
kept on during the whole measurement protocol.
The spirometer was removed from the subject. A
catheter was inserted 8 cm deep along the floor of
nasal cavity into the nasopharynx, the tip of the
catheter lying 1 cm anterior from the back wall of
the nasopharynx. The differential pressure sensor
(Braebon Ultima Dual Airflow Pressure Transducer)
referenced to the atmospheric pressure was
connected to the catheter. Moreover, a sterile filter
(Minisart, Sartorius Ltd, Epsom, Uk) was used for
protection in between the catheter and the pressure
sensor. Air was blown through the catheter to inhibit
the nasal secrete blocking it. This was done before
each protocol phase and every time that the catheter
blocking was detected.
At the first protocol phase, the baseline was
recorded for 10 min. At the second protocol phase,
the birch pollen challenge was inserted carefully on
the anterior nasal mucosa, after which pressure and
airflow were recorded for 20 min. Finally, the
catheter was removed and the calibration data
collection was repeated with the spirometer.
After recording, all the signals were validated
manually by using visualization software. All
detected disturbances, originated for example from
sneezing, snuffling and mouth opening, were deleted
from signals before analysis. Care was taken to
maintain the correct synchrony between the signals.
2.3 Calibration Method of the
Respiratory Belts
A prediction of the respiratory airflow F
est
is
commonly calculated from the respiratory belt
signals by applying the method of multiple linear
regression (Tobin, 1992). This conventional model
can be established by fitting the following linear
model to the time-synchronized signals:
(1)
where the predictor variables s
rc
and s
ab
are the
respiratory belt signals from the chest and abdomen,
respectively, and ε is zero-mean Gausian error. In
this model, one sample of each predictor variable is
used at a time to predict the response variable.
In this study, the calibration of the respiratory
belts was based on a special case of the model
published previously (Seppänen et al., 2011). Figure
2 depicts a block diagram as a MISO (multiple
input, single output) system consisting of two FIR
filters and a delay element. In this model, only linear
terms of the original filter-bank polynomial are used.
Figure 2: Extended linear model.
The new model is an extension to the
conventional model with the option to use the
window size of W samples for each prediction. This
was found to offer significantly better performance.
The calibration model now becomes:
(2)
Vector notation (bold letters) is used to denote that
W consecutive samples are included as components
in the predictor variable, and parameters are vectors
of dimension W. Terms
and
denote tap
coefficients of filters FIR
1
and FIR
2
in Figure 2,
respectively. Superscript T denotes vector transpose.
During calibration, the W tap coefficients of the
FIR units are calculated with the method of least-
squares. Respiratory belt signals and the
simultaneous spirometer signal are input to
regression analysis which yields optimal coefficients
and minimal prediction error for both filters.
There is a small delay between the spirometer
flow signal and the respiratory belt signals due to 1)
the time it takes for the airflow to propagate from
the chest to the mouth and 2) the internal delays of
the measuring devices. In Figure 2, delay element
z
-D
is included at the output for this reason. The filter
coefficients were solved for each feasible delay
candidate as described above and the minimum error
in the flow estimate was used to determine the
optimal delay value.
In Seppänen et al. (2011), the window size 0.3
sec was found to give the best flow estimate and it
was used in this study as well.
+
z
-D
S
rc
S
ab
FIR
1
FIR
2
W ta
p
s
ContinuousNasalAirflowResistanceduringBirchPollenProvocationTest
7

2.4 Computation of the Continuous
Nasal Airway Resistance
A novel method to estimate continuous resistance of
the nasal airways using signals from the respiratory
effort belts and pressure signal from nasopharyngeal
catheter inserted transnasally into the nasopharynx
was recently presented by Seppänen et al. (2009;
2010). A least-mean-square (LMS) extension for the
model of Broms was developed that adapts to the
time-varying characteristics of the nasal functioning.
In the model, pressure is presented as a function of
flow, and an instantaneous resistance can be
calculated from the model after estimating the model
parameters at each time instant from the input
signals. Although the method allows for setting any
reference pressure value used in clinical
rhinomanometry, we set it to 25 Pa in this study,
since pressure levels do not always achieve the
conventional reference values of 75 Pa or 150 Pa, as
also pointed out in Naito et al. (1993) and Kohler et
al. (2006). Before applying the resistance calculation
method, the respiratory belts are calibrated, as
described in Section 2.3 above. For further details,
refer to the original publication (Seppänen et al.,
2009). Instantaneous resistance values are calculated
over the measurement data and shown as dynamic
plots over time.
Statistical significance of resistance changes in
the test subjects was assessed by Wilcoxon signed-
rank test. Statistical significance between the subject
groups, in its turn, was assessed by Wilcoxon rank-
sum test. The null-hypothesis for statistical tests was
that there are no differences in the medians of given
data sets.
3 RESULTS
3.1 Resistance Level Changes
First, the respiratory belts were calibrated from the
first 1 min calibration recording (see Section 2.2).
The continuous nasal airflow resistance was then
computed for the last 5 min of the baseline. Then,
the respiratory belts were calibrated from the second
1 min calibration recording (see Section 2.2).
Finally, the continuous nasal airflow resistance was
computed for the last 5 min of the birch challenge
phase. The calibration was performed separately for
both phases in order to avoid bias due to possible
changes in the breathing style and subsequent
mismatch of the calibration model to the data.
Especially allergic volunteers had significant
changes in their breathing style after the birch
challenge.
Table 1 lists the mean nasal airflow resistance for
each birch pollen allergic volunteer in the two
phases and the group medians. Table 2 lists the
mean resistances along with the group medians for
non-allergic volunteers. Medians are used because
data size is small and non-normal.
Table 1: Resistance values for allergic volunteers.
Baseline After birch challenge
Subject Resistance [Pa/dm
3
/s] Resistance [Pa/dm
3
/s]
1 103 145
2 120 245
3 63 111
4 52 441
5 125 246
6 268 637
7 130 382
8 79 124
9 101 120
10 115 134
Median 109 195
Table 2: Resistance values for non-allergic volunteers.
Baseline After birch challenge
Subject Resistance [Pa/dm
3
/s] Resistance [Pa/dm
3
/s]
1 135 211
2 42 43
3 56 59
4 127 196
5 273 205
6 104 108
7 196 163
8 99 72
9 140 103
10 56 69
11 92 92
Median 104 103
There was a statistically significant change in the
resistance values between the baseline and after
birch challenge in the group of birch pollen allergic
BIOSIGNALS2013-InternationalConferenceonBio-inspiredSystemsandSignalProcessing
8
volunteers (p = 0.002). Respectively, in the group of
non-allergic volunteers, there was no statistically
significant change (p = 0.922).
In the baseline, the median resistance was 109
Pa/dm
3
/s and 104 Pa/dm3/s for the allergic and non-
allergic group, respectively. There was no
statistically significant difference in the resistance
between the two groups (p = 0.860).
After birch challenge, the median resistance was
195 Pa/dm3/s and 103 Pa/dm3/s for the allergic and
non-allergic group, respectively. There was a
statistically significant difference in the resistance
between the two groups (p = 0.015).
The median change in the subjects’ resistance
(between baseline and after birch challenge) was 85
Pa/dm3/s and 2 Pa/dm3/s for the allergic and non-
allergic group, respectively. There was a statistically
significant difference in the resistance change
between the two groups (p = 0.0017).
The median of the relative change in the
subjects’ resistance (between baseline and after
birch challenge) was 87% Pa/dm3/s and 2%
Pa/dm3/s for the allergic and non-allergic group,
respectively. There was a statistically significant
difference in the resistance change between the two
groups (p = 0.0011).
In Figures 3 and 4 below, the differences of the
allergic and control groups are depicted with boxplot
figures. The central mark is the median on each box,
while the edges of the boxes are the 25th and 75th
percentiles. In x axis, mark ‘1’ denotes the baseline
phase and mark ‘2’ the after birch challenge phase.
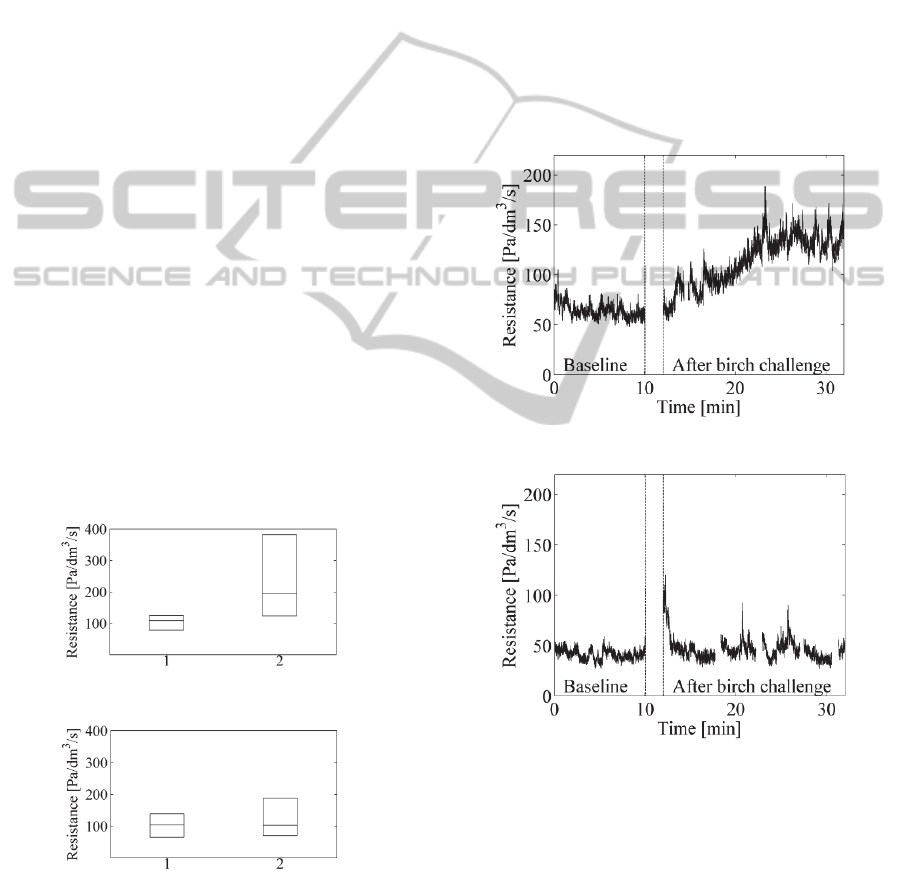
Figure 3: Boxplots for birch allergic volunteers.
Figure 4: Boxplots for non-allergic volunteers.
In Figures 3 and 4, it can be seen clearly that the
deviation of the resistance values after birch pollen
challenge is much larger in the allergic group than in
the control group. Figure 3 also demonstrates the
fact that the birch allergy causes symptoms in the
nose in varying degrees in the allergic persons.
3.2 Dynamic Resistance Changes
Pressure and respiratory belt signals were recorded
10 min in baseline and 20 min after the birch pollen
challenge. Continuous nasal airflow resistance
values were computed for these phases. The
example figures for continuous resistance signals are
presented for a birch pollen allergic and non-allergic
volunteer in Figure 5 and 6, respectively. The small
gaps in the signals are due to removing of the
artifacts. To our knowledge, this is the first time
that this kind of continuous resistance curves can be
presented for the provocation tests.
Figure 5: Resistance curve for allergic volunteer.
Figure 6: Resistance curve for one non-allergic volunteer.
In Figure 5, the resistance in the baseline is quite
stable except the initial elevation perhaps due to the
insertion of the nasal catheter just a moment ago.
After the birch pollen challenge, a significant
allergic reaction can be seen. The resistance
increases almost linearly for some ten minutes and
then settles to a much higher level than in the
baseline.
In Figure 6, the resistance in the baseline is quite
stable. Immediately after the birch pollen challenge,
ContinuousNasalAirflowResistanceduringBirchPollenProvocationTest
9

a clear initial reaction can be observed in the plot.
We speculate that this is more due to a transient
change in the breathing style than in the nasal
resistance. Following the short transition period, a
stable resistance curve follows which stays at the
same level as the baseline resistance.
4 CONCLUSIONS
A method to estimate continuous nasal airflow
resistance during a birch provocation test was
presented. The nasal resistance was estimated with a
new method that applies LMS filtering technique to
the nasal pressure signal and carefully calibrated
respiratory belt signals to update adaptively an
extended Broms model.
Quantitative results of resistance changes were
presented for two subject groups - birch pollen
allergic and non-allergic subjects - to demonstrate
their reactivity to the birch challenge. In the baseline
situation, the median resistance value was similar in
the groups. However, due to the birch challenge,
statistically significant changes in the individual
resistances were observed in allergic group, while no
statistically significant differences were observed in
the non-allergic group.
Continuous resistance curves were presented
from selected subjects to demonstrate the dynamic
changes in their nasal resistance during provocation
test. To our knowledge, this is the first time this kind
of dynamic resistance curves are presented for nasal
provocation tests.
Provocation tests like this one may cause
changes in the breathing style of subjects. This has
the undesired consequence of the fact that the
calibration model is not fully accurate all the time.
We are currently developing new adaptive
calibration methods to enhance the accuracy of flow
estimation for situations where the breathing style
changes.
Even at present, the method presented above
could improve the reliability and accuracy of
diagnostics and assessment of the effect of nasal
treatments.
ACKNOWLEDGEMENTS
We thank MD Aila Kristo for participating in the
collection of the data.
Finnish Cultural Foundation, North Ostrobothnia
Regional fund; Allergy Research Foundation; The
Research Foundation of the Pulmonary Diseases; and
The Finnish Research Foundation of Otology are
gratefully acknowledged for having provided
financial support for this work.
REFERENCES
Bousquet, J., Khaltaev, N., Cruz, A. A., Denburg, J.,
Fokkens, W. J., Togias A., et al., 2008. Allergic
Rhinitis and its Impact on Asthma (ARIA) 2008
Update (in collaboration with the World Healt
Organization, GA2LEN and AllerGen). Allergy,
63(Suppl 86), pp. 8-160.
Chaaban, M., and Corey, J. P., 2011. Assessing nasal air
flow: options and utility. Proceedings of the American
Thoracic Society, vol 8 March no. 1, pp. 70-78.
Hohlfeld, J.M., Holland-Letz, T., Larbig, M., Lavae-
Mokhtari, M., Wierenga, E., Kapsenberg, M., van Ree,
R., Krug, N., and Bufe, A., 2010. Diagnostic value of
outcome measures following allergen exposure in an
environmental challenge chamber compared with
natural conditions. Clinical & Experimental Allergy,
vol 40 issue 7, pp. 998-1006.
Kohler, M., Thurnheer, R., and Bloch, K. E., 2006. Side-
selective, unobtrusive monitoring of nasal airflow and
conductance. Journal of Applied Physiology, 101, pp.
1760-1765.
Naito, K., Iwata, S., Ohoka, E., Kondo, Y., and Taekuchi,
M., 1993. A comparison of current expressions of
nasal patency. European Archives of Oto-Rhino-
Laryngology, 250, pp. 249-252.
Pirilä, T., Talvisara, A., Alho, O-P, and Oja, H., 1997.
Physiological fluctuations in nasal resistance may
interfere with nasal monitoring in the nasal
provocation test. Acta Oto-laryngologica, 117, pp.
596-600.
Pirilä, T., and Nuutinen, J., 1998. Acoustic rhinometry,
rhinomanometry and the amount of nasal secretion in
the clinical monitoring of the nasal provocation test.
Clinical & Experimental Allergy, vol 28 issue 4, pp.
468-477.
Seppänen, T., Koskinen, M., Seppänen, T. M., and Alho,
O-P, 2009. Continuous assessment of nasal airflow
resistance by adaptive modeling. Physiological
Measurement, vol. 30, pp. 1197-1209.
Seppänen, T., Koskinen, M., Seppänen, T. M., and Alho,
O-P, 2010. Addendum to ´Continuous assessment of
nasal airflow resistance by adaptive modeling´ -
technical repeatability. Physiological Measurement,
vol. 31, pp. 1547-1551.
Seppänen, T. M., Alho, O-P, Koskinen, M., and Seppänen,
T., 2011. Improved calibration method of respiratory
belts by extension of multiple linear regression.
Proceedings of the 5
th
European Conference of the
International Federation for Medical and Biological
Engineering, 37:161-164.
Tobin, M., 1992. Breathing pattern analysis. Intensive
Care Medicine, 18, pp. 193-201.
BIOSIGNALS2013-InternationalConferenceonBio-inspiredSystemsandSignalProcessing
10
