
Evidencing the “Robot Phase Transition” in Human-agent Experimental
Financial Markets
John Cartlidge and Dave Cliff
Department of Computer Science, University of Bristol
Merchant Venturers Building, Woodland Road, Bristol BS8 1UB, U.K.
Keywords:
Software Agents, Financial Markets, Algorithmic Trading, High-frequency Trading, Computational Finance.
Abstract:
Johnson, Zhao, Hunsader, Meng, Ravindar, Carran, and Tivnan (2012) recently suggested the existence of a
phase transition in the dynamics of financial markets in which there is free interaction between human traders
and algorithmic trading systems (‘robots’). Above a particular time-threshold, humans and robots trade with
one another; below the threshold all transactions are robot-to-robot. We refer to this abrupt system transition
as the ‘robot phase transition’. Here, we conduct controlled experiments where human traders interact with
‘robot’ trading agents in minimal models of electronic financial markets to see if correlates of the two regimes
suggested by Johnson et al. (2012) occur in such laboratory conditions. Our results indicate that when trading
robots act on a super-human timescale, the market starts to fragment, with statistically lower human-robot
interactions than we would expect from a fully mixed market. We tentatively conclude that this is the first
empirical evidence for the robot phase transition occurring under controlled experimental conditions.
1 INTRODUCTION
In February 2012, Johnson et al. (2012) published a
working paper that immediately received widespread
media attention. Having analysed millisecond-by-
millisecond stock-price movements, Johnson et al.
(2012) argued that there was evidence for a phase
transition in the behaviour of financial markets at the
sub-second time-scale. At the point of this transition,
the market dynamics switch from a domain involv-
ing interactions among a mix of human traders and
‘robot’ automated algorithmic trading systems, to a
newly-identified domain in which the robots interact
only among themselves, with no human traders in-
volved. At sub-second timescales, below the transi-
tion, the robot-only market exhibits ‘fractures’ (ultra-
fast swings in price) that are undesirable, little under-
stood, and intriguingly appear to be linked to longer-
term instability of the market as a whole. This discov-
ery is potentially significant for the global financial
markets. If the short term micro-effects can indeed
give some indication of longer-term macro-scale be-
haviour then it is possible that new methods for mon-
itoring the stability of markets could be developed,
offering early-warning systems for major crashes.
In March 2012, we were commissioned by the
UK Government Office for Science’s Foresight unit
to run a series of agent-human experiments exploring
the robot transition under controlled laboratory condi-
tions (see Cartlidge and Cliff, 2012, for full details).
1
We did this by varying the speed/reaction of robot-
trader agents in OpEx (OpEx SourceForge, 2012), an
“artificial stock exchange” that had been developed as
an apparatus for evaluating human-robot and robot-
robot interaction in electronic markets. Our aim was
to test the hypothesis that when robot trader agents
are able to act/react on a timescale quicker than the
human traders are, we will see a transition from a
mixed market (where humans and robots are equally
likely to interact with one another) to a more frag-
mented market where robots are more likely to trade
with robots, and humans with humans. Our results
support the existence of the robot phase transition, al-
though in our experiments the effects of increasing
robot speed seem to give a progressive response rather
than a step-change. To our knowledge, this is the first
time that the robot phase transition, a newly identified
real-world phenomenon, has been synthesised under
1
Our study was one of the 31 background reviews com-
missioned by the UK Government Office for Science’s
Foresight project investigating the future of computer trad-
ing in the financial markets. The final report from that in-
vestigation was published in October 2012, and is available
at: http://bit.ly/UvGE4Q.
345
Cartlidge J. and Cliff D..
Evidencing the “Robot Phase Transition” in Human-agent Experimental Financial Markets.
DOI: 10.5220/0004185603450352
In Proceedings of the 5th International Conference on Agents and Artificial Intelligence (ICAART-2013), pages 345-352
ISBN: 978-989-8565-38-9
Copyright
c
2013 SCITEPRESS (Science and Technology Publications, Lda.)

laboratory conditions.
The remainder of this paper is structured as fol-
lows. In Section 2 we introduce relevant background
material, before describing our experimental methods
in Section 3. Results are presented in Section 4 and
discussed in Section 5. Finally, Section 6 concludes.
2 BACKGROUND
An ‘ideal’ market can be perfectly described by the
aggregate quantity supplied by sellers and the aggre-
gate quantity demanded by buyers at every price-point
(i.e., the market’s supply and demand schedules). At
some price-point, the quantity demanded will equal
the quantity supplied. This is the theoretical mar-
ket equilibrium, with price and quantity (P
0
, Q
0
) de-
termined by the intersection between the supply and
demand schedules. The dynamics of competition in
the market will tend to drive transactions toward this
equilibrium point. However, in the real world, mar-
kets are not ideal. They will always trade away from
equilibrium at least some of the time. We use the
following metrics to calculate the ‘performance’ of a
market by how far from ideal equilibrium it trades:
Smith’s Alpha, following Smith (1962), we measure
the equilibration (equilibrium-finding) behaviour of
markets as α, the root mean square difference be-
tween each of n transaction prices, p
i
(for i = 1 . . . n)
over some period, and the P
0
value for that period,
expressed as a percentage of the equilibrium price:
α =
100
P
0
s
1
n
n
∑
i=1
(p
i
− P
0
)
2
(1)
In essence, α captures the standard deviation of trade
prices about the theoretical equilibrium. A low value
of α is desirable, indicating trading close to P
0
.
Allocative Efficiency, for each trader, i, the maxi-
mum theoretical profit available, π
∗
i
, is the difference
between the price they are prepared to pay (their ‘limit
price’) and the theoretical market equilibrium price,
P
0
. Efficiency, E, is used to calculate the performance
of a group of n traders as the mean ratio of realised
profit, π
i
, to theoretical profit, π
∗
i
:
E =
1
n
n
∑
i=1
π
i
π
∗
i
(2)
As profit values cannot be negative (traders in these
experiments are not allowed to enter into loss-making
deals), a value of 1.0 indicates that the group has
earned the maximum theoretical profit available, π
∗
i
,
on all trades. A value below 1.0 indicates that some
opportunities have been missed. Finally, a value
above 1.0 means that additional profit has been made
by taking advantage of a trading counterparty’s will-
ingness to trade away from P
0
.
Profit Dispersion is a measure of the extent to which
the profit/utility generated by a group of traders in the
market differs from the profit that would be expected
of them if all transactions took place at the equilib-
rium price, P
0
. For a group of n traders, profit disper-
sion is calculated as the root mean square difference
between the profit achieved, π
i
, by each trader, i, and
the maximum theoretical profit available, π
∗
i
:
π
disp
=
s
1
n
n
∑
i=1
(π
i
− π
∗
i
)
2
(3)
Low values of π
disp
indicate that traders are extracting
actual profits close to those available if all trades take
place at the equilibrium price P
0
; while higher values
of π
disp
indicate that traders’ profits differ from those
expected at equilibrium. The attraction of this statistic
is that it is not masked by zero-sum effects between
buyers and sellers.
Delta Profit is used to calculate the difference in
profit maximising performance between two groups,
x and y, as a percentage difference relative to the mean
of the two groups:
∆P(x − y) =
2(π
x
− π
y
)
π
x
+ π
y
(4)
Delta profit directly measures the difference in profit
gained by two groups. In a perfect market with iden-
tically matched groups, delta profit should be zero,
since all groups should trade at P
0
.
For all the experiments described in this paper,
we use the Adaptive-Aggressive (AA) strategy for
our robot trader algorithms. AA has previously been
demonstrated to be the dominant robot algorithm in
the academic literature (De Luca and Cliff, 2011). AA
robots have short-term and longer-term learning pro-
cesses. In the short-term, robots update the aggres-
siveness of their bidding behaviour; with more ag-
gressiveness meaning an agent will sacrifice profit to
improve its chance of transacting. In the longer-term,
robots learn how to best combine their aggressiveness
with their estimation of the market equilibrium price,
calculated by observing transaction prices over a time
window, to choose which bids or asks to submit in the
market (for full details, see Vytelingum, 2006).
3 METHODOLOGY
Open Exchange (OpEx) is a real-time financial-
market simulator specifically designed to enable eco-
ICAART2013-InternationalConferenceonAgentsandArtificialIntelligence
346

Table 1: Permit-schedule timetable. Six permit types are
issued to each market participant, depending on their role.
For each role, there is one human and one robot participant.
Permit values show limit price - P
0
. Numbers in brackets
show the time-step sequence in which permits are allocated.
1 2 3 4 5 6
Buyer1 77 (1) 27 (4) 12 (7) -9 (10) -14(13) -29 (16)
Buyer2 73 (2) 35 (5) 8 (8) -5 (11) -22 (14) -25 (17)
Buyer3 69 (3) 31 (6) 16 (9) -1 (12) -18 (15) -33 (18)
Seller1 -77 (1) -27 (4) -12 (7) 9 (10) 14 (13) 29 (16)
Seller2 -73 (2) -35 (5) -8 (8) 5 (11) 22 (14) 25 (17)
Seller3 -69 (3) -31 (6) -16 (9) 1 (12) 18 (15) 33 (18)
nomic trading experiments between humans and au-
tomated trading algorithms (robots). Developed
at the University of Bristol by Marco De Luca,
OpEx is freely available for open-source download
from SourceForge.net (OpEx SourceForge, 2012),
under the terms of the Creative Commons Public Li-
cense. We used OpEx to conduct 24 experiments on
21/03/2012.
2
In each experiment, the market con-
tained six human traders (arranged as 3 buyers and
3 sellers) and six robot traders (similarly arranged as
3 buyers and 3 sellers). All human participants (24 in
total) were registered full-time students at the Univer-
sity of Bristol. Participants were paid £25 for partici-
pating in the trading experiments, plus, to incentivise
traders to make profit, the two human traders scoring
the highest profit were rewarded with an Apple iPad.
We ran four sessions, each consisting of six
rounds of experiments. For each session, a new group
of human volunteers was used. Participants were told
that their aim was to make as much profit as possible
by trading client orders that arrive over time. Partici-
pants were given a short tutorial on the system lasting
approximately 10 minutes, after which six rounds of
experiments were run, with each experiment having a
market open period of 10 minutes.
An experimental market is defined by the aggre-
gate supply and demand of participants; i.e. the sup-
ply and demand schedules. The units of supply and
demand are allocated to market participants progres-
sively during the course of an experiment. Rather than
allocate all units when the market opens, units to trade
are continuously drip-fed into the market throughout
the market open period. Table 1 shows the permit
schedule timetable that describes how units are al-
located to participants. During an experiment, each
participant receives six permit types (of 8 units each).
The value indicates the limit price of the permit; limit
2
During one run, the user interface of a human partic-
ipant crashed, causing the participant to achieve very low
profit. Hence, we use only results from the other 23 experi-
ments to perform our statistical analysis.
Table 2: Experiment schedules.
Experiment P
0
Cyclical?
1 272 Yes
2 209 No
3 291 Yes
4 241 No
5 258 Yes
6 239 No
values set the ceiling price at which a buyer can buy
and the floor price at which a seller can sell, and are
all given relative to the market equilibrium value, P
0
.
Values in parentheses indicate the time-step that the
permit is allocated to a market participant. For all ex-
periments, the inter-arrival time of permits, or time-
step, was fixed at 4 seconds. Permits are always allo-
cated in pairs symmetric about P
0
, such that the the-
oretical market equilibrium is not altered. To ensure
equality between humans and robots, each time a per-
mit is allocated to a human, an identical permit is
allocated to a robot that has the same role (Buyer1,
Buyer2, etc.); i.e., each human in the market has a
‘shadow’ robot playing exactly the same role.
For each experiment, markets are configured to be
either ‘cyclical’, or ‘random’. Table 2 summarises
the schedules used for each experiment, indicating P
0
,
and whether permits are allocated cyclically, or ran-
domly. In cyclical markets, permits are allocated in
strict sequence for the duration of an experiment, fol-
lowing the timetable of Table 1. After 18 time-steps
(72 seconds), the cycle restarts. This is repeated 8
times before the market is closed. By contrast, in ran-
dom markets, the permit sequence across the entire
run is randomised. However, permits are still allo-
cated in symmetric Buyer-Seller pairs, and each per-
mit is received by a human and robot playing the same
role. Overall, the aggregate market supply and de-
mand schedules are unaltered, only the order of allo-
cation varies. In previous continuous-market human-
robot experiments (De Luca et al., 2011; Cartlidge et
al., 2012), cyclical-replenishment was used, replicat-
ing the design used by (Cliff and Preist, 2001). By
using cyclical replenishment, therefore, it is easier to
compare new results with those from the literature.
However, cyclical replenishment is manifestly artifi-
cial: real markets are not cyclically refreshed with
new supply and demand in such a regular fashion. For
this reason, we introduce random-replenishment here
to add more realism. Further, we test both cyclical-
replenishment and random-replenishment in order to
see if any artifactual differences are introduced in the
results. This lets us infer that if a statistical difference
Evidencingthe"RobotPhaseTransition"inHuman-agentExperimentalFinancialMarkets
347
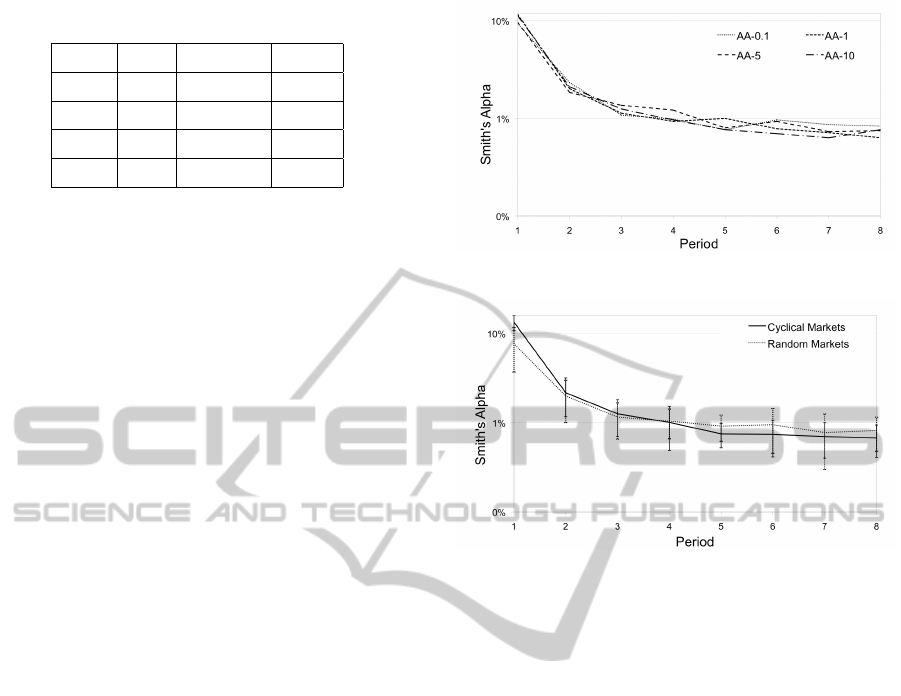
Table 3: Agent configurations used in experiments.
Name Agent Sleep-Wake Internal
AA-0.1 AA 0.1 0.05
AA-1 AA 1 0.5
AA-5 AA 5 2.5
AA-10 AA 10 2.5
is present in results from cyclical-replenishment mar-
kets that is not present in random-replenishment mar-
kets, then the difference is an artifactual consequence
of the artificial experimental constraint of cyclically
replenishing the traders’ entitlements to buy and sell
(for a lengthy discussion on the importance of incor-
porating ‘realism’ into experimental design, see De
Luca, Szostek, Cartlidge, & Cliff, 2011).
For each experiment, all robots were configured
with an identical parameter set, detailed in Table 3.
Agents were selected from one of four configurations:
AA-0.1, AA-1, AA-5, and AA-10. The numerical
suffix indicates a robot’s sleep-wake cycle time in
seconds. The greater the value, the longer the robot
‘sleeps’ between actions. By varying this sleep pa-
rameter, we are able to control the ‘speed’ at which
robots act. Johnson et al. (2012) suggest that: “in
many areas of human activity, the quickest that some-
one can notice [a] cue and physically react, is ap-
proximately 1000 milliseconds”. Thus, to test the ef-
fect of robot speed on the market, we select sleep val-
ues that comfortably range from well below human
reaction speed (0.1s) to well above human reaction
speed (10s). In this way we should be certain that our
collection of robot configurations ‘cross the bound-
ary’ of human reaction time, enabling us to com-
pare the dynamics of markets containing robots that
act at super-humanly fast speeds, with markets con-
taining robots that act on human time-scales. To en-
sure that robots are able to act sensibly upon waking
from sleep, robots are enabled to observe the market
and perform internal calculations during their ‘sleep’
phase. To achieve this, a second ‘internal’ timer is
used to control when a robot will observe and cal-
culate. Table 3 shows the internal timers used for
each robot configuration; in each case, the internal
timer has a shorter period than the sleep-wake cycle.
Robots are also configured to wake from sleep upon
a new order stimulus and new trade stimulus. Finally,
all robots have a ‘maximum spread’ parameter set to
0.01, meaning that if the spread between the best ask
price and best bid price is less than 1%, the agent will
automatically cross with the best bid/ask on the other
side (for further details, see Cartlidge & Cliff, 2012).
For evaluating statistical significance we use the
nonparametric Robust Rank Order (RRO) test re-
Figure 1: Smith’s α for each robot type.
Figure 2: Smith’s α for each market type (±95% C.I.).
ported by Feltovich (2003).
4 RESULTS
4.1 Smith’s α
In Fig. 1 we can observe the equilibration behaviour
of the markets by plotting Smith’s α for each cycle
period (on a log-scale). We see that there is no differ-
ence between robots. Under all conditions, α rapidly
falls from a value close to 10% in the initial period, to
α ≈ 2% in period two; α then continuous to fall more
gradually over the course of an experiment, tending to
α ≈ 1% by market close.
In Fig. 2 we see mean α (±95% confidence inter-
val) plotted for cyclical and random markets. Under
both conditions, α follows a similar pattern, tending
to α ≈ 1% by market close. However, in the first pe-
riod, cyclical markets produce significantly greater α
than random markets (RRO, p < 0.0005). This is due
to the sequential order allocation of permits in cycli-
cal markets, where limit prices furthest from equilib-
rium are allocated first. This encourages ‘exploratory’
quotes and trades to occur far from equilibrium. In
comparison, in random markets, permits are not or-
dered by limit price, thus making it likely that limit
ICAART2013-InternationalConferenceonAgentsandArtificialIntelligence
348
prices of early orders are closer to equilibrium than
they are in cyclical markets.
4.2 Efficiency
Mean efficiency results for each robot type averaged
across all experiments are summarised in Table 4. We
see that the efficiency of robots is greater than the ef-
ficiency of humans under every condition, with robots
securing a delta profit gain of 0.4% – 1.8%. Across all
experiments, robots achieve a significantly greater ef-
ficiency (RRO, p < 0.025). Grouping by market type,
robots achieve significantly greater efficiency in ran-
dom markets (RRO, p < 0.1) and robots achieve sig-
nificantly greater efficiency in cyclical markets (RRO,
p < 0.1). When comparing the efficiencies of robots
with the efficiencies of humans across all markets
grouped by robot type, robots are still shown to be
more efficient but the difference is only significant
for robots AA-0.1 and AA-5 (RRO, p < 0.104). The
difference between robots AA-10 and humans is not
significant at the p = 0.104 level and the difference
between robots AA-1 and humans is not significant at
the p = 0.104 level.
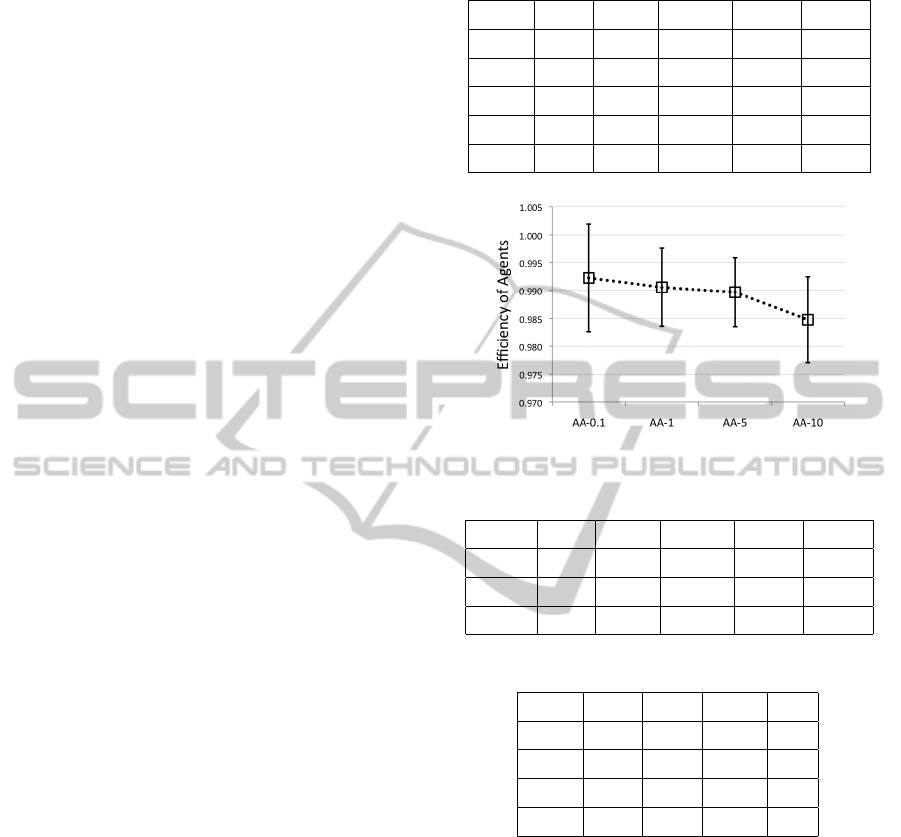
Fig. 3 plots mean efficiency (±95% confidence
interval) of robots grouped by type. As robot sleep
time decreases, the efficiency of robots appears to in-
crease, however, across all markets this difference is
not significant. However, when comparing data from
only cyclical markets, AA-0.1 robots attain a mean
efficiency score significantly higher than AA-1 (RRO,
p = 0.05), AA-5 (RRO, p = 0.05), and AA-10 (RRO
p = 0.1).
4.3 Profit Dispersion
Table 5 summarises profit dispersion by market type.
We see that random markets have significantly lower
profit dispersion (RRO, 0.005 < p < 0.01), signif-
icantly lower profit dispersion of humans (RRO,
0.025 < p < 0.05), and significantly lower profit dis-
persion of agents (RRO, 0.001 < p < 0.005). How-
ever, when comparing profit dispersion by robot types
(data not presented), we find no significant difference
in profit dispersion of markets, robots, or humans.
4.4 Execution Counterparties
Table 6 shows the mean proportion of counterparty
executions grouped by robot type. In a fully mixed
market, we expect roughly half of all trades to have
homogeneous counterparties (humans trading with
humans and robots trading with robots) and the other
half to have heterogeneous counterparties (humans
Table 4: Mean efficiency and ∆Profit(Robot - Human).
Agent Trials Agents Humans Market ∆ Profit
AA-0.1 6 0.992 0.975 0.984 1.8%
AA-1 5 0.991 0.977 0.984 1.4%
AA-5 6 0.990 0.972 0.981 1.8%
AA-10 6 0.985 0.981 0.983 0.4%
All 23 0.990 0.976 0.983 1.34%
Figure 3: Mean efficiency of robots (±95% C.I.).
Table 5: Summary of profit dispersion by market type.
Market Trials Agents Humans Market ∆ Profit
Cyclical 12 89.6 85.4 88.6 1.32%
Random 11 50.2 57.2 55.6 1.36%
All 23 70.0 71.9 72.8 1.34%
Table 6: Mean proportion of counter-party executions.
Agent Trials Homo Hetero Sum
AA-0.1 6 0.585 0.415 1.0
AA-1 5 0.542 0.458 1.0
AA-5 6 0.535 0.465 1.0
AA-10 6 0.475 0.525 1.0
trading with agents, or vice versa). Fig. 4 plots the
median number of homogeneous counterparties in
markets containing each of the four robot types, with
error bars showing the range of values. There appears
to be an inverse relationship between robot sleep time
and proportion of homogeneous counterparties. RRO
tests show that the proportion of homogeneous in-
teractions in AA-0.1 markets is significantly higher
than AA-1 and AA-5 markets (p < 0.051), and AA-10
markets (p = 0.0011); and for AA-1 and AA-5 mar-
kets the proportion is significantly higher than AA-
10 (p < 0.104). For AA-10 robots, the proportion of
homogeneous counterparties is significantly lower in
random markets than cyclical markets (p < 0.05). For
all other robot types, there is no significant difference
in the proportion of homogeneous counterparties be-
Evidencingthe"RobotPhaseTransition"inHuman-agentExperimentalFinancialMarkets
349
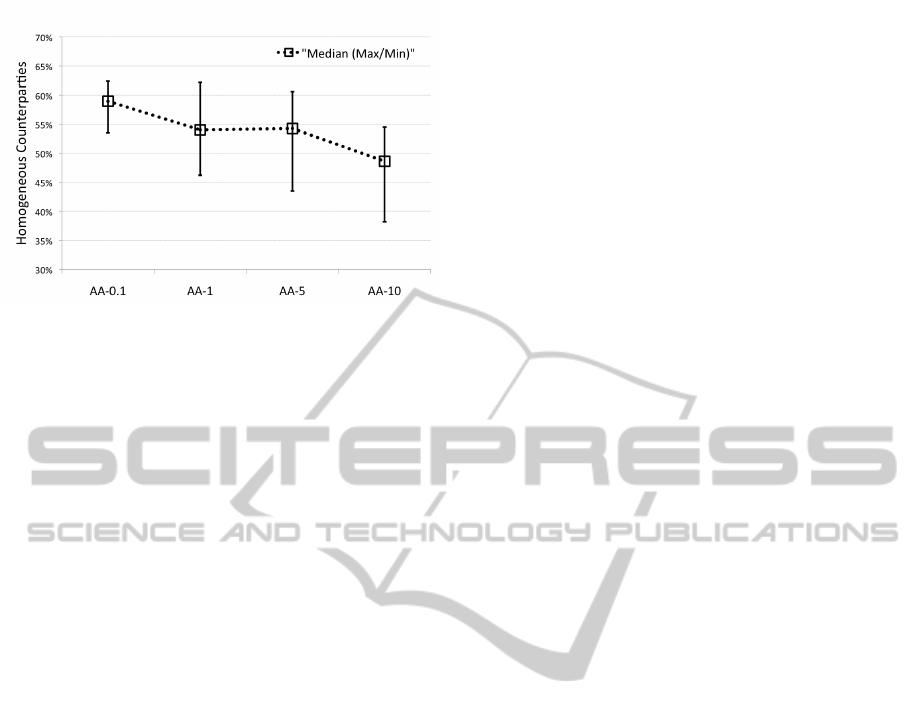
Figure 4: Proportion of homogeneous executions.
tween markets.
If we assume a normal distribution for the counter-
party distributions, then calculating confidence inter-
vals shows that in all (six) markets containing AA-0.1
robots, the proportion of homogeneous counterparties
is significantly greater than 50% (p < 0.0001). In
contrast, for markets containing AA-1 robots (five),
AA-5 robots (six), and AA-10 robots (six), the null
hypothesis that the proportion of homogeneous coun-
terparties is 50% is not rejected at the 10% level of
significance. This suggests that for the fastest robots
(AA-0.1) there is a trend to market fragmentation,
with humans trading with humans and robots trading
with robots more than would be expected by chance.
5 DISCUSSION
5.1 Evidence for the Phase Transition
Here, we summarize the main results that hold across
all our market experiments. In Section 5.2 we dis-
cuss results that demonstrate significant differences
between cyclical and random markets.
Across all markets, and for all robot types, robots
are shown to outperform humans, securing greater al-
locative efficiency scores under every condition and
gaining a delta profit increase of between 0.4%-1.8%.
These results are significant across all markets and
robot types, except AA-10, the slowest of the robots.
For readers familiar with previous papers (such as De
Luca et al., 2011; Cartlidge, De Luca, Szostek, &
Cliff, 2012), this result may come as something of a
surprise: prima facie, this is the first time that robots
have been shown to be more efficient than humans
in a continuous replenishment, real-time experimen-
tal market with liquidity drip-fed into the market over
time. There is weak evidence (not statistically sig-
nificant) of a trend for the efficiency of agents to de-
crease as sleep time of agents increases, suggesting
that speed is beneficial to agents. This is an intu-
itively appealing interpretation, but is not confirmed
with a reasonable level of statistical significance by
our results. Furthermore, the prima facie novelty of
this result is primarily due to problems with the earlier
results (published in De Luca et al., 2011; Cartlidge
et al., 2012). Those earlier results, we learned in the
course of analysing the results of the experiments re-
ported here, were affected by a bug in the OpEx im-
plementation of the AA robot-trader algorithm, and
fixing that bug was the main cause of the increase in
efficiency with respect to those earlier results (for fur-
ther details, see Cartlidge & Cliff, 2012).
Across all markets, α values start high (α ≈ 10%)
as traders ‘explore’ the space of prices, and then
quickly reduce, with markets tending to an equili-
bration level of α ≈ 1%. This demonstrates mar-
kets trading at a level much closer to equilibrium
than previously observed in De Luca et al. (2011) and
Cartlidge et al. (2012); and suggests that the mar-
ket’s price-discovery is readily finding values close
to P
0
. These results demonstrate a well-functioning
robot-human market trading near equilibrium, with
robots out-competing humans on profit. This is an
interesting result, but for our purpose of exploring
the robot phase transition described by Johnson et al.
(2012) it only serves as demonstrative proof that our
experimental markets are performing as we would ex-
pect. The real interest lies in whether we can ob-
serve a phase transition between two regimes: one
dominated by robot-robot interactions, and one domi-
nated by human-robot interactions. We seek evidence
of this by observing the proportion of homogeneous
counterparties within a market; that is, the number
of trade executions that occur between a pair of hu-
mans or a pair of robots, as a proportion of all market
trades. Theory suggests that in a fully mixed mar-
ket with no asymmetry in the behaviour of partic-
ipants, we should expect 50% of trade counterpar-
ties to be homogeneous, and 50% to be heteroge-
neous, as traders execute with counterparties at ran-
dom. From Section 4.4, our results demonstrate that
for markets containing AA-0.1 robots, the proportion
of homogeneous counterparties is significantly higher
than we would expect in a mixed market, whereas
with slower-acting robots, the proportion of homo-
geneous counterparties cannot be significantly differ-
entiated from 50%. We present this as tentative first
evidence for a robot-phase transition in experimental
markets with a boundary between 100 milliseconds
and 1 second, although in our experiments the effects
of increasing robot speed seem to give a progressive
response rather than a step-change. However, we feel
ICAART2013-InternationalConferenceonAgentsandArtificialIntelligence
350

obliged to caveat this result as non-conclusive proof
until further experiments have been run, and until our
results have been independently replicated.
The careful reader may have noticed that the
results presented have not demonstrated ‘fractures’
– ultra-fast series of multiple sequential up-tick or
down-tick trades that cause market price to deviate
rapidly from equilibrium and then just as quickly re-
turn – phenomena that Johnson et al. (2012) revealed
in real market data. Since we are constraining mar-
ket participants to one role (as buyer, or seller) and
strictly controlling the flow of orders into the market
and limit prices of trades, the simple markets we have
constructed do not have the capacity to demonstrate
such fractures. For this reason, we use the proportion
of homogeneous counterparties as proxy evidence for
the robot phase transition.
5.2 Artefacts or Evidence?
As we argued in Section 3, the cyclical-replenishment
experimental markets used by De Luca et al. (2011)
and Cartlidge et al. (2012) are a poorer approxi-
mation to real-world markets than are the random-
replenishment markets. For that reason, where re-
sults from cyclical markets show a significant effect
of agent-speed, that is not also present in our random
markets, we interpret as another indication that in-
troducing artificial constraints into experimental mar-
kets for ease of analysis runs the risk of also intro-
ducing artefacts that, because they are statistically
significant, can be misleading. The following rela-
tionships were all observed to be statistically signifi-
cant in cyclical-replenishment markets and not statis-
tically significant in random-replenishment markets;
providing further support for the argument for real-
ism in artificial-market experiment design, previously
advanced at length by De Luca et al. (2011):
1. Cyclical-replenishment markets produced signif-
icantly greater α values in the first period of
trade. This is a direct consequence of cyclical-
replenishment allocating orders in a monotoni-
cally decreasing sequence from most profitable
to least profitable. As such, the first orders allo-
cated into the market have limit prices far from
equilibrium. Since the market is empty, there
is no mechanism for price discovery other than
trial-and-error exploration; leading to large α. In
random-replenishment markets, the initial orders
entering the market are drawn at random from the
demand and supply schedules. This leads to lower
bounds on limit prices and hence lower α. Subse-
quently, price discovery is led by the order book,
resulting in lower α over time.
2. In cyclical-replenishment markets, the efficiency
of AA-0.1 robots is significantly higher than the
efficiency of the other robot types. While there is
some evidence of an inverse relationship between
robot sleep time and robot efficiency across all
markets, we infer that this difference is an artefact
of cyclical replenishment until further experimen-
tal trials can confirm otherwise.
3. When comparing random and cyclical markets,
profit dispersion in cyclical-replenishment mar-
kets is significantly higher for agents, humans,
and the market as a whole. Since lower profit dis-
persion is a desirable property of a market, this
suggests that the relatively high profit dispersion
observed in previous cyclical-replenishment ex-
periments (De Luca et al., 2011; Cartlidge et al.,
2012) is an artefact of the experimental design.
5.3 Future Work
We have gathered tentative evidence to support the ex-
istence of the robot phase transition. The next step is
to see if we can observe market dynamics analogous
to the market ‘fractures’ reported by Johnson et al.
(2012). To achieve this, it may be necessary to in-
troduce role diversity (e.g. enabling participants to
buy and sell and hence act as ‘market makers’). If
we are able to achieve this goal, we will then have a
controlled method for exploring the relationship be-
tween localised ultra-fast mini-crashes and longer-
term global instabilities (flash-crashes) observed in
real-world markets. Any progress in this area could
have significant positive impact on our understanding
of the global financial markets and offer potential new
regulatory mechanisms to avoid the occurrence of fu-
ture flash-crash events.
Other questions that have arisen from this research
and require further exploration, include:
• What happens if we vary the rate of order replen-
ishment inter-arrival times? When orders start to
arrive faster than humans can react, do we see a
robot phase transition here?
• What happens if we vary the proportion of robots
in the market? Are market dynamics significantly
different when the market is dominated by robots?
How does this affect the robot phase transition?
• What happens if robots do not wake up on new
trade stimuli? Does this make a fairer proxy of
agent ‘speed’? How does this change affect the
robot phase transition?
While these questions are interesting, progress will
necessarily be slow. Unlike many facets of computer
science, where variations on a question theme can be
Evidencingthe"RobotPhaseTransition"inHuman-agentExperimentalFinancialMarkets
351

easily tweaked by altering the values of some parame-
ters and then pressing ‘run’, experimental economics
offers the pragmatic challenge of soliciting and incen-
tivizing human participants, arranging a venue, en-
suring participants arrive, and finally, ensuring that
the system is ‘correctly’ configured and functioning
error-free during the ‘one-shot performance’ of each
experiment. For many empirical computer scientists
working on artificial intelligence and autonomous
software agents, this is an alien landscape.
6 CONCLUSIONS
We have presented results from a series of human-vs.-
robot experimental financial markets to test the hy-
pothesis that when robot trader agents in OpEx are
able to act/react on a timescale quicker than the hu-
man traders are, we will see a transition from a mixed
market (where humans and robots are equally likely
to interact with one another) to a more fragmented
market where robots are more likely to trade with
robots, and humans with humans, similar to the robot
phase transition that Johnson et al. (2012) argue for
the existence of in real financial markets. Our primary
conclusion is that our results are supportive of John-
son et al.’s (2012) hypothesis concerning the existence
of the robot phase transition, although in our experi-
ments the effects of increasing robot speed seem to
give a progressive response rather than a step-change.
This result could have potentially profound conse-
quences. By evidencing the robot phase transition un-
der controlled laboratory conditions, we have opened
a new pathway for studying this recently observed
phenomenon. Hopefully, future work will replicate
sub-second ‘fractures’ and subsequent global insta-
bilities (‘crashes’). We will then be in a position to
dynamically observe the relationship between these
intriguing phenomena, enabling us to design monitor-
ing tools and/or introduce safety mechanisms, in or-
der to avoid, or contain, future ‘flash crash’ events in
the global financial markets.
We also explored the effects of increasing the ‘re-
alism’ of the structure of the experiments conducted
on OpEx. In doing this, we discovered that some
statistically significant effects observed in artificial,
constrained experimental set-ups, disappear when the
experiments are more realistic and less constrained.
This leads us to our second conclusion: that in exper-
iments such as those reported here, the more realistic
the set-up of the experiment, the more the results can
be trusted.
ACKNOWLEDGEMENTS
We are extremely grateful to all the participants of our
experiments. Thanks also to Angela Cheng, who pro-
vided administrative support during the experiments
and Neil Johnson for comments on an early version
of the paper. Primary financial support for Dave
Cliff’s research comes from EPSRC grant number
EP/F001096/1; John Cartlidge is supported by EP-
SRC grant number EP/H042644/1. Financial assis-
tance in the funding of the prizes came from Syritta
Algorithmics Ltd and Electric Lamb Ltd.
REFERENCES
Cartlidge, J., & Cliff, D. (2012). Exploring the “robot phase
transition” in experimental human-algorithmic mar-
kets. Foresight, The Future of Computer Trading
in Financial Markets, Driver Review DR25, Crown
Copyright. Available [online] bitly.com/SvqohP.
Cartlidge, J., De Luca, M., Szostek, C., & Cliff, D. (2012).
Too fast too furious: faster financial-market trading
agents can give less efficient markets. In Filipe, J., &
Fred, A. (Eds.), 4th Int. Conf. Agents & Art. Intell.,
Vol. 2 (ICAART-2012), pp. 126–135. SciTePress.
Cliff, D., & Preist, C. (2001). Days without end: On
the stability of experimental single-period continu-
ous double auction markets. Tech. rep. HPL-2001-
325, Hewlett-Packard Labs.
De Luca, M., & Cliff, D. (2011). Human-agent auction in-
teractions: Adaptive-aggressive agents dominate. In
Walsh, T. (Ed.), 22nd Int. Joint Conf. Artificial Intel-
ligence (IJCAI-11), pp. 178–185. AAAI Press.
De Luca, M., Szostek, C., Cartlidge, J., & Cliff, D. (2011).
Studies of interactions between human traders and
algorithmic trading systems. Foresight, The Future
of Computer Trading in Financial Markets, Driver
Review DR13, Crown Copyright. Available [online]
http://bit.ly/RoifIu.
Feltovich, N. (2003). Nonparametric tests of differences
in medians: Comparison of the wilcoxon-mann-
whitney and robust rank-order tests. Experimental
Economics, 6, 273–297.
Johnson, N., Zhao, G., Hunsader, E., Meng, J., Ravindar,
A., Carran, S., & Tivnan, B. (2012). Financial black
swans driven by ultrafast machine ecology. Working
paper published on arXiv repository. Available [on-
line] http://arxiv.org/pdf/1202.1448v1.pdf.
OpEx, SourceForge (2012). Author: Marco De Luca.
https://sourceforge.net/projects/open-exchange/.
Smith, V. (1962). An experimental study of comparative
market behavior. J. Political Economy, 70, 111–137.
Vytelingum, P. (2006). The Structure and Behaviour of the
Continuous Double Auction. Ph.D. thesis, Sch. Elec-
tron. & Comput. Sci., Univ. Southampton, UK.
ICAART2013-InternationalConferenceonAgentsandArtificialIntelligence
352
