
Automatic Burst Detection based on Line Length in the Premature
EEG
Ninah Koolen
1,2
, Katrien Jansen
3
, Jan Vervisch
3
, Vladimir Matic
1,2
, Maarten De Vos
1,2,4
,
Gunnar Naulaers
5
and Sabine Van Huffel
1,2
1
Department of Electrical Engineering (ESAT), division SCD, Katholieke Universiteit Leuven, Leuven, Belgium
2
iMinds-KU Leuven Future Health Department, Leuven, Belgium
3
Department of Pediatrics, University Hospital Gasthuisberg, Leuven, Belgium
4
Department of Psychology, University of Oldenburg, Oldenburg, Germany
5
Neonatal Intensive Care Unit, University Hospital Gasthuisberg, Leuven, Belgium
Keywords: Brain Monitoring, Premature EEG, Automatic Detection, Burst, Interburst Interval, Neonatal Intensive Care
Unit.
Abstract: To extract useful information from preterm electroencephalogram (EEG) for diagnosis and long-term
prognosis, automated processing of EEG is a crucial step to reduce the workload of neurologists. Important
information is contained in the bursts, the interburst-intervals (IBIs) and the evolution of their duration over
time. Therefore, an algorithm to automatically detect bursts and IBIs would be of significant value in the
Neonatal Intensive Care Unit (NICU). The developed algorithm is based on calculation of the line length to
segment EEG into bursts and IBIs. Validating burst detection of this algorithm with expert labelling and
existing methods shows the robustness of this algorithm for the patients under test. Moreover, automation is
within our grasp as calculated features mimic values obtained by scoring of experts. The outline for
successful computer-aided detection of bursting processes is shown, thereby paving the way for
improvement of the overall assessment in the NICU.
1 INTRODUCTION
Premature infants are at high risk for neurological
disorders. Electroencephalography (EEG) indicates
both the nature and the location of the pathogenesis.
It would be very helpful, in addition to the visual
inspection of time-consuming EEG by
neonatologists, to develop an automatic algorithm
that quantifies the brain activities and its evolution.
Despite the fact that EEG is already widely used
for registration of brain processes for epilepsy
patients, (semi-)automated monitoring of
quantitative EEG variables and its validated use is
almost nonexistent. Moreover, there is a high need
for automatic analysis of the neonatal EEG to
significantly reduce the workload of clinicians in the
NICU. In this paper, an algorithm is developed for
premature infants. For these patients it is very
important to monitor EEG within the first six hours
after birth to make an accurate prognosis on survival
quality and neurological outcome.
This diagnosis is based on the ‘hidden’ information
in the so-called background EEG activity. Critical
factors for prognosis are amplitude and the degree of
(dis-)continuities of the background EEG (Vanhatalo
and Kaila, 2006).
Furthermore, specifically abnormal patterns can
be observed. Discontinuous EEG pattern, or the so-
called trace discontinue, consists of bursts with high
frequencies and high amplitude, interrupted by
periods of low brain activity with low-voltage EEG,
named the interburst intervals (IBIs). It is believed
that long low-voltage periods give rise to an
increased risk of brain dysfunctions (Le Bihannic et
al., 2011). Nevertheless, good neurological outcome
can be expected if low-voltage activity recovers into
increasing activity between bursts and evolve to a
normal pattern within 12 hours after birth. However,
there is no golden standard for the description of
bursts in the literature, so validation of the detection
algorithm is subjective. In this way, validation
should be performed by more than one clinician and
105
Koolen N., Jansen K., Vervisch J., Matic V., De Vos M., Naulaers G. and Van Huffel S..
Automatic Burst Detection based on Line Length in the Premature EEG.
DOI: 10.5220/0004186401050111
In Proceedings of the International Conference on Bio-inspired Systems and Signal Processing (BIOSIGNALS-2013), pages 105-111
ISBN: 978-989-8565-36-5
Copyright
c
2013 SCITEPRESS (Science and Technology Publications, Lda.)
the experience of experts should be combined.
Earlier, automatic detection of bursts was often
only based on a threshold on the amplitude of the
EEG channels, but this has some drawbacks. High
frequency artefacts which are not filtered out can be
seen as bursts, whereas medication and filter settings
can also influence the amplitude of the EEG. Recent
studies include besides amplitude content also
frequency content of bursts and IBIs, e.g. they make
use of a non-linear energy operator (Särkelä et al.,
2002); (Palmu et al., 2010) or threshold detection on
the envelope of the EEG channels (Jennekens et al.,
2011).
The goal of this study was to implement a
reliable detection algorithm with the focus on the
advantage of combining amplitude and frequency
content. Therefore, line length is introduced for this
application, because it is very accurate in detecting
the onset of high activity in the EEG (Esteller et al.,
2001). Moreover, the developed method allows
defining an adaptive and patient specific threshold.
This avoids the limitations of changing amplitudes’
level, e.g. when medication is administrated.
Furthermore, no training set is needed. Such an
algorithm in the NICU would allow a more objective
analysis. Future research will also investigate the
influence of additional artefact removal as proposed
in (De Vos et al., 2011) on the accuracy of burst and
IBI detection. The computer-aided analysis of the
EEG enables to reduce the cost for the time-
consuming long-term analysis, and thereby reduces
the risk of brain damage of preterm infants.
2 DATA ACQUISITION
The EEG was measured with OSG equipment at 9
electrode locations (Fp1, Fp2, T3, T4, C3, C4, Cz,
O1, O2) and sampling frequency of 250 Hz. The
polysomnographic dataset included long-term video-
EEG recordings of 5 preterm infants with a
postmenstrual age of 24-32 weeks. Two patients had
measurements at 3 different moments in time to see
an evolution in the brain development. These
moments are as soon as possible after birth, at day
14 and at the day when the patient could leave the
hospital. The protocol was approved by the ethics
committee of the University Hospitals of Leuven,
Belgium. First, a pre-processing step is performed; a
50 and 100 Notch filter and a 1-20 Hz band pass
filter are applied. After this step, twenty minutes of
each EEG were chosen for further analysis and
scored (burst/IBI) by two experienced clinicians.
3 METHODOLOGY
3.1 Detection based on Line Length
Fractal dimension (FD) is a promising method for
transient detection, requiring no prior knowledge of
the characteristics of the transient (Accardo et al.,
1996). As the dimension of a line is 1 and for a plane
2, the FD in EEG will always be between 1 and 2.
The more the line fluctuates, the more the plane is
‘covered’, so the more the FD increases. The line
length is a simplified version of the FD. Line length
is more successful than FD for burst detection. It is
also reported (Esteller et al., 2001) for the detection
of seizures in the EEG. The line length is the
running sum of the absolute differences between all
consecutive samples within a predefined window.
An efficient burst detection algorithm is derived
from this feature. The algorithm consists of the
following steps:
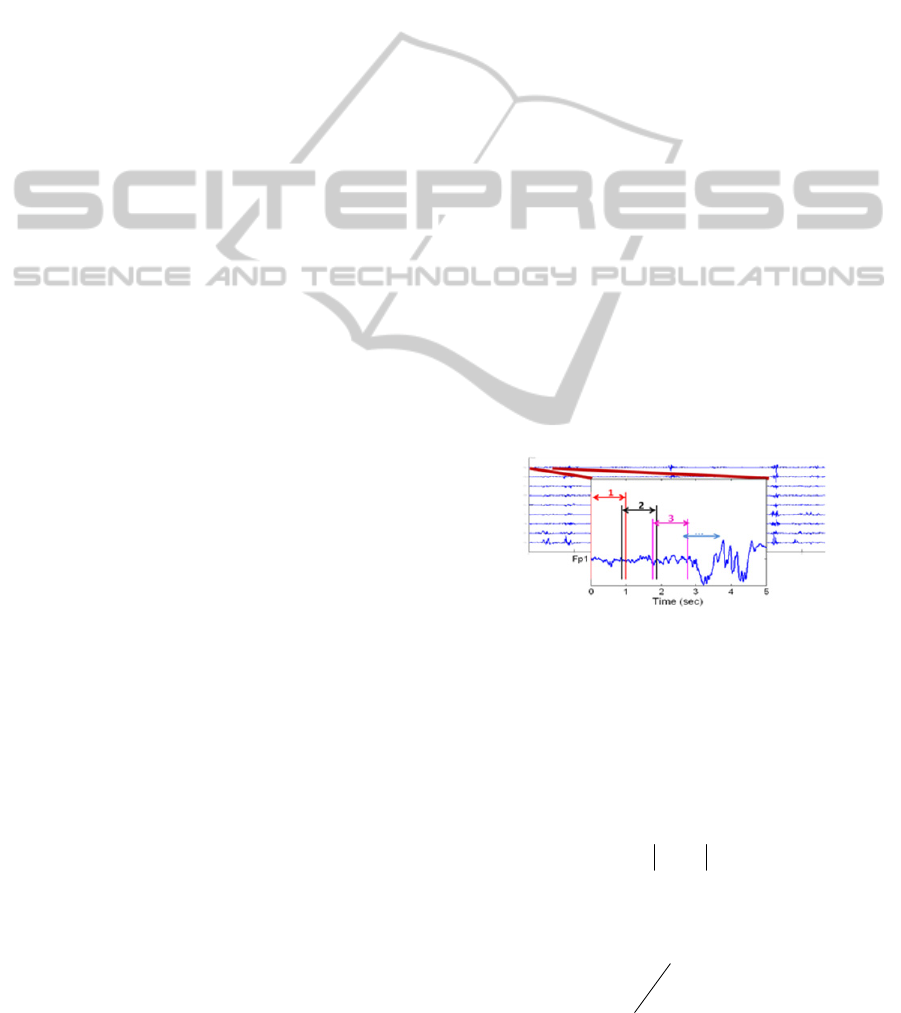
1. Segmentation of each EEG channel in
consecutive segments of 1 second, with an
overlap of 0.12 second (Figure 1) (Accardo et al.,
1996). To have reliable detection of transient
events like bursts, short duration segments are
necessary. Line length will grow as the data
sequence magnitude or signal variance increases.
Hence, it can be seen as an amplitude and
frequency demodulator (Esteller et al., 2001).
Figure 1: Partition of the EEG signals in overlapping
consecutive segments of 1 second. The overlap is 0.12
second.
2. For each segment i of each channel n, the total
length is calculated as in formula 1. L(i)
represents the line length value for each segment
i, calculated as the sum of the distances between
successive data samples x
j
within this segment.
250-1
j+1 j
j=1
L(i)= x -x
(1)
After that, these line lengths are normalized by the
total sum of the line lengths of that EEG channel n
(Accardo et al., 1996):
n
i
L(i)
L(i)=
L(i)
(2)
BIOSIGNALS2013-InternationalConferenceonBio-inspiredSystemsandSignalProcessing
106
Finally, the median value over all channels is
taken for each segment (median L
n
(i)), which is
the (blue) curve in Figure 2 part c. Median value
is more robust than the mean value because high
amplitude or frequency content in only one
channel would influence the mean value too
much. Thereby, experts define bursts as high
activity on more than one channel (or more than
half of the EEG channels).
3. Bursts are detected when the amplitude of this
curve (median L
n
(i)) is above Thr_Det. This
patient dependent threshold is calculated as
0.85*mean of this curve. An additional condition
for detection is that the difference in amplitude
between a successive non-detected and detected
point (and vice versa) should be large enough
(>0.4*std(median L
n
(i)), so only pronounced
peaks are detected. Additionally, all IBIs shorter
than 2 seconds are removed as they are also not
considered by clinical experts. For an example of
65 seconds EEG, this leads to detection of the
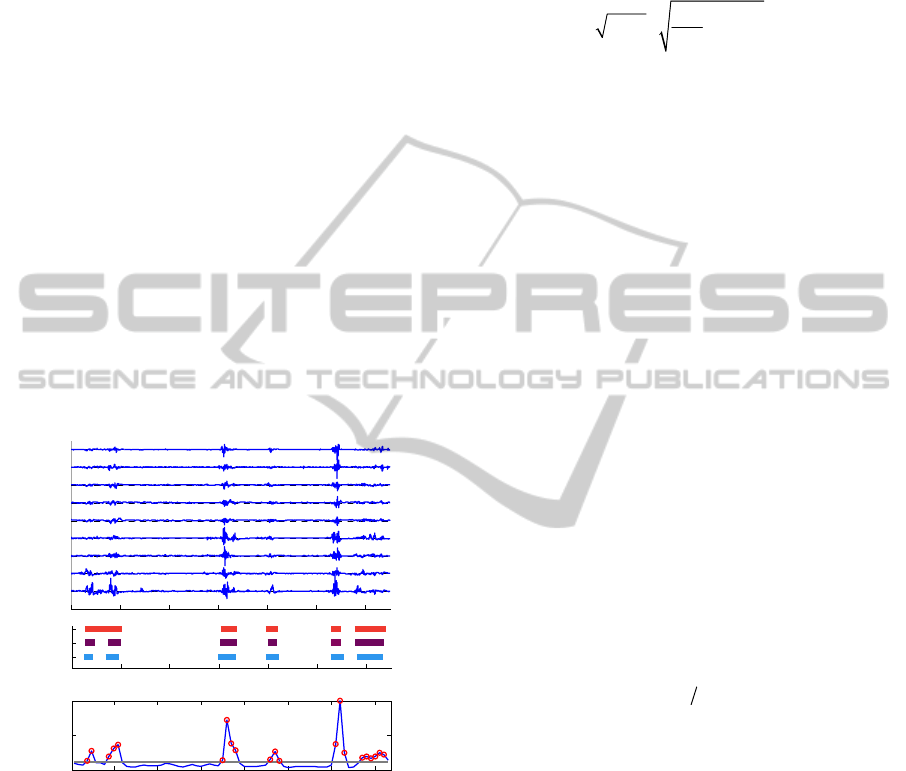
segments indicated by red circles in Figure 2 c.
In part b of Figure 2, the detected bursts are
compared with clinical labelling of high activity.
Figure 2: a) Example of 65 seconds 9-channel EEG
recording, b) Burst detection: by 2 clinicians and by
algorithm, c) Blue curve: median L
n
(i) as calculated in step
2, grey line: threshold for detection of bursts (Thr_Det),
red circles: detected bursts after step 3.
3.2 Comparison of Detection Methods
Jennekens et al.(2011) first calculate the envelope
values EV(i), which are derived from the average
signal power P(i) as in formula 3. x(i) is the
amplitude of the signal and Nw a window length
equal to the number of sample points in 1 second of
data. When these envelope values are obtained for
every EEG channel, an amplitude-threshold is
applied. If point Ev(i) has a value higher than this
threshold on two or more channels, this sample x(i)
is detected as a burst sample. IBIs shorter than two
seconds are removed.
Nw
2
i=1
2
EV(i)= 2P(i) = x(i)
Nw
(3)
Another non-linear method is explored. It makes use
of the non-linear energy operator (formula 4)
(Palmu, 2010), where i is the current sample and x(i)
the value at that sample.
N
LEO(x(i))=|x(i)x(i-3)-x(i-1)x(i-2)|
(4)
Thereafter, the processed signal is smoothed by the
average value of a sliding window of 1.5 second
centred at the time sample NLEO(x(i)). To remove
continuous artefacts, a baseline correction is done by
subtracting the minimum value of the smoothed
signal from 1 minute epoch before the current
sample. As in the previous method, marking as a
burst is performed when the sample has a value
higher than a predefined amplitude on two or more
channels.
We compared those two methods with the
developed burst detection algorithm, by comparing
the accuracy of detection (to clinical labelling) and
different features describing these epochs. The
accuracy is calculated sample by sample, where a
true positive (TP) is found as a sample x(i) which is
both by the algorithm and by the clinician detected
as a burst. A true negative stands for a sample x(i)
which is marked as an interburst interval by the
expert and by the algorithm. Then, the accuracy is
calculated as in formula 5.
accurac
y
=
(
TP+TN
)
#sam
p
les
(5)
3.3 Features Describing Epochs
To see an evolution of the EEG pattern of the
premature brain, we will look at parameters which
describe bursts and IBIs. Namely, more bursts
indicate more activity and more connectivity
between neurons in the premature brain.
In this paper, several parameters were used to
compare epochs detected by different algorithms
with clinical detected epochs (Palmu et al., 2010):
- Number of Bursts / IBIs: number of these
specific epochs. It cannot be confused with the
number of points in the EEG time series
classified as bursts.
- Mean Burst / IBI Duration: average length of
the burst or interburst interval.
0 10 20 30 40 50 60
O2
O1
T4
T3
Cz
C4
C3
Fp2
Fp1
Time (s ec)
0 10 20 30 40 50 60
algorithm
clinician2
clinician1
time (s)
10 20 30 40 50 60 70
0
0.05
L median
segment i
b
a
c
AutomaticBurstDetectionbasedonLineLengthinthePrematureEEG
107

60
80
Acc(%)
p
t1
60
80
Acc(%)
pt1
2
60
80
Acc(%)
pt1
3
60
80
Acc(%)
pt2
60
80
Acc(%)
pt3
60
80
Acc(%)
pt4
60
80
Acc(%)
pt4
2
clinician 1 clinician 2 Inter-rater
60
80
Acc(%)
pt5
meth1 meth2 meth3 inter-rater
- Median Burst / IBI Duration: middle value
of a finite ordered list of these bursts or IBIs.
- Burst%: proportion of time covered by bursts.
Although these parameters are clinically relevant,
they do not fully summarize the patient’s state.
Therefore, some additional parameters are explored
(Särkelä et al., 2002) related to the energy within the
burst / IBI:
- Average Bursts / IBIs Amplitude: average
absolute amplitude values of the original EEG
samples which are detected as a burst or an IBI.
It is calculated for the bursts as in formula 6:
burst length
#bursts
i=1
#channels
j=1
n=1
|x(i)|
b
urst length
#bursts
#channels
(6)
- Average Energy Operator Bursts / IBIs:
averaged NLEO values characterize the burst
suppression pattern. Formula 7 presents how to
calculate this value for burst epochs.
burst length
#bursts
i=4
#channels
j=1
n=1
|x(i)x(i-3)-x(i-1)x(i-2)|
burst length
#bursts
#channels
(7)
4 RESULTS AND DISCUSSION
4.1 Accuracy of Detection Methods
Validation of the different algorithms is performed
by comparison of automatic versus manually
indicated bursts. In Figure 3, we present accuracy
for the three algorithms: 1. based on line length, 2.
based on envelope calculation and 3. based on
NLEO.
It can be seen that the developed algorithm
(meth1) performs similarly to the inter-rater
agreement in almost all patients. The mean accuracy
is respectively 83.8% for validation of meth1 and
86.5% for inter-rater agreement. For patient 3 the
inter-rater agreement is very high (90.6%) and
differs 5% from the automatic detection. In many
cases, NLEO-based algorithm (80.9% mean
accuracy) performs similarly to the method based on
line length calculation, but with the difference that
the first method has a computation speed of 4-5
times faster. This is because in the latter one, there is
a smoothing step. For one case, the NLEO method
has clearly a lower accuracy (68.6%). The EEG of
this patient has higher activity periods which are not
seen by clinicians as bursts. Because of a smoothing
step, this higher activity is smoothed out.
Afterwards, detection is performed with fixed
amplitude in contrast to the proposed patient
dependent amplitude (meth1).
The mean accuracy for meth2 (based on
envelope detection) is 78.8%. False positives are
introduced by movement artefacts as there is only an
amplitude threshold on the envelope values (around
30 µV). These are bursts detected by the algorithm,
but not by the expert. Besides that, a training phase
is needed for this algorithm to tune the different
parameter values for the algorithm settings, which is
not optimal here because the dataset is limited. This
method has around the same computation time as the
one based on NLEO. Hence, it can be concluded that
the developed algorithm is accurate, robust and fast.
Figure 3: Accuracy obtained by comparing sample by
sample clinical labelling with automatic detections of
bursts. In the first column labelling of clinical expert 1 are
compared with the labelling of the three methods, whereas
in the second column this is done for clinical expert 2. In
the third column labelling of both clinicians are compared.
This analysis is done for 5 patients, where pt1
2
stands for
the second measurement of patient 1 at day 14 and pt1
3
for
the measurement when the patient could leave the
hospital.
4.2 Comparison of Features
Figure 4 summarizes the calculated features for the
detection of bursts and IBIs by three previously
BIOSIGNALS2013-InternationalConferenceonBio-inspiredSystemsandSignalProcessing
108
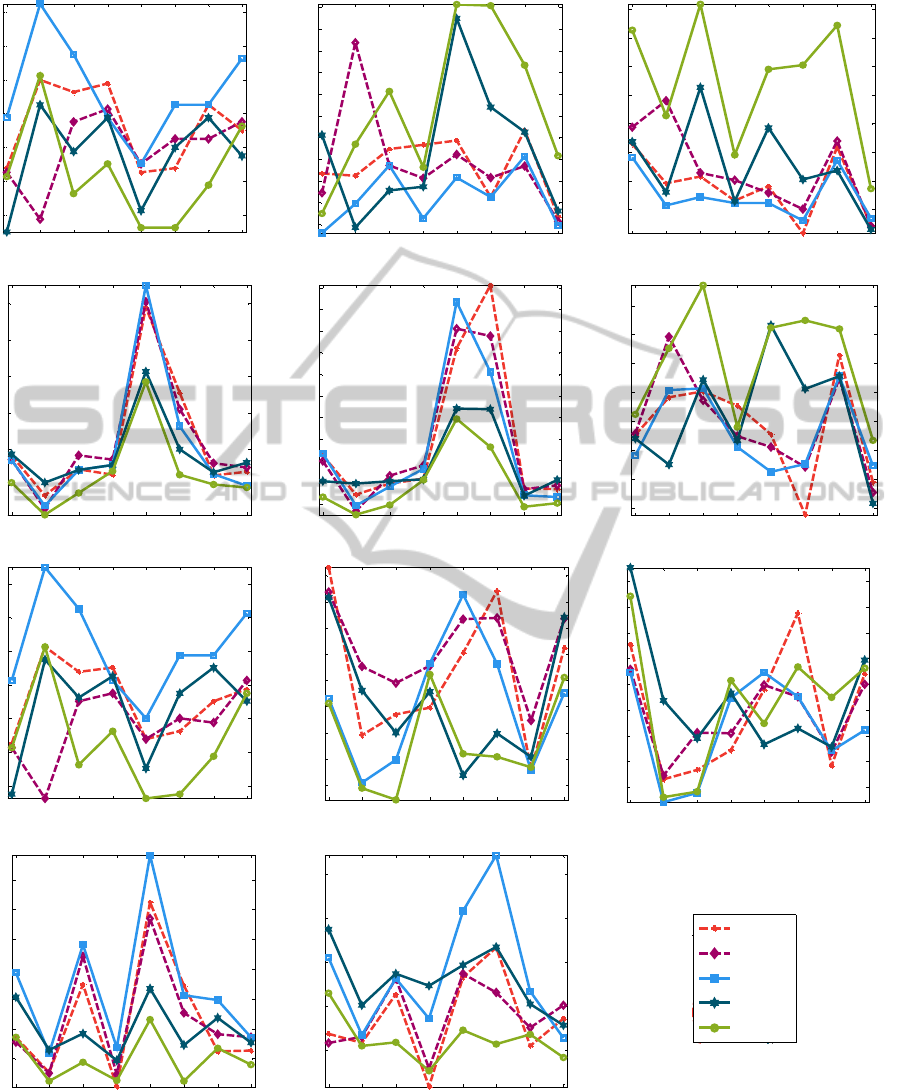
Figure 4: Results for each feature after clinical labelling of bursts and applying different burst detection methods (meth1:
based on line length calculation, meth2: based on envelope calculation, meth3: using Non-Linear Energy Operator).
pt1 pt1_2 pt1_3 pt2 pt3 pt4 pt4_2 pt5
9
10
11
12
13
14
15
number of bursts / 2,5 minutes
pt1 pt1_2 pt1_3 pt2 pt3 pt4 pt4_2 pt5
3.5
4
4.5
5
5.5
6
6.5
7
7.5
8
8.5
median burst duration (s)
pt1 pt1_2 pt1_3 pt2 pt3 pt4 pt4_2 pt5
15
20
25
30
35
40
45
50
max burst duration (s)
pt1 pt1_2 pt1_3 pt2 pt3 pt4 pt4_2 pt5
8
10
12
14
16
18
averaged amplitude bursts (microV)
pt1 pt1_2 pt1_3 pt2 pt3 pt4 pt4_2 pt5
6
8
10
12
14
16
18
20
22
24
26
averaged energy bursts (microV
2
)
pt1 pt1_2 pt1_3 pt2 pt3 pt4 pt4_2 pt5
35
40
45
50
55
60
65
70
burst %
pt1 pt1_2 pt1_3 pt2 pt3 pt4 pt4_2 pt5
9
10
11
12
13
14
15
number of IBIs / 2,5 minutes
pt1 pt1_2 pt1_3 pt2 pt3 pt4 pt4_2 pt5
4
4.5
5
5.5
6
6.5
7
7.5
8
median IBI duration (s)
pt1 pt1_2 pt1_3 pt2 pt3 pt4 pt4_2 pt5
10
12
14
16
18
20
22
24
26
max IBI duration (s)
pt1 pt1_2 pt1_3 pt2 pt3 pt4 pt4_2 pt5
3.5
4
4.5
5
5.5
6
6.5
averaged amplitude IBIs (microV)
pt1 pt1_2 pt1_3 pt2 pt3 pt4 pt4_2 pt5
1
1.5
2
2.5
3
averaged energy IBIs (microV
2
)
clin1
clin2
meth1
meth2
meth3
Legend
AutomaticBurstDetectionbasedonLineLengthinthePrematureEEG
109

described methods and two clinicians. Mean
duration is not shown because it has similar values
as the median duration, where the median is more
robust. Detection is subjective from rater to rater,
what always leads to a difference between the values
between the raters. In other words, there is no golden
standard for the description of bursts and IBIs.
Nevertheless, a clear distinction between bursts
and IBIs can be found by looking at two features:
average amplitude and average energy operator.
Namely, the average amplitude for IBIs is smaller
than the average amplitude for bursts. This is always
the case, for all methods and for all raters. This is
also true for values of the average energy operator.
IBIs contain less energy than bursts.
Although burst% was considered as the
statistically most significant parameter for
correlations between all raters (Palmu et al., 2010),
representation of this feature in Figure 4 shows that
the correlation between values obtained by the
NLEO algorithm and the clinicians is not that high.
Especially the line length method gives a high
correlation.
Maximum IBI duration has been reported to
decrease as the postmenstrual age increases
(Hayakawa et al., 2001). In the present study, the
maximum IBI decreases from the first measurement
to the second measurement two weeks later for
patients 1 and 4 (Figure 4). Not only a decrease of
the maximum IBI duration, but also a decrease of
the median IBI value has a good prognostic value for
good neurological outcome. Values for this
parameter decrease as well for patients 1 and 4.
By checking differences between values obtained
for clinical and algorithm detection, it can be said
that the developed algorithm approximates well the
values of the parameters after the clinical detection.
5 CONCLUSIONS
The developed algorithm is a successful strategy to
detect patterns in the premature EEG, like bursts and
the intervals between them. The automated analysis
of EEG provides possibilities to look over a longer
period of time and over various records at different
points in time. Also, assessment of the evolution
over time of the unique characteristics of the EEG is
very valuable. Consequently, good approximation of
clinical features is of high importance. Thereby, it
aggregates the experience and trained eyes of more
clinical doctors and researchers in an overarching
model. Future work will focus on fine-tuning the
algorithm based on a larger dataset of validated EEG
segments. Additionally, more features and their
clinical relevance have to be explored. Such a
detection algorithm would dramatically improve the
overall assessment in the NICU for EEG diagnosis.
ACKNOWLEDGEMENTS
Research supported by
Research Council KUL: GOA MaNet, PFV/10/002
(OPTEC), IDO 08/013 Autism, several PhD/postdoc
& fellow grants;
Flemish Government: FWO: PhD/postdoc grants,
projects: G.0427.10N (Integrated EEG-fMRI),
G.0108.11 (Compressed Sensing) G.0869.12N
(Tumor imaging); IWT: TBM070713-Accelero,
TBM070706-IOTA3, TBM080658-MRI (EEG-
fMRI), TBM110697-NeoGuard, PhD Grants; IBBT;
MDV is supported by an Alexander von Humboldt
stipend.
Belgian Federal Science Policy Office: IUAP P7/
(DYSCO, `Dynamical systems, control and
optimization', 2012-2017); ESA AO-PGPF-
01, PRODEX (CardioControl) C4000103224.
EU: RECAP 209G within INTERREG IVB NWE
programme, EU HIP Trial FP7-HEALTH/ 2007-
2013 (n° 260777).
REFERENCES
Accardo, A., Affinito, M., Carrozzi, M., et al., 1996. Use
of the fractal dimension for the analysis of
electroencephalographic time series. In Biological
Cybernetics, 77: p. 339-350.
De Vos, M., Deburchgraeve, W., Cherian, P.J., et al.,
2011. Automated artifact removal as preprocessing
refines neonatal seizure detection. Clinical
Neurophysiolog, 122, p. 2345-2354.
Esteller, R., Echauz, J., Tcheng, T., et al., 2001. Line
length: An efficient feature for seizure onset detection.
Papers from 23
rd
annual International Conference of
the IEEE Engineering in Medicine and biology
Society, Istanbul, Turkey.
Hayakawa, M., Okumura, A., Hayakawa, F., et al., 2001.
Background electroencephalographic (EEG) activities
of very preterm infants born at less than 27 weeks
gestation: a study on the degree of continuity. In
Archives of Disease in Childhood – Fetal and
Neonatal Edition, 84: p. 163–167.
Jennekens, W., Ruijs, L. S., Lommen, C. M. L., et al.,
2011. Automatic burst detection for the EEG of the
preterm infant. In Physiological Measurement, 32: p.
1623–1637.
Le Bihannic, A., Beauvais, K., Busnel, A., et al., 2011.
Prognostic value of EEG in very premature newborns.
BIOSIGNALS2013-InternationalConferenceonBio-inspiredSystemsandSignalProcessing
110

In Archives of Disease in Childhood - Fetal and
Neonatal Edition, 97 no.2: p. 106-109.
Palmu, K., Stevenson, N., Wikström, S., et al., 2010.
Optimization of an NLEO-based algorithm for
automated detection of spontaneous activity transients
in early preterm EEG. In Physiological Measurement,
31: p. 85-93.
Palmu, K., Wikström, S., Hippeläinen, E., et al., 2010.
Detection of ‘EEG bursts’ in the early preterm EEG:
Visual vs. Automated detection. In Clinical
Neurophysiology, 121: p. 1015-1022.
Särkelä, M., Mustola, M., Seppänen, T., et al., 2002.
Automatic analysis and monitoring of burst
suppression in anesthesia. In Journal of Clinical
Monitoring and computing, 17: p. 125-134.
Vanhatalo S., Kaila, K., 2006. Development of neonatal
EEG activity: from phenomenology to physiology. In
Seminars in fetal & neonatal medicine, 11 no. 6: p.
471-478.
AutomaticBurstDetectionbasedonLineLengthinthePrematureEEG
111
