
Athlete Identification using Acceleration and Electrocardiographic
Measurements Recorded with a Wireless Body Sensor
Peter Christ
1
, Felix Werner
1
, Ulrich R
¨
uckert
1
and J
¨
org Mielebacher
2
1
Cognitronics and Sensor Systems Group, CITEC, Bielefeld University, Bielefeld, Germany
2
Mielebacher Informatiksysteme, Fahrenheitstr. 1, Bremen, Germany
Keywords:
Human Identification, Accelerometer, Electrocardiograph (ECG), Wireless Body Sensor (WBS), Pattern
Recognition.
Abstract:
In this paper we propose a biometric method for identifying humans during walking and jogging. We use
acceleration and electrocardiographic measurements recorded with a wireless body sensor attached to a chest
strap. Our method does not require a particular acquisition setup. Information on the gait style and on the
physiology is combined to identify a human despite severe motion related artefacts in the electrocardiograph
and variations in the gait patterns. We propose to identify humans using features extracted in time and fre-
quency domain and a standard classifier. With the collected data of 22 subjects on a treadmill at velocities
from 3 to 9 km/h we obtained an accuracy of 98.1 %. The sensitivity of the identification ranged between 94.6
to 99.5 % for the different subjects and the specificity was higher than 99.7 %.
1 INTRODUCTION
The identification of humans is important for various
applications such as surveillance systems, authoriza-
tion checks at doors or electronic devices (e.g. com-
puter, smartphone). A variety of biometric character-
istics have been investigated such as information from
fingerprint, iris and retina, human face, voice, gait or
electrocardiograph.
Previous work has shown that discerning, repro-
ducible information on the human is found in the
ECG waveform, especially around the QRS com-
plex (Conover, 2002; Chan et al., 2008). Moreover,
biomechanical differences between the gait style of
humans have been investigated and used for identifi-
cation within video and acceleration sensor based ap-
plications (Gafurov et al., 2006; Nixon et al., 2006).
We propose a biometric measure combining both
sources of information: characteristics in the electro-
cardiograph (ECG) waveform and the gait style. Un-
like other applications, our approach focuses on the
identification of athletes during physical exercise us-
ing a compact wireless body sensor (WBS) which is
worn around the chest (see Figure 1). The WBS is
typically used to measure the heart-rate and the body
accelerations of athletes. Our identification method
additionally utilizes the sensor measurements to iden-
tify the athlete, enabling an automatic annotation of
sensor data with the subject’s identity. Our goal is
to overcome the drawbacks of a manual annotation
of measurements for applications in sports medicine
and athlete training research. Furthermore, recogniz-
ing the subject allows to automatically load personal
settings on the WBS or the sport equipment for a cus-
tomized training. Our identification method is in par-
ticular interesting for a WBS which is used with sev-
eral athletes of a mid-sized group.
Our identification method uses features in time
and frequency domain to extract characteristics on the
subject which are used as input to a classifier for iden-
tification. By combining information from gait and
ECG we can successfully identify subjects despite of
artefacts in the ECG caused by a slipping of the ECG
electrodes and severe variations in the gait patterns
between walking and jogging.
Previous work in this field focused on the identifi-
cation of humans from either gait or ECG waveform
characteristics. Mainly ECGs were used which were
recorded at rest or with a clinical acquisition setup.
The gait based identification was carried out for walk-
ing velocities.
Rong et. al (2007) proposed a method which
uses measurements recorded during walking with an
accelerometer located at the subject’s waist. The
method utilises a segmentation into gait cycles to ex-
tract gait patterns. Dynamic time warping is applied
11
Christ P., Werner F., Rückert U. and Mielebacher J..
Athlete Identification using Acceleration and Electrocardiographic Measurements Recorded with a Wireless Body Sensor.
DOI: 10.5220/0004190300110019
In Proceedings of the International Conference on Bio-inspired Systems and Signal Processing (BIOSIGNALS-2013), pages 11-19
ISBN: 978-989-8565-36-5
Copyright
c
2013 SCITEPRESS (Science and Technology Publications, Lda.)
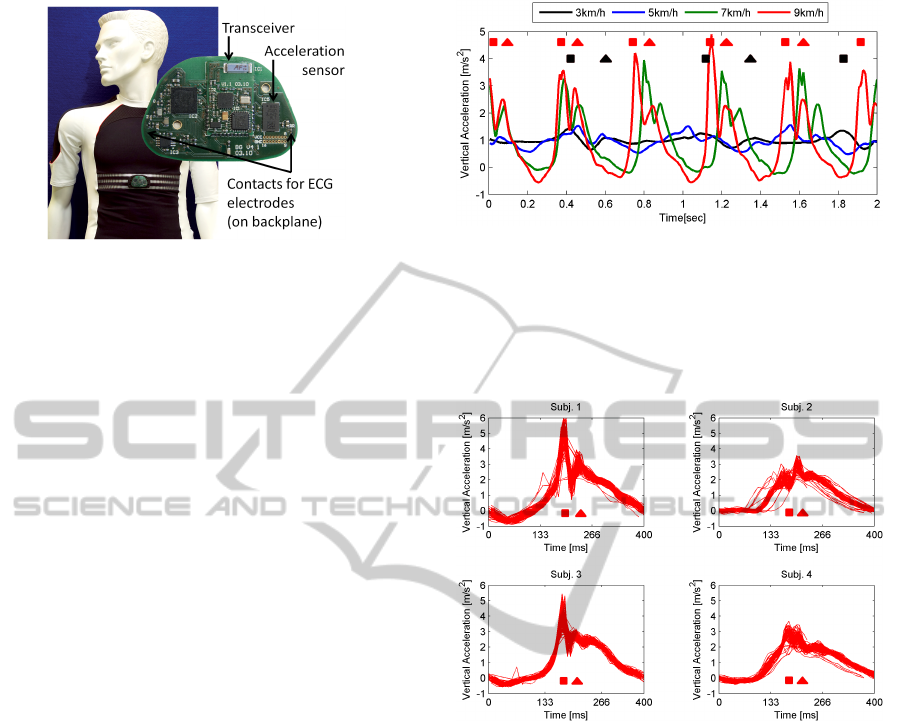
Figure 1: Our self-made wireless body sensor (WBS) and
its integration into a chest strap. The WBS can measure a
person’s electrocardiograph (ECG) and accelerations of the
body along three orthogonal axes.
to compensate natural changes in walking speed. The
actual gait segment is then compared with a reference
pattern of the subject and a 1-nearest neighbour clas-
sifier is used to recognize the subject. Ailisto et. al
(2005) evaluated an accelerometer based identifica-
tion based on similarities between gait segments to
protect portable devices. M
¨
antyj
¨
arvi et. al (2005)
evaluated a gait based identification for different
walking velocities using correlation coefficients de-
rived from a template comparison, frequency coeffi-
cients and a histogram based comparison. Gafurov et.
al (2006) proposed two methods based on histogram
similarity and gait cycle length to distinguish acceler-
ation measurements recorded at the lower leg.
Several methods have been proposed to identify
a human based on ECG measurements. Biel et.
al (2001) used data from a standard 12-lead ECG
recorded during rest to identify subjects using mul-
tivariate analysis. Furthermore, the study showed that
identification is possible with even one-lead ECGs.
Shen et. al (2002) also utilises data from one-lead
ECGs to distinguish subjects using a template match-
ing and a decision-based neural network. Chan et.
al (2008) identifies subjects based on ECGs recorded
within a non-clinical acquisition setup where the sub-
jects were holding two electrodes on the pads of their
thumbs. For classification, three qualitative measures
were used: percent residual difference, correlation
coefficient, and a novel distance measure based on
wavelet transform.
This paper is organized as follows: Section 2 de-
scribes the identification of a subject based on accel-
eration and ECG measurements. Information on pre-
processing, feature extraction and used classifiers is
given. Section 3 explains the conducted experiment
for data collection. Section 4 presents the experimen-
tal results of our identification method. The results are
summarised and discussed in section 5 and a prospect
on our future work is given.
Figure 2: Vertical acceleration data of a subject walking and
jogging at velocities from 3 to 9 km/h. Each stride is rep-
resented by two consecutive peaks which correspond to the
heel strike (square) and the toe strike (triangle). These peaks
are marked for 9 km/h (red) and for 3 km/h (black). Veloc-
ity can be increased with either longer strides (increase in
signal amplitude) or a higher step frequency.
Figure 3: Alignment of 100 consecutive strides of four
subjects jogging at 9 km/h. The vertical acceleration sig-
nals were automatically segmented into strides and cross-
correlation was used to align the strides. The peaks related
to the heel strikes (square) and toe strikes (triangle) signifi-
cantly differ in shape between the subjects.
2 IDENTIFICATION OF A
SUBJECT
This section describes the identification of a subject
based on gait style and ECG waveform characteris-
tics. We describe the preprocessing of the signals, the
feature extraction and the classifiers used for identifi-
cation.
2.1 Gait Analysis for Identification
Previous work has shown that gait differs between hu-
mans and that the gait style is fairly stable for a sub-
ject (Bianchi et al., 1998; Nixon et al., 2006). Bianchi
BIOSIGNALS2013-InternationalConferenceonBio-inspiredSystemsandSignalProcessing
12
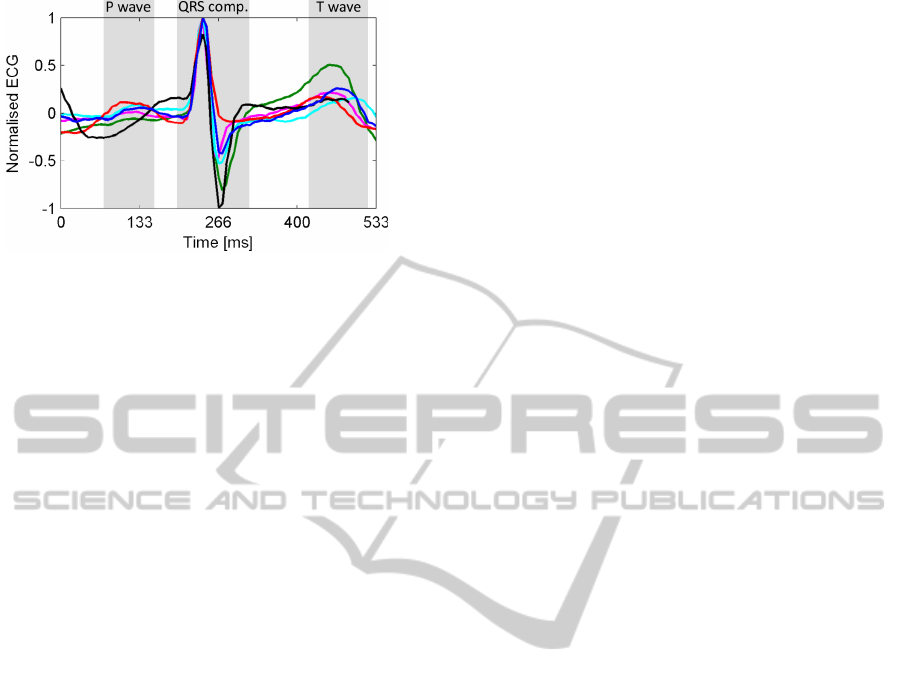
Figure 4: Comparison of heartbeat segments of six subjects
(different colours). The DC-offset was removed and the
heartbeat segments were aligned using cross-correlation.
We use inter-subject variations in the ECG waveform to
identify subjects.
et. al (1998) stated that the variability across humans
depends on different kinematic strategies rather than
on biomechanical characteristics. Their study showed
that subjects are different in the ability of minimising
energy oscillations of their body segments for trans-
ferring mechanical energy.
In order to measure these inter-subject differences,
severe intra-subject variations in the gait patterns be-
tween walking and jogging have to be taken into ac-
count. The intra-subject variations are a result of
an adaptation of the gait to achieve different veloci-
ties. The velocity of a person is described by stride
length and stride frequency. According to Weyand
et. al (2000), longer strides are achieved by apply-
ing greater support forces to the ground which sig-
nificantly increases the amplitude of the vertical ac-
celeration signal, whereas the step frequency changes
frequency components of the signal.
Samples of vertical acceleration data of one sub-
ject walking and jogging at different velocities on a
treadmill are shown in Figure 2. Strides are pre-
sented by two consecutive peaks corresponding to the
heel and toe strikes. Significant changes in amplitude
and an almost doubling of the step frequency can be
observed between walking at 3 km/h and jogging at
9 km/h.
Despite of this intra-subject variability in the gait
patterns, we observed inter-subject variations in ac-
celeration signals recorded during walking and jog-
ging (Christ et al., 2011). In particular, heel and toe
strikes differ in the vertical acceleration signal’s shape
between subjects (see Figure 3). The peak accelera-
tion of the heel strikes varies between the four sub-
jects about 2 m/s
2
.
2.2 ECG Analysis for Identification
Inter-subject variability is also found in the ECG’s
waveform. The variations depend on position, size
and anatomy of the heart, age, sex, relative body
weight, chest configuration and various other fac-
tors (Green et al., 1985; Simon and Eswaran, 1997).
Figure 4 shows sample heartbeat segments from six
subjects recorded with our WBS. The ECG reflects
the electrical activity of the heart and consists of the
P wave followed by the QRS complex and the T
wave (Conover, 2002, chap. 2). Discerning informa-
tion on the subjects is found in the QRS complex, the
P and the T wave.
Chan et. al (2008) observed a high degree of re-
producibility of information extracted from the QRS
complex of a person through several sessions of
recording. Furthermore, a higher identification accu-
racy was determined for the P wave than the T wave.
During physical exercise these characteristics can
be superposed by motion related artefacts. These arte-
facts are caused by a slipping of the ECG electrodes
and variations in the contact resistance during body
movements (Christ et al., 2010). Figure 7 shows dis-
turbances in the ECGs of two subjects recorded dur-
ing jogging on a treadmill.
2.3 Preprocessing of Acceleration and
ECG Signals
ECGs recorded with our WBSs showed hardware-
related differences in the DC-offset making an ECG
associable to a WBS. Furthermore, using textile ECG
electrodes, the skin contact resistance decreases over
time because of an increased transpiration which re-
sults in changes in the DC-offset. In order to avoid
classification errors, we removed the DC-offset using
a 4th-order high-pass butterworth filter with a cutoff
frequency of f
c
= 0.67 Hz. Additionally, we applied a
low-pass filter with a cutoff frequency of f
c
= 40Hz
to remove noise in the ECG signal.
With a decrease in skin contact resistance after
a few minutes of exercise, we observed an increase
in the ECG signal’s amplitude which improved the
signal-to-noise ratio. We normalised the signal’s am-
plitude to assure that ECG segments are comparable.
The results of the ECG preprocessing are shown in
Figures 5 a and b.
For the frequency analysis of the acceleration
measurements, we approximated the dynamic accel-
erations by applying a 4th-order butterworth high-
pass filter with a cutoff frequency of f
c
= 0.1 Hz
to the magnitude of the acceleration vector a =
(a
AP
,a
ML
,a
V
); a
AP
denotes anteroposterior accelera-
AthleteIdentificationusingAccelerationandElectrocardiographicMeasurementsRecordedwithaWirelessBodySensor
13
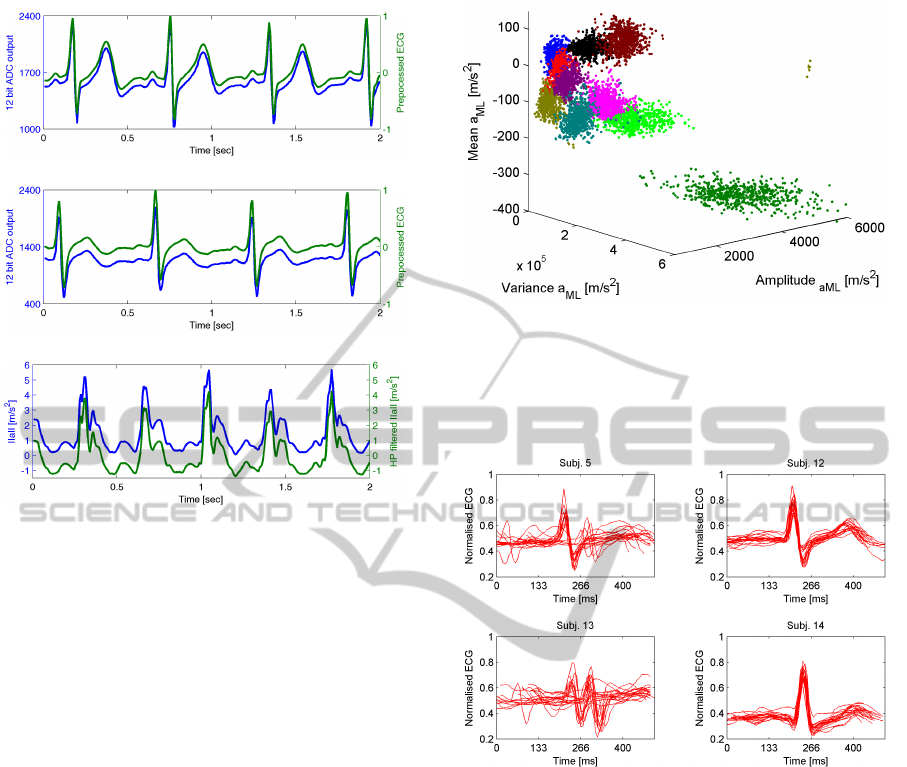
(a) ADC output and preprocessed ECG of subject 1.
(b) ADC output and preprocessed ECG of subject 2.
(c) Magnitude of the acceleration vector a and the offset reduction by
the high-pass filter.
Figure 5: The 12 bit analog-to-digital converter (ADC) out-
put and the preprocessed ECG in comparison. An offset of
300 between the ADC output of the two different subjects
was removed by the preprocessing. In Figure 5 c the offset
due to the static acceleration of gravity and a sensor-related
zero-g-level offset are reduced after preprocessing.
tions, a
ML
mediolateral accelerations and a
V
vertical
(up-down) accelerations. The high-pass filter reduced
the impact of the static acceleration due to gravity
and a sensor-related offset (zero-g level offset). The
results of this preprocessing step are shown in Fig-
ure 5 c.
2.4 Feature Extraction for Identification
In order to access characteristics of a subject in the ac-
celeration and ECG measurements, we extracted fea-
tures in the time and the frequency domain.
The features were calculated within a sliding win-
dow with no overlap and length N. Each window
at time t consists of N measurements x(t : t +N −
1) = x(t),x(t+1), ...,x(t+N−1). We empirically de-
termined an appropriate window length of two sec-
onds (N = 300).
Time Domain Features. In the time-domain we
calculated the variance, amplitude, mean and root
mean square (RMS) along the three orthogonal axes
a
AP
,a
ML
and a
V
of the windowed acceleration signals.
Figure 6: Visualisation of time domain features ex-
tracted from mediolateral accelerations a
ML
of ten subjects
at 9 km/h. Clusters are observable for the different subjects.
In our feature selection we obtained a good identification
performance based on the mean, the variance, the amplitude
and the root-mean-square (RMS) features (see Table 3).
Figure 7: Alignment of 20 heartbeat segments of four sub-
jects recorded during jogging on a treadmill. A correct
placement of the chest strap is important for an identifica-
tion based on a similarity measure between heartbeat seg-
ments. Motion related artefacts and poor skin contact can
disturb the ECG-signal (see subjects 5 and 13).
The variance, mean and amplitude of a
ML
are visu-
alised in Figure 6. Discriminative clusters can be ob-
served for the different subjects. From the ECG sig-
nal we calculated a feature measuring the closeness of
an unknown heartbeat segment to five reference pat-
terns stored for each subject. This step requires a seg-
mentation of the ECG signal into heartbeats. We used
a QRS detection based on the algorithm of (Afonso
et al., 1999) in its implementation of Schloegl in the
BioSig toolbox (Vidaurre et al., 2011). The five refer-
ence heartbeat segments were chosen randomly from
the ECG data of each subject. However, we assured
that only heartbeat segments without severe distur-
bances were chosen. For identification, an unknown
segment x was aligned to each reference segment y
BIOSIGNALS2013-InternationalConferenceonBio-inspiredSystemsandSignalProcessing
14

Figure 8: The FFT amplitude spectra of the ECG sig-
nals of three subjects during walking (3 km/h) and jog-
ging (9 km/h). The amplitude spectra show differences be-
tween the subjects but also vary with the velocity.
using cross-correlation:
R
xy
(m) =
1
N
N−m−1
∑
j=0
y( j+m)x( j) (1)
where N is the length of a segment and m the offset
with m = 0,1,...,2N−1. We calculated the Pearson’s
correlation coefficient as a measure of similarity be-
tween the two segments. The Pearson’s correlation
coefficient is defined as the covariance (cov) of the
two segments divided by the product of their standard
deviation σ:
r(x, y) =
cov(x,y)
σ
x
σ
y
(2)
Figure 7 shows the alignment of 20 heartbeat seg-
ments of four subjects. The QRS-detection and
the alignment are sensitive to motion-related arte-
facts (see subjects 5 and 13).
For heartbeat segments without major distur-
bances the alignment centred the segments around the
QRS complex. The discerning information in this re-
gion of the ECG is fairly stable in relation to morphol-
ogy changes in the ECG waveform during effort.
Frequency Domain Features. In the frequency do-
main we use the discrete Fourier transform (DFT) to
extract frequency components of each window. The
DFT is defined as:
X(k) =
t+K−1
∑
j=t
x( j)e
−i2πk
j
K
, k =0,...,K−1 (3)
where K is the number of outputs X(k). We used a
512-point fast Fourier transform (FFT) algorithm to
compute the DFT efficiently for our windows of the
length N = 300. Therefore, each window x(t :t +N−
1) was padded with trailing zeros to the length of K =
512. Before calculating the FFT, a Hamming window
function was applied to each window to reduce the
spectral leakage.
Figure 8 shows the FFT amplitude spectra of
ECGs of three subjects recorded during walk-
ing (3 km/h) and jogging (9 km/h). Despite of velocity
related variations in the amplitude spectra, differences
can be observed between the three subjects.
We calculated additional frequency domain fea-
tures from the amplitude spectrum (FFT features): the
variance, the mean, the Fourier coefficient with the
highest amplitude and the Shannon entropy SE:
SE = −
K−1
∑
k=0
|
X(k)
|
log
2
(
|
X(k)
|
) (4)
where X(k) is the output of the DFT of length K.
2.5 Methods for Classification
We used a standard classifier to identify the subject
based on the extracted features. The identification
performance was determined by evaluating three dif-
ferent classifiers: artificial neural network (ANN),
support vector machine (SVM), and random for-
est (RF).
Artificial Neural Network (ANN). We used a
feed-forward ANN with 25 neurons with tangent sig-
moid activation functions in one hidden layer to asso-
ciate the extracted features with the subjects’ identi-
ties. The ANN was trained using back-propagation
which is a supervised learning method (Han and
Kamber, 2006). During training the prediction of
the network is compared to the known target value
(subject’s identity) and the weights are modified to
minimize the mean square error. These errors propa-
gate backwards from the output layer to the hidden
layer (Han and Kamber, 2006). The network was
trained using the scaled conjugate gradient algorithm
described in (Møller, 1993). The weights and bias
values of the neurons were updated using a gradient
descent with momentum.
Support Vector Machine (SVM). We used a ν-
SVM (Sch
¨
olkopf et al., 2000) with a sigmoid kernel in
its implementation in the LIBSVM
1
(Chang and Lin,
2011). SVMs are fundamentally a two-class classi-
fier. Various methods have been proposed how to use
SVMs for multi-class problems (Bishop, 2006, chap.
1
LIBSVM: library for support vector machines.
AthleteIdentificationusingAccelerationandElectrocardiographicMeasurementsRecordedwithaWirelessBodySensor
15

Table 1: Characteristics of the 22 subjects (15 men, 7
women) who participated in the data collection.
Characteristic Mean ± SD Range
Age (yr) 26.6 ± 4.0 18-33
Height (cm) 179.8 ± 9.6 160-198
Weight (kg) 76.7 ± 11.1 58-108
7). We used a one-against-one method which con-
structs n(n − 1)/2 classifiers where n is the number
of classes to distinguish. Each classifier is trained on
tuples from two classes. A voting strategy is then ap-
plied to determine the winning class (Hsu and Lin,
2002).
Random Forest (RF). A random forest is a clas-
sifier consisting of a combination of tree predictors.
The growth of each tree is governed by independently
and identically distributed random vectors (Breiman,
2001). Each tree votes for one class and the class
which occurs most frequently is the output of the clas-
sifier. RF classifiers are fast in the training phase and
the training time is linear to the number of trees used.
The testing of an unknown tuple is performed on each
tree independently and is therefore parallelisable. We
used a RF consisting of 100 trees, with each tree being
constructed of ten randomly chosen features.
3 SUBJECTS AND DATA
COLLECTION
Twenty-two healthy subjects (15 men, 7 women) vol-
unteered to participate in the study. The subjects
were informed verbally and in writing in advance
and signed an informed consent document. With a
questionnaire we additionally obtained information
on age, height and weight (see Table 1).
The data was collected using the treadmills in the
gymnasium of our university. Velocities between 3
to 9 km/h were chosen to cover slow, normal, and
fast walking as well as jogging. The treadmill was
set to no incline and the velocity was manually in-
creased by 2 km/h every two minutes. This procedure
was repeated twice for each subject in order to collect
enough data.
The accelerations of the upper body and the
ECG were recorded with a self-made WBS (see Fig-
ure 1). The WBS measures accelerations within a
range of ±6 m/s
2
along three orthogonally oriented
axes using a commercial off-the-shelf accelerometer
(ST LIS3LV02DL). The ECG is digitized using the
analog-to-digital converter of a TI MSP430 micro-
controller. Body accelerations and ECG were mea-
sured with a 150 Hz sampling rate and a 12 bit resolu-
tion (range 0 to 4095). The measurements were sent
wirelessly to a nearby receiver for recording.
The subjects were given an explanation as how to
place the chest strap with the WBS tightly around the
chest. However, we didn’t verify the correct place-
ment of the WBS to assure real world conditions. Fur-
thermore, no instructions were given on how to per-
form the exercise.
4 RESULTS
This section describes the evaluation of the athlete
identification on data collected from 22 subjects dur-
ing walking and jogging on a treadmill.
Evaluation Methods. All features were calculated
on windows of acceleration and ECG measurements
of two seconds. No overlap of the windows was cho-
sen to ensure fully discriminative training and test-
ing data. We concatenated features of two consecu-
tive windows to have samples of four seconds of data
to identify the subject. Our dataset consists of 4048
samples (184 samples per subject). The identification
performance was determined using a ten-fold cross-
validation. For evaluation, we used three statistical
measures: sensitivity, specificity and accuracy. In or-
der to calculate the statistics we obtained the number
of true positive samples TP
i
, true negative samples
TN
i
, false positive samples FP
i
, and false negative
samples FN
i
from the classifier’s output. For a class i
the sensitivity R
i
is defined as:
R
i
=
TP
i
TP
i
+ FN
i
∗ 100 (5)
The sensitivity (also referred to as recall) measures
the percentage of correctly classified positive samples
in relation to all positive samples. For negative sam-
ples the specificity S
i
is defined as:
S
i
=
TN
i
TN
i
+ FP
i
∗ 100 (6)
We calculated the overall sensitivity R and the overall
specificity S as a class-based weighted average. For
our multi-class problem we refer to the overall sensi-
tivity as the accuracy of the classifier:
ACC = R =
n
∑
i=1
p
i
R
i
(7)
where n denotes the number of classes and p
i
the
probability of the occurrence of the class in the test
BIOSIGNALS2013-InternationalConferenceonBio-inspiredSystemsandSignalProcessing
16

Table 2: Accuracy (ACC) and overall specificity (S) results
determined with different classifiers on a feature space com-
bining acceleration and ECG features (combination C8, see
Table 3). The highest performance was obtained with the
RF classifier.
Classifier ACC S
ANN 94.2 % 99.8 %
SVM 90.4 % 99.5 %
RF 98.1 % 99.9 %
Figure 9: Class-specific sensitivity (stars) and specificity
(squares) results of the identification of the 22 subjects (RF
classifier, feature combination C8). The sensitivity varied
between 94.6 to 99.5 %. The specificity was over 99.7 %
for all subjects.
data. In our test data the samples of the 22 classes are
equally distributed (p
i
= 1/22, ∀i). The overall speci-
ficity S is calculated accordingly. The optimum of the
statistical measures is 100 %.
Results of the Athlete Identification. We deter-
mined the identification performance for three stan-
dard classifiers: ANN, SVM and RF. The classifiers
and their parametrization are described in section 2.5.
We achieved up to 98.1 % accuracy (see Table 2) with
the RF classifier using a feature space combining ac-
celeration and ECG based features. The lowest accu-
racy of 90.4 % was obtained with the SVM. For all
three classifiers, we obtained an overall specificity S
of more than 99 %.
The class-specific sensitivity (see Equation 5) of
the identification varied between 94.6 to 99.5 % for
the different subjects (RF classifier, see Figure 9). We
observed only low deviations in the identification’s
specificity between the 22 subjects. A class-specific
specificity (see Equation 6) of more than 99.7 % was
achieved for all subjects.
We performed a feature selection using the ANN
classifier to determine the impact of the different fea-
tures and to identify combinations C with a high clas-
sification performance (see Table 3). We obtained a
similar identification accuracy based on acceleration
(86.6 %, C6) and ECG (84.8 %, C4) measurements. In
combination, the accuracy improved to 94.2 % (C8).
The ECG contained more information on the sub-
ject in the frequency domain than the acceleration
Table 3: Identification accuracy of different feature combi-
nations C. We obtained a similar accuracy with accelera-
tion and ECG based features (see C4, C6). Combining both
improved the accuracy (see C8). The feature selection was
performed using the ANN classifier. * denotes the use of the
average over the five correlation coefficients per subject.
C Acceleration feat. ECG feat. ACC
Time FFT FFT FFT FFT Corr.
dom. coef. feat. coef. feat. coef.
C1 - - - x x - 72.4 %
C2 - - - - - x 80.3 %
C3 x - - - - - 83.3 %
C4 - - - x x x 84.8 %
C5 x - - - x - 86.5 %
C6 x x x - - - 86.6 %
C7 x - - - - x 93.6 %
C8 x x x x x x* 94.2 %
measurements (12.3 % higher accuracy). Frequencies
of up to 10 Hz contained the most discriminant in-
formation of the acceleration measurements. A re-
duction of the frequency band from 40 to 10 Hz re-
duced the identification accuracy by only 3.8 %. For
the ECG measurements, a reduction from 40 Hz to
15 Hz resulted in a 8.8 % lower accuracy. Overall, we
obtained an accuracy of 72.4 % (C1) for features ex-
tracted from the ECG in the frequency domain.
We found that correlation coefficients describing
the similarity between heartbeat segments provide
useful insights to identify subjects (80.3 % accuracy,
C2). To reduce the dimensionality of the feature
space, we averaged the correlation coefficients corre-
sponding to the five reference segments per subject.
This averaging resulted in a 7.7 % lower accuracy.
However, in combination with other features this dif-
ference was negligible (0.4 % for C8).
The time domain features calculated from the ac-
celeration signals showed a good accuracy (83.3 %,
C3). Additional information on the gait in the fre-
quency domain improved the identification accuracy
to 86.6 % (C6).
By combining the time domain features of the ac-
celeration data with the correlation coefficients de-
rived from the ECG, we achieved a high accuracy
of 93.6 % (C7), which is only 0.6 % less than using
the full feature set (C8).
For the time domain features extracted from the
acceleration signals, we analysed the impact of the
different acceleration axes on the subject’s identifi-
cation accuracy. The highest accuracy was obtained
for the anteroposterior accelerations (a
AP
). The medi-
olateral accelerations (a
ML
) showed a 4.4 % and the
vertical accelerations (a
V
) a 16.2 % lower accuracy.
We additionally evaluated our approach using a
hold-out validation for which the data set was split
AthleteIdentificationusingAccelerationandElectrocardiographicMeasurementsRecordedwithaWirelessBodySensor
17

Table 4: Identification accuracy (ACC) and equal error ratio
(ERR) of the RF classifier obtained with a ten-fold cross-
validation and a hold-out validation (percentage split: 66 %
training, 34 % testing) on feature combination C8.
Validation ACC ERR
Ten-fold cross-validation 98.1 % 1.1 %
Hold-out validation 97.2 % 3.4 %
Table 5: Equal error ratio (ERR) of other gait based iden-
tification methods. N denotes the number of subjects who
participated in the experiments.
Velocities N ERR
M
¨
antyj
¨
arvi et. al (2005) slow, normal and
fast walking
36 7 %
Ailisto et. al (2005) normal walking 36 6.4 %
Gafurov et. al (2006) normal walking 21 5 %
Rong et. al (2007) normal walking 21 5.6 %
in 66 % training data and 34 % testing data. A
hold-out validation avoids temporal proximity be-
tween training and testing data and allows therefore a
more accurate estimation of the generalization perfor-
mance. We noted only a slight decrease in accuracy
by 0.9 % for the RF classifier (see Table 4).
To estimate the impact of the number of subjects
in the data set on the identification performance, we
repeated our test with eleven out of the twenty-two
subjects. For a group of eleven subjects which were
randomly chosen, the overall accuracy could be im-
proved to 99.3 % (RF classifier).
In order to compare our results with existing work,
we additionally calculated the equal error rate (ERR)
of the RF classifier on feature combination C8. The
ERR is the rate at which both accept and reject errors
are equal. For our dataset containing ECG and gait
characteristics, we obtained an ERR of 1.1 % for the
ten-fold cross-validation and 3.4 % for the hold-out
validation. Compared to other approaches which are
based on only gait characteristics our achieved ERR
is lower (see Table 5). For a comparison of our ap-
proach with an ECG based identification we have cho-
sen the method of Chan et. al (2008) because the re-
sults are also based on data from non-clinical ECGs.
With 98.1 % our accuracy is higher than Chan et. al
(2008) results (89 %). However, with an identification
on ECG characteristics only, we obtained a lower ac-
curacy (84.8 %, C4). Overall, our high performance
is achieved by combining ECG and gait characteris-
tics. We believe that motion related artefacts in the
ECG, and a high variability in the gait patterns be-
tween changing from slow walking to jogging, reduce
the identification performance when we use only one
source of information.
5 DISCUSSION AND
CONCLUSIONS
This paper is concerned with the identification of hu-
mans during walking and jogging using a single wire-
less body sensor module attached to a chest strap. Our
approach focuses on recognising a human using a bio-
metric measure based on the characteristics in the gait
style and the ECG of the human and is hence indepen-
dent of the used hardware. Thus, our system over-
comes the drawbacks of an identification based on
the WBS’s serial number or an radio-frequency based
identification (RFID) which recognises the hardware
but not the subject itself.
We have collected data from 22 subjects on a
treadmill at velocities from 3 to 9 km/h using a WBS
attached to a chest strap. To assure real world condi-
tions, no advice was given on how to perform the ex-
ercise and the correct placement of the chest strap was
not verified. Despite severe variations in the gait pat-
terns and motion-related artefacts in the ECG, which
occur due to real world conditions and physical exer-
cise, our method achieves up to 98 % accuracy.
We obtained a good identification accuracy for
time domain features extracted from the acceleration
signals. By using simple and low-dimensional fea-
tures on the acceleration signal our method can poten-
tially be implemented on computationally constrained
platforms, such as a microcontroller on a WBS.
Our identification method can presumably not be
extended to an unlimited number of subjects. The in-
dividual characteristics in the subject’s ECG and gait
patterns are extremely difficult to capture and may
change over time because of an adaptation to physi-
cal exercise. However, we believe our method is well
suited to provide an automatic annotation of sensor
measurements from several WBSs with the subject’s
identity for use in sports medicine and athletic train-
ing research. Moreover, our method helps to cus-
tomize a training session by loading personal settings
of the recognized athlete on the WBS or other sport
equipment.
Our future work includes the evaluation of the
identification method within team sports. In partic-
ular, we want to recognize handball players in order
to support a real-time vision-based tracking of these
players.
BIOSIGNALS2013-InternationalConferenceonBio-inspiredSystemsandSignalProcessing
18

ACKNOWLEDGEMENTS
This research was supported by the DFG CoE 277:
Cognitive Interaction Technology (CITEC)
REFERENCES
Afonso, V. X., Tompkins, W. J., Nguyen, T. Q., and Luo, S.
(1999). ECG beat detection using filter banks. Trans-
actions on Biomedical Engineering, 46(2):192–202.
Ailisto, H. J., Lindholm, M., Mantyjarvi, J., Vildjiounaite,
E., and Makela, S. M. (2005). Identifying people
from gait pattern with accelerometers. In Society
of Photo-Optical Instrumentation Engineers, volume
5779, pages 7–14.
Bianchi, L., Angelini, D., and Lacquaniti, F. (1998). In-
dividual characteristics of human walking mechan-
ics. Pfl
¨
ugers Archiv European Journal of Physiology,
436:343–356.
Biel, L., Pettersson, O., Philipson, L., and Wide, P. (2001).
ECG analysis: a new approach in human identifica-
tion. IEEE Transactions on Instrumentation and Mea-
surement, 50(3):808–812.
Bishop, C. M. (2006). Pattern Recognition and Ma-
chine Learning (Information Science and Statistics).
Springer-Verlag New York, Inc., Secaucus, NJ, USA.
Breiman, L. (2001). Random forests. Machine learning,
45(1):5–32.
Chan, A. D. C., Hamdy, M. M., Badre, A., and Badee, V.
(2008). Wavelet distance measure for person identifi-
cation using electrocardiograms. IEEE Transactions
on Instrumentation and Measurement, 57(2):248–
253.
Chang, C.-C. and Lin, C.-J. (2011). LIBSVM: A library
for support vector machines. ACM Transactions on
Intelligent System Technology, 2:27:1–27:27.
Christ, P., Mielebacher, J., Haag, M., and R
¨
uckert, U.
(2010). Detection of body movement and measure-
ment of physiological stress with a mobile chest mod-
ule in obesity prevention. In Proc. of the 10th Aus-
tralasian Conf. on Mathematics and Computers in
Sport, pages 67–74.
Christ, P., Werner, F., R
¨
uckert, U., and Mielebacher, J.
(2011). An approach for determining linear veloc-
ities of athletes from acceleration measurements us-
ing a neural network. In Proc. of the 6th IASTED Int.
Conf. on Biomechanics, pages 105–112. ACTA Press.
Conover, M. B. (2002). Understanding electrocardiogra-
phy. Mosby.
Gafurov, D., Helkala, K., and Søndrol, T. (2006). Biometric
gait authentication using accelerometer sensor. Jour-
nal of Computers, 1(7):51–59.
Green, L. S., Lux, R. L., Haws, C. W., Williams, R. R.,
Hunt, S. C., and Burgess, M. J. (1985). Effects of
age, sex, and body habitus on QRS and ST-T po-
tential maps of 1100 normal subjects. Circulation,
71(2):244–253.
Han, J. and Kamber, M. (2006). Data mining: concepts
and techniques. The Morgan Kaufmann series in data
management systems. Elsevier.
Hsu, C. W. and Lin, C. J. (2002). A comparison of methods
for multiclass support vector machines. IEEE Trans-
actions on Neural Networks, 13(2):415–425.
M
¨
antyj
¨
arvi, J., Lindholm, M., Vildjiounaite, E., M
¨
akel
¨
a, S.-
M., and Ailisto, H. A. (2005). Identifying users of
portable devices from gait pattern with accelerome-
ters. In IEEE Int. Conf. on Acoustics, Speech, and
Signal Processing, volume 2, pages ii/973–ii/976.
Møller, M. F. (1993). A scaled conjugate gradient algo-
rithm for fast supervised learning. Neural Networks,
6(4):525–533.
Nixon, M. S., Tan, T., and Chellappa, R. (2006). Hu-
man identification based on gait, volume 4. Springer-
Verlag New York, Inc.
Rong, L., Jianzhong, Z., Ming, L., and Xiangfeng, H.
(2007). A wearable acceleration sensor system for gait
recognition. In 2nd IEEE Conf. on Industrial Elec-
tronics and Applications, pages 2654–2659.
Sch
¨
olkopf, B., Smola, A. J., Williamson, R. C., and Bartlett,
P. L. (2000). New support vector algorithms. Neural
computation, 12(5):1207–1245.
Shen, T. W., Tompkins, W. J., and Hu, Y. H. (2002). One-
lead ECG for identity verification. In Proc. of the 2nd
IEEE Int. Joint Conf. on Engineering in Medicine and
Biology Society, volume 1, pages 62–63. IEEE.
Simon, B. P. and Eswaran, C. (1997). An ECG classifier de-
signed using modified decision based neural networks.
Computers and Biomedical Research, 30(4):257–272.
Vidaurre, C., Sander, T. H., and Schl
¨
ogl, A. (2011). BioSig:
The free and open source software library for biomed-
ical signal processing. Computational Intelligence
and Neuroscience, 2011:12.
Weyand, P. G., Sternlight, D. B., Bellizzi, M. J., and Wright,
S. (2000). Faster top running speeds are achieved with
greater ground forces not more rapid leg movements.
Journal of Applied Physiology, 89(5):1991–1999.
AthleteIdentificationusingAccelerationandElectrocardiographicMeasurementsRecordedwithaWirelessBodySensor
19
