
Using a Random Forest Classifier to Find Nuclear Export Signals
in Proteins of Arabidopsis thaliana
Claudia Rubiano
1∗
, Thomas Merkle
2
and Tim W. Nattkemper
3
1
Chemistry Department, National University of Colombia, Bogot
´
a, Colombia
2
Institute for Genome Research & Systems Biology, Faculty of Biology, Bielefeld University, Bielefeld, Germany
3
Biodata Mining Group, Faculty of Technology, Bielefeld University, Bielefeld, Germany
Keywords:
Nuclear Export Signals, Arabidopsis thaliana, Random Forest.
Abstract:
This paper presents a new computational strategy for predicting Nuclear Export Signals (NESs) in proteins
of the model plant Arabidopsis thaliana based on a random forest classifier. NESs are amino acid sequences
that enable a protein to interact with a nuclear receptor and in this way to be exported from the nucleus to the
cytoplasm. The proposed classifier uses two kinds of features, the sequence of the NESs expressed as the score
obtained from a HMM profile and physicochemical properties of the amino acid residues expressed as amino
acid index values. Around 5000 proteins from the total of protein sequences from Arabidopsis were predicted
as containing NESs. A small group of these proteins was experimentally tested for the actual presence of
an NES. 11 out of 13 tested proteins showed positive interaction with the receptor Exportin 1 (XPO1a) from
Arabidopsis in yeast two-hybrid assays, which indicates they contain NESs. The experimental validation of
the nuclear export activity in a selected group of proteins is an indicator of the potential usefulness of the tool.
From the biological perspective, the nuclear export activity observed in those proteins strongly suggests that
nucleo-cytoplasmic partitioning could be involved in regulation of their functions.
1 INTRODUCTION
Nucleo-cytoplasmic shuttling refers to the transport
of proteins and other molecules into and out of the cell
nucleus. It plays an important regulatory role in key
cellular processes like transcription, RNA processing
and cell cycle. The process is usually mediated by a
family of transport receptors known as karyopherins
(Str
¨
om and Weis, 2001) that directly or indirectly bind
to their cargoes via signals like the nuclear localiza-
tion signal (NLS) for nuclear import or the nuclear ex-
port signal (NES) for export to form a transport com-
plex (Pemberton and Paschal, 2005). In the case of
nuclear export, several pathways have been identified
(Ossareh-Nazari et al., 2001). To date, the best stud-
ied pathway depends on the presence of a leucine-rich
NES in the cargo.
Leucine-rich NESs have been experimentally ver-
ified in proteins from diverse organisms (mainly S.
cerevisiae, H. sapiens and viruses). Most of them
were compiled in the database NESbase 1.0 (La-Cour
∗
Former member of the Graduate School of Bioinfor-
matics and Genome Research, Bielefeld University, Ger-
many.
et al., 2003) and used to build a predictor for leucine-
rich NES by a combination of Hidden Markov Mod-
els (HMM) and Artificial Neural Networks (ANN)
(La-Cour et al., 2004)
2
.
The existence of a nuclear export pathway for pro-
teins carrying a leucine-rich NES in plants has been
demonstrated (Haasen et al., 1999; Merkle, 2001).
This process plays an important role in the nucleo-
cytoplasmic partioning of proteins and hence in the
regulation of many signalling processes in plants
(Merkle, 2004; Merkle, 2011). However, since the
available tool to predict NES (La-Cour et al., 2004)
very often fails to recognize them in plant proteins,
it is very likely that there are additional features spe-
cific to plants that are not included in that tool. Since
finding NES sequences in proteins by experimental
methods is expensive and time consuming, an effi-
cient computational prediction is of great interest.
It has been shown that identifying leucine-rich
NESs is not a trivial task. This is because consensus
patterns alone are not sufficient for prediction and, ad-
ditionally, Leucine is one of the most abundant amino
2
http://www.cbs.dtu.dk/services/NetNES/
98
Rubiano C., Merkle T. and W. Nattkemper T..
Using a Random Forest Classifier to Find Nuclear Export Signals in Proteins of Arabidopsis thaliana.
DOI: 10.5220/0004192200980104
In Proceedings of the International Conference on Bioinformatics Models, Methods and Algorithms (BIOINFORMATICS-2013), pages 98-104
ISBN: 978-989-8565-35-8
Copyright
c
2013 SCITEPRESS (Science and Technology Publications, Lda.)

acids in proteins. Furthermore, NESs share sequence
similarity to regions that form the hydrophobic core
of many proteins (Cook et al., 2007). Since a machine
learning method has the potential to detect very diver-
gent signals that a consensus pattern is unable to de-
tect, this approach is used here. Supervised machine
learning methods have been widely used in bioinfor-
matics prediction applications like: subcellular loca-
tion of proteins (Hua and Sun, 2001; Bendtsen et al.,
2004; Lei and Dai, 2005; Pazos and jung Wook Bang,
2006; Brameier et al., 2007; Gromiha and Yabuki,
2008; Kumar and Raghava, 2009), protein function
(Lee et al., 2009), protein secondary structure (Riis
and Krogh, 1996), protein binding sites (Liu et al.,
2009), protein-protein interaction (Bock and Gough,
2001), and special features in proteins like ubiquityla-
tion (Tung and Ho, 2008) and glycosylation (Caragea
et al., 2007).
Random forest is a classifier consisting of a collec-
tion of many decision trees where each tree is grown
using a (bootstrap) subset of the training dataset.
Bootstrapping is a resampling technique where a
number of bootstrap training sets are drawn randomly
from the original training set with replacement. Each
tree induced from bootstrap samples grows to full
length and the number of trees in the forest is ad-
justable. To classify an instance of unknown class
label, each tree casts a unit classification vote. The
forest selects the classification having the most votes
over all the trees in the forest. Compared with the de-
cision tree classifier, random forests have better clas-
sification accuracy, are more tolerant to noise and
are less dependent on the training datasets (Breiman,
2001).
2 METHODS
2.1 Data Sets
A positive data set was formed with 107 experimen-
tally confirmed NES sequences, including those con-
tained in the NES database already available (La-Cour
et al., 2003) together with sequences from Arabidop-
sis, which have been experimentally confirmed (T.
Merkle, unpublished). The length of the sequences
used as positive NESs was defined by taking as a ref-
erence the last hydrophobic amino acid within the
NES relative to the C-terminal of each protein se-
quence, and counting 10 amino acids towards the N-
terminal and 4 towards the C-terminal, which makes a
total length of 15 amino acids. The amino acid taken
as reference has been shown to be necessary and criti-
cal for the interaction of the NES with the Exportin re-
ceptor (G
¨
orlich and Kutay, 1999; Haasen et al., 1999;
Ossareh-Nazari et al., 2001).
On the other hand, a negative data set with 150
sequences was obtained with protein regions without
nuclear export activity. It was done by excluding from
the proteins used in the positive data set, those amino
acid regions for which some evidence for nuclear ex-
port activity was available. Around 10000 sequences
of 15 amino acids length were considered from which
some subsets were randomly selected.
2.2 Feature Calculation
This study assessed two kinds of properties: amino
acid sequence and physicochemical properties.
The possibility of using amino acid residue or-
der as one of the elements of the feature vector was
explored by constructing a distance matrix to reveal
the similarity among all the sequences. The pair-
wise alignment score obtained by comparing each se-
quence to each other with the program ALIGN (My-
ers and Miller, 1988) was used as similarity measure.
To express the sequence feature in a numerical way,
a profile HMM was built with HMMER ver 2.3.2
3
using the NESs sequences from Arabidopsis intend-
ing to capture specific features from plant sequences.
The profile was constructed using a multiple sequence
alignment obtained with CLUSTALW (Chenna et al.,
2003) and QALIGN (Sammeth et al., 2003).
Since the physicochemical properties of the amino
acid residues are the most important feature for bio-
chemical reactions, the amino acid index values were
used to extract additional features that are indepen-
dent of the amino acid order in the sequence. An
amino acid index (aaindex) is a set of 20 numeri-
cal values representing any of the different physico-
chemical and biochemical properties of each amino
acid residue. Many of the published index values
are collected in the AAindex database (Kawashima
and Kanehisa, 2000)
4
. There are 544 attributes in
the AAindex1 database Version 9.1, therefore one can
calculate such a number of features. The aaindex val-
ues for each sequence were calculated by the sum of
the respective index values of the amino acid residues
present in the sequence, as follows:
Each aaindex is represented as:
AA
j
= (AA
j1
,...,AA
j20
), where j, corresponds to each
aaindex value and varies from 1 to 544.
For each sequence (s) of length (l) amino acid
residues (a) represented as: s = a
1
,...a
l
, the value of
the corresponding aaindex value x
s, j
is obtained by
adding the individual aaindex value of each amino
3
http://hmmer.janelia.org/
4
http://www.genome.ad.jp/dbget/aaindex.html
UsingaRandomForestClassifiertoFindNuclearExportSignalsinProteinsofArabidopsisthaliana
99

acid: x
s, j
=
∑
l
k=1
AA
j
(a
k
).
Finally, the profile HMM score (h
s
) of a sequence
s (see above) is appended to the aaindex values to
conform the final feature vector for each sequence:
~x
s,545
= hmm
s
.
Aaindex features, like described above, have been
used in other proteomics contexts as well to encode
molecular features for instance to predict mass spec-
trometry signals (Timm et al., 2008).
2.3 Pre-processing and Training
Resampling was carried out by using at first the hold-
out or splitting method (with p = 0.25: 75% of the
data for a training set and the remaining 25% for a
test set ) in the complete data set. After that, classical
resampling methods (10-fold CV and LOOCV ) were
applied only to the training set. After the training, the
corresponding test set was used to evaluate the perfor-
mance of the classifiers.
The feature set was reduced significantly using
unsupervised filtering to remove highly correlated
features. After recursive feature elimination the re-
maining 25 features were centered and scaled. The
pre-processing was carried out only in the training set
and afterwards applied to the test set in the predic-
tion phase. Three learning algorithms were trained,
namely random forests (RF), k-Nearest Neighbour (k-
NN) and Support Vector Machine (SMV). Both pre-
processing and training were carried out by using the
caret (classification and regression training) package
(Kuhn, 2008b; Kuhn, 2008a) under the statistical plat-
form R (Ihaka and Gentleman, 1996; R Development
Core Team, 2005).
2.4 Performance Evaluation Criteria
Based on the class predicted by the trained classifiers
for every element of the test set and its actual class, a
classical two-by-two confusion matrix or contingency
table was used as reference to calculate some perfor-
mance metrics (Baldi et al., 2000) (Accuracy (ACC),
True positive rate (TPR), False positive rate (FPR),
Specificity and Precision).
With the trained classifiers, it is possible to pro-
duce a continuous output (directly or by transforma-
tion of a discrete output). It means that the out-
come of the classifier is an estimated confidence
value. Thus, depending on the confidence thresh-
old value applied, the results of the confusion matrix
can change which implies that some of the perfor-
mance measurements described before are valid only
at a particular probability threshold value. To assess
the performance of the trained classifiers in a broad
range of probability threshold values, receiver operat-
ing characteristic (ROC) curves were used. A ROC
is a two-dimensional graph where the proportion of
correctly classified positive samples i.e., true positive
rate (TPR) is plotted as a function of the proportion
of incorrectly classified negative instances i.e., false
positive rate (FPR). Each point on the ROC curve rep-
resents a classification threshold (θ ∈ [0, 1]) and cor-
responds to particular values of TPR and FPR. Vary-
ing the threshold gives a tradeoff between TPR and
FPR. The construction of ROCs allows to calculate an
additional measure called area under the ROC curve
(AUC). This value has an important statistical prop-
erty: the AUC of a classifier is equivalent to the prob-
ability that the classifier will rank a randomly chosen
positive sample higher than a randomly chosen nega-
tive sample (Fawcett, 2004). The range of AUC val-
ues is [0, 1]: 1 represents the perfect classification and
0.5 a quite random one. In this study the ROCs were
constructed in R using the package rocr (Sing et al.,
2005) and the AUC value was calculated using the
function aucRoc from the caret package.
2.5 Pipeline Construction
To deploy the final classifier for prediction of NES
in new protein sequences, it was necessary to process
the new sequences in the same way as the training and
test sequences. For this, the classifier was integrated
into a pipeline, which was implemented using PERL
and R. For the prediction of NESs, each protein is
initially split into overlapping fragments of 15 amino
acids length. Then the full set of features is calculated
for each fragment. Next, the resulting feature matrix
is passed to the actual classifier and after the classi-
fication process, the original sequence is reassembled
with probability values for the two classes (NES and
nonNES) assigned to each amino acid residue. The
output of the pipeline is a list of the proteins con-
taining NES(s) with the position where the possible
signal is located in the sequence. This output can be
modulated by changing the probability value used as
threshold for the class assignation.
2.6 Prediction of NESs in New Protein
Sequences and Experimental
Verification
A data set containing 33410 protein sequences, ob-
tained from the Arabidopsis Information Resource
website (TAIR)
5
was used as target for the prediction.
Since one requirement for a protein to be exported
5
http://wwww.arabidopsis.org - release TAIR9
BIOINFORMATICS2013-InternationalConferenceonBioinformaticsModels,MethodsandAlgorithms
100
from the nucleus is its interaction with the nuclear ex-
port receptor Exportin 1, a group of 24 proteins was
selected out of the total predicted to be experimen-
tally tested for the presence of an actual NES. Selec-
tion of proteins to be assessed was carried out using
Gene Ontologies (GO) (The Gene Ontology Consor-
tium, 2000) and some experimental constraints of the
Yeast-two-Hybrid (YTH) plasmid vectors used (Clon-
tech Matchmaker LexA system). The GO terms used
were taken from the categories Biological Process and
Molecular Function, focusing on those related with
transcription and/or nucleic acid metabolism. For
YTH, the respective cDNA from the protein to be
tested was amplified by PCR using specifically de-
signed oligonucleotides. The amplified fragments
were cloned in the vector pB42AD and confirmed
by sequencing. The pB42AD plasmids containing
the cDNAs investigated, together with pGilda plasmid
containing the cDNA of Arabidopsis XPO1a (Haasen
et al., 1999) were used in the final interaction assays.
3 RESULTS AND DISCUSSION
3.1 Preliminary Analysis
One of the most important points when developing
a classification tool is to look for properties that al-
low the separation between the classes. Intuitively,
the first property in this case could be the order and
identity of the amino acid residues in each class (NES
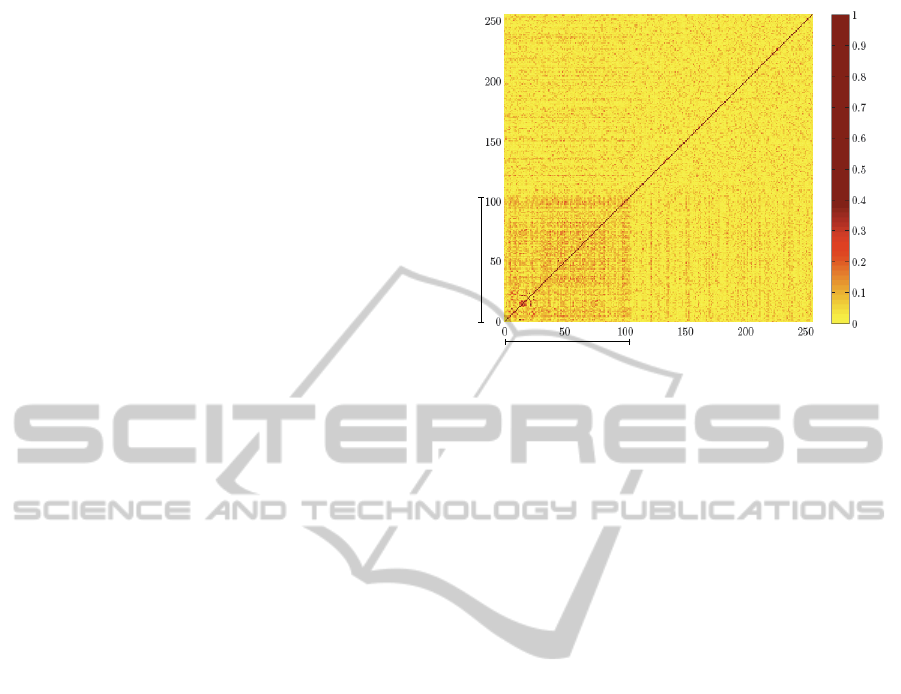
and nonNES sequences). Fig. 1 shows a comparison
all against all of NES and nonNES sequences where
the presence of a darker zone in contrast to the rest
of the matrix is clearly visible. This area corresponds
to the region where NES sequences are compared to
other NES sequences. It means that an NES sequence
is more similar to another that is also NES than to an-
other that is nonNES. Therefore, the identity and or-
der of the amino acid residues in the sequences could
be used as one of the features to separate the two
classes.
3.2 Assessment and Selection of the
Optimal Classifier
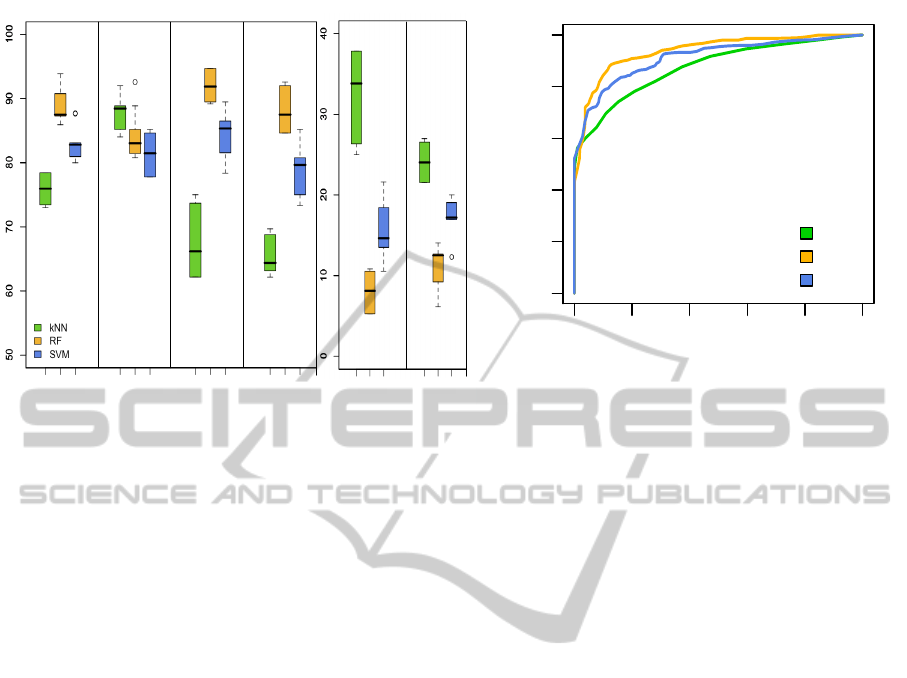
Fig. 2A presents the results of the performance met-
rics evaluated for the trained classifiers. Regarding
the sensitivity value, the k-NN classifier had a small
advantage over the other two. Nevertheless, this clas-
sifier was the least specific and least precise, and
showed also in correspondence the highest values for
false positive rate and classification error. RF was
NES nonNES
NES nonNES
Figure 1: Matrix showing the similarity between the amino
acid sequences labelled as NES or nonNES. The similarity
score used corresponds to the identity value obtained from
aligning each pair of amino acid sequences with the pro-
gram ALIGN.
comparable to SVM regarding sensitivity, however it
showed slightly higher values in accuracy, specificity
and precision, as well as lower false positive rate and
error than SVM. It is also noticeable that k-NN ex-
hibits a higher degree of dispersion in specificity and
false positive rate, compared to RF and SVM.
The outcome of the classification process can
be seen as class probability values for every classi-
fied sample. Therefore, the performance metrics can
change depending on the cutoff value used. In order
to assess the relation between sensitivity (expressed
as true positive rate (TPR)) and true negative rate
(TNR) across different cutoff values of class probabil-
ities, receiver operating characteristics (ROC) curves
were constructed. The ROCs for the trained classi-
fiers are shown in Fig. 2B, where the indicator area
under the curve (AUC) is also included. According to
the ROCs the three classifiers can predict much bet-
ter than random, which can be seen in the localization
of the curve in the ROC space, in the shape of the
curves and also in the AUC value which is > 0.5 in
all the cases. According to this parameter it seems
that RF performs better than the other two classifiers.
However, this conclusion can not be drawn using only
the ROCs since the class distribution of the samples
(proportion of positive (NES) compared to negative
(nonNES) sequences) is not considered. Hence, for a
direct comparison of the three classifiers in the ROC
space, the ROC convex hull (ROCCH) method, de-
scribed by Provost and Fawcett (Provost and Fawcett,
2001) was used. Two scenarios were considered: first,
when the sample contains same proportion of posi-
tives and negative samples and second, when the sam-
ple has 20% of positive examples and 80% of nega-
UsingaRandomForestClassifiertoFindNuclearExportSignalsinProteinsofArabidopsisthaliana
101
Sensitivity Specificity Precision FPR Error Accuracy
A
Average false positive rate
Average true positive rate
0.0 0.2 0.4 0.6 0.8 1.0
0.0 0.2 0.4 0.6 0.8 1.0
0 0.2 0.4 0.6 0.8 1
kNN
B
Average false positive rate
Average true positive rate
0.0 0.2 0.4 0.6 0.8 1.0
0.0 0.2 0.4 0.6 0.8 1.0
0 0.2 0.4 0.6 0.8 1
RF
C
Average false positive rate
Average true positive rate
0.0 0.2 0.4 0.6 0.8 1.0
0.0 0.2 0.4 0.6 0.8 1.0
0 0.2 0.4 0.6 0.8 1
SVM
D
Average false positive rate
Average true positive rate
0.0 0.2 0.4 0.6 0.8 1.0
0.0 0.2 0.4 0.6 0.8 1.0
kNN
RF
SVM
AUC
0.860
0.938
0.913
A. B.
Figure 2: Evaluation of the trained classifiers. A: Boxplot graph showing the results for the performance metrics (in percent-
age) used to evaluate the classifiers. The whiskers extend from -1.5 to +1.5 of interquartile range (IQR), the dark horizontal
line inside each box indicates the median of the sample (50
th
percentile) and the limits of the box represent the lower and
upper quartiles (25
th
and 75
th
percentiles) respectively. The outliers, if any, are represented as individual circles outside the
whiskers. B:Receiver operating characteristics (ROC) curves for the three classifiers. Both figures were obtained with average
values using the combination of the hold-out and LOOCV resampling methods described in text.
tive ones. According to this approach, RF would be
the best classifier under the two circumstances con-
sidered (results not shown due to space constraints).
Considering the results of the performance measure-
ments and ROC curves, RF was selected as the best
method to classify NESs and was used to predict them
in new protein sequences.
One of the intended uses of this classifier was to
predict NES-containing proteins in the whole avail-
able sequences of Arabidopsis. For such an applica-
tion it is desirable to minimize the number of false
positives even if some true positives are missed. One
way to achieve that is by adjusting the probability cut-
off value that the classifier uses to assign the class la-
bel to new samples. It was seen that probability cutoff
values higher than 0.5 can give a better specificity at
the cost of some decrease in accuracy and sensitivity.
Consequently, for the screening of the whole avail-
able protein sequences of Arabidopsis using the RF
classifier, a cutoff value of 0.7 was selected as a trade-
off between gaining in specificity without loosing too
much in sensitivity.
3.3 Classification of New Samples and
Experimental Verification
From the set of 33410 protein sequences used as tar-
get for the prediction, 5156 sequences corresponding
to individual loci were predicted as NES-containing
proteins. From this set of predictions, 24 proteins
were selected as described before and finally 13 of
them were cloned and experimentally tested for inter-
action with the receptor XPO1a of Arabidopsis. The
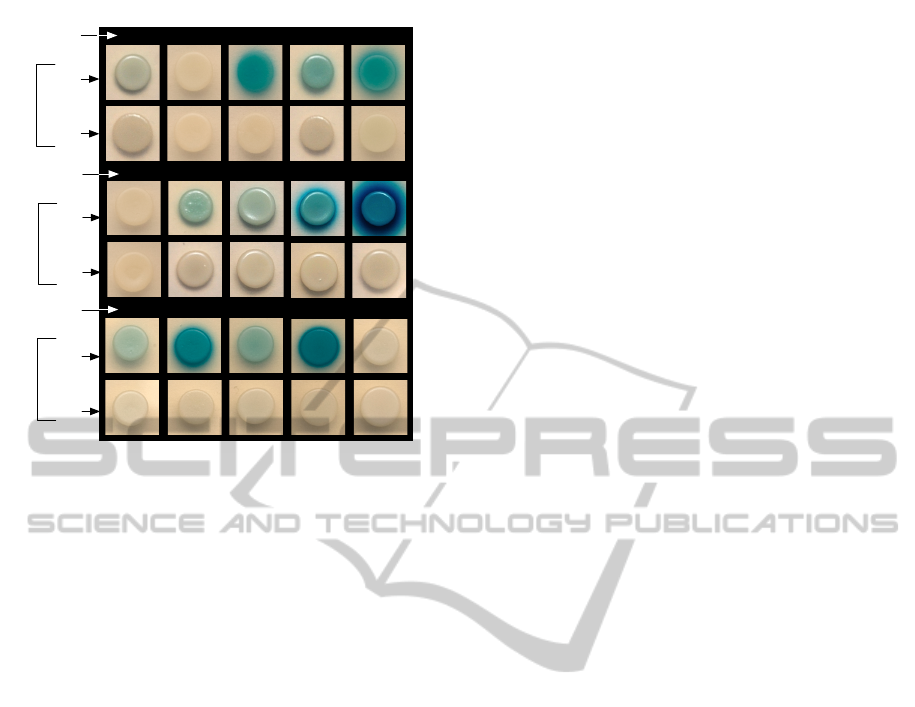
outcome from the YTH assays for these 13 proteins
is shown in Fig 3. A positive result in this assay can
be taken as an indicator that the tested protein has a
functional NES since such a protein interacts with the
nuclear export receptor XPO1a. That was the case for
11 out of the 13 tested proteins.
4 CONCLUSIONS
The foremost contribution of this work was the devel-
opment of an accurate tool for predicting NESs in pro-
teins of Arabidopsis based on a random forest classi-
fier. This conclusion is based on two facts. First, the
high values obtained in the performance metrics, cor-
relation measures and ROCs used as evaluation crite-
ria. Second, the experimental verification of the nu-
clear export activity in a selected group from the to-
tal of predicted proteins that confirmed that the devel-
oped tool is accurate for the intended use: the detec-
tion of NESs in proteins of Arabidopsis.
An important characteristic of the developed tool
is that the random forest classifier was integrated into
a pipeline where it is possible to adapt the probabil-
ity threshold value according to the intended applica-
BIOINFORMATICS2013-InternationalConferenceonBioinformaticsModels,MethodsandAlgorithms
102
4 1 2 3 5
7 8
6
9 10
Vector 1
Xpo1a
Empty
Vector 2
Vector 1
Xpo1a
Empty
Vector 2
Vector 1
Xpo1a
Empty
Vector 2
11 12 13
Ctrl +
Ctrl -
Figure 3: Receptor binding activity for selected proteins.
Yeast two-hybrid assays for 13 proteins selected from the
total of predicted as containing NESs. The respective
cDNA fragments amplified by PCR were ligated into the
vector pB42AD (Vector 1) and tested in the yeast strain
EGY48[p8op-LacZ] for interaction with Arabidopsis nu-
clear export receptor XPO1a. Blue/green color indicates a
positive interaction between the protein tested and the re-
ceptor.
tion making possible to modify the trade-off between
specificity and sensitivity. For example, to screen a
big set of protein sequences, could be advisable to use
an astringent threshold value since specificity would
be more important than sensitivity. However, if the
aim is to look for the possible position of an NES in
a protein with known or suspected nuclear export ac-
tivity, it would be better to low the threshold value to
gain more sensitivity.
From a biological perspective, the prediction of
around 5000 proteins that possibly contain NESs im-
plies that approximately 18% of the total of proteins
of Arabidopsis could have an NES, which is an indi-
cator of the high potential of the nucleo-cytoplasmic
partitioning as a regulation mechanism in Arabidop-
sis.
The results of this work raise new challenges for
further investigation. The nuclear export activity de-
tected in the proteins tested calls to be determined and
characterized in planta. Additionally, the experimen-
tal localization of the NESs is necessary to determine
if they are in accordance with the predicted positions.
On the other hand, in the total set of proteins predicted
as NES-containing there are still many waiting to be
tested. As soon as more proteins are experimentally
verified, the classifier could be re-trained using the
new data to improve the performance even more.
The developed prediction tool was directed to Ara-
bidopsis proteins, however the extension to other
plants or related organisms is thinkable. To facilitate
that, it would be desirable to extend the usability of
the tool. Since currently the prediction tool is avail-
able for individual use only, one of the perspectives
for the near future is to make it available as a web
application with both a graphical interface and an ap-
plication server interface.
ACKNOWLEDGEMENTS
Thanks to the Bioinformatics Resource Facility
(BRF) of the Bielefeld University for the technical co-
operation.
REFERENCES
Baldi, P., Brunak, S., Chauvin, Y., Andersen, C. A., and
Nielsen, H. (2000). Assessing the accuracy of predic-
tion algorithms for classification: an overview. Bioin-
formatics, 16(5):412–24.
Bendtsen, J. D., Nielsen, H., von Heijne, G., and Brunak, S.
(2004). Improved prediction of signal peptides: Sig-
nalP 3.0. J Mol Biol, 340(4):783–95.
Bock, J. R. and Gough, D. A. (2001). Predicting protein–
protein interactions from primary structure. Bioinfor-
matics, 17(5):455–60.
Brameier, M., Krings, A., and MacCallum, R. M. (2007).
NucPred–predicting nuclear localization of proteins.
Bioinformatics, 23(9):1159–60.
Breiman, L. (2001). Random Forests. Machine Learning,
45(5-32):1–28.
Caragea, C., Sinapov, J., Silvescu, A., Dobbs, D., and
Honavar, V. (2007). Glycosylation site prediction us-
ing ensembles of Support Vector Machine classifiers.
BMC Bioinformatics, 8:438.
Chenna, R., Sugawara, H., Koike, T., Lopez, R., Gibson,
T., Higgins, D., and Thompson, J. (2003). Multiple
sequence alignment with the CLUSTAL series of pro-
grams. Nucleic Acids Res, 31:3497–3500.
Cook, A., Bono, F., Jinek, M., and Conti, E. (2007). Struc-
tural biology of nucleocytoplasmic transport. Annu
Rev Biochem, 76:647–71.
Fawcett, T. (2004). ROC graphs : Notes and practical con-
siderations for researchers. Technical report, HP Lab-
oratories, MS 1143, 1501 Page Mill Road, Palo Alto
CA 94304.
G
¨
orlich, D. and Kutay, U. (1999). Transport between the
cell nucleus and the cytoplasm. Annu Rev Cell Dev
Biol, 15:607–60.
Gromiha, M. M. and Yabuki, Y. (2008). Functional discrim-
ination of membrane proteins using machine learning
techniques. BMC Bioinformatics, 9:135.
UsingaRandomForestClassifiertoFindNuclearExportSignalsinProteinsofArabidopsisthaliana
103

Haasen, D., K
¨
ohler, C., Neuhaus, G., and Merkle, T. (1999).
Nuclear export of proteins in plants: AtXPO1 is the
export receptor for leucine-rich nuclear export signals
in Arabidopsis thaliana. Plant J, 20(6):695–705.
Hua, S. and Sun, Z. (2001). Support Vector Machine ap-
proach for protein subcellular localization prediction.
Bioinformatics, 17:721–728.
Ihaka, R. and Gentleman, R. (1996). R: a language for data
analysis and graphics. Journal of computational and
graphical statistics.
Kawashima, S. and Kanehisa, M. (2000). AAindex: amino
acid index database. Nucleic Acids Res, 28:374.
Kuhn, M. (2008a). Building predictive models in R using
the caret package. JSS Journal of Statistical Software,
28(5):1–26.
Kuhn, M. (2008b). Documentation for package caret ver-
sion 3.45. [http://caret.r-forge.r-project.org/].
Kumar, M. and Raghava, G. P. S. (2009). Prediction of
nuclear proteins using SVM and HMM models. BMC
Bioinformatics, 10:22.
La-Cour, T., Gupta, R., Rapacki, K., Skriver, K., Poulsen,
F.-M., and Brunak, S. (2003). NESbase version 1.0: a
database of nuclear export signals. Nucleic Acids Res,
31(1):393–6.
La-Cour, T., Kiemer, L., Mølgaard, A., Gupta, R., Skriver,
K., and Brunak, S. (2004). Analysis and prediction of
leucine-rich nuclear export signals. Protein Eng Des
Sel, 17(6):527–36.
Lee, B. J., Shin, M. S., Oh, Y. J., Oh, H. S., and Ryu,
K. H. (2009). Identification of protein functions us-
ing a machine-learning approach based on sequence-
derived properties. Proteome science, 7:27.
Lei, Z. and Dai, Y. (2005). An SVM-based system for pre-
dicting protein subnuclear localizations. BMC Bioin-
formatics, 6:291.
Liu, B., Wang, X., Lin, L., Tang, B., Dong, Q., and Wang,
X. (2009). Prediction of protein binding sites in pro-
tein structures using hidden Markov support vector
machine. BMC Bioinformatics, 10:381.
Merkle, T. (2001). Nuclear import and export of proteins in
plants: a tool for the regulation of signalling. Planta,
213:499–517.
Merkle, T. (2004). Nucleo-cytoplasmic partitioning of pro-
teins in plants: implications for the regulation of envi-
ronmental and developmental signalling. Curr Genet,
44:231–260.
Merkle, T. (2011). Nucleo-cytoplasmic transport of proteins
and rna in plants. Plant Cell Rep, 30:153–176.
Myers, E. W. and Miller, W. (1988). Optimal alignments in
linear space. Comput Appl Biosci, 4(1):11–17.
Ossareh-Nazari, B., Gwizdek, C., and Dargemont, C.
(2001). Protein export from the nucleus. Traffic,
2(10):684–9.
Pazos, F. and jung Wook Bang (2006). Computational pre-
diction of functionally important regions in proteins.
Current Bioinformatics, 1(1):15–23.
Pemberton, L.-F. and Paschal, B.-M. (2005). Mechanisms
of receptor-mediated nuclear import and nuclear ex-
port. Traffic, 6(3):187–198.
Provost, F. and Fawcett, T. (2001). Robust classification for
imprecise environments. Machine Learning, 42:203–
231.
R Development Core Team (2005). R: A language and
environment for statistical computing. R Foundation
for Statistical Computing, Vienna, Austria. ISBN 3-
900051-07-0.
Riis, S. and Krogh, A. (1996). Improving prediction of pro-
tein secondary structure using structured neural net-
works and multiple sequence alignments. J Comput
Biol, 3:163–183.
Sammeth, M., Rothg
¨
anger, J., Esser, W., Albert, J., Stoye,
J., and Harmsen, D. (2003). QAlign: quality-based
multiple alignments with dynamic phylogenetic anal-
ysis. Bioinformatics, 19(12):1592–1593.
Sing, T., Sander, O., Beerenwinkel, N., and Lengauer, T.
(2005). ROCR: visualizing classifier performance in
R. Bioinformatics, 21(20):3940.
Str
¨
om, A. C. and Weis, K. (2001). Importin-beta-
like nuclear transport receptors. Genome Biol,
2(6):Reviews–3008.
The Gene Ontology Consortium (2000). Gene Ontol-
ogy: tool for the unification of biology. Nat Genet,
25(1):25–29.
Timm, W., Scherbart, A., B
¨
ocker, S., Kohlbacher, O., and
Nattkemper, T. W. (2008). Peak intensity prediction
in maldi-tof mass spectrometry: a machine learning
study to support quantitative proteomics. BMC Bioin-
formatics, 9:443.
Tung, C.-W. and Ho, S.-Y. (2008). Computational identifi-
cation of ubiquitylation sites from protein sequences.
BMC Bioinformatics, 9:310.
BIOINFORMATICS2013-InternationalConferenceonBioinformaticsModels,MethodsandAlgorithms
104
