
Evolution of Bacterial Genome under Changing Mutational Pressure
Computer Simulation Studies
Paweł Bła
˙
zej, Paweł Mackiewicz, Małgorzata Wa
´
nczyk and Stanisław Cebrat
Department of Genomics, Faculty of Biotechnology, University of Wrocław, ul. Przybyszewskiego 63/77, Wrocław, Poland
Keywords:
DNA Asymmetry, Genome Rearrangements, Monte Carlo Simulation, Mutational Pressure.
Abstract:
The main force shaping the structure of bacterial chromosomes is the replication-associated mutational pres-
sure which is characterized by distinct nucleotide substitution patterns acting on differently replicated DNA
strands (leading and lagging). Therefore, the composition of DNA strands is asymmetric and it is important
at which strand a gene is located and into which strand it could be translocated. Thus, the mutational pressure
restricts also intragenomic translocations. To analyze this effect, we have elaborated a simulation model of
bacterial genome evolution assuming translocation of protein coding genes and different types of selection act-
ing on their sequences. The ’negative’ selection eliminated individuals if the coding signal of any gene in its
genome dropped below the acceptable range, whereas the ’stabilizing’ selection did not allow for the decrease
in the coding signal of any gene below its original value. Under the ’negative’ selection more genes stayed
or were translocated to the lagging strand, whereas under the ’stabilizing’ selection more genes preferred the
leading strand. The ’stabilizing’ selection eliminated more individuals because of the coding signal loss and
slightly fewer because of the stop codon generation. The ’stabilizing’ selection allowed also for much less
gene translocations between strands than the ’negative’ selection.
1 INTRODUCTION
The conserved position of genes on bacterial chro-
mosomes is observed only between closely related
species or strains and it disappears very quickly dur-
ing divergence of the bacterial genomes (Mushegian
and Koonin, 1996; Watanabe et al., 1997; Bellgard
et al., 1999; Itoh et al., 1999; Hughes, 2000; Rocha,
2006). The main force shaping the structure of bac-
terial chromosomes is the mutational pressure associ-
ated with DNA replication. Since the mechanisms of
DNA synthesis are different for leading and lagging
strands, the probabilities of specific nucleotide substi-
tutions are different for those strands (Frank and Lo-
bry, 1999; Kowalczuk et al., 001a; Kowalczuk et al.,
001b; Rocha and Danchin, 2001; Rocha et al., 2006).
The direct result of this phenomenon is compositional
bias between the differently replicated DNA strands,
which is called DNA asymmetry. (Lobry, 1996; Grig-
oriev, 1998; McLean et al., 1998; Mrazek and Karlin,
1998; Mackiewicz et al., 1999; Tillier and Collins,
000a; Lobry and Sueoka, 2002).
The genome rearrangements and genes transloca-
tions are strongly related to the asymmetric structure
of bacterial chromosomes (Achaz et al., 2003; Mack-
iewicz et al., 2003). The large inversions observed in
closely related bacterial genomes are symmetrical in
relation to the origin of replication as a result of
higher frequency of recombination events at the repli-
cation forks and/or selection for the maintenance of:
(i) highly expressed genes near the replication ori-
gin in the proper copy number, (ii) the same length
of two replichores and (iii) position of genes on the
same type of DNA strand subjected to the stable muta-
tional pressure (Eisen et al., 2000; Tillier and Collins,
000b; Mackiewicz et al., 001a). However, compar-
isons of more distantly related genomes revealed that
the number of orthologs which changed DNA strand
increases quickly with the phylogenetic distance leav-
ing only a small fraction of highly conserved genes
for ribosomal proteins on the leading strand in ana-
lyzed genomes (Mackiewicz et al., 2003). It proba-
bly results from selection for location of genes essen-
tial for cell functioning in the leading strand (Rocha
and Danchin, 003a; Rocha and Danchin, 003b). Such
requirements may also explain the observed higher
frequency of gene translocations from the lagging to
the leading strand rather than in the opposite direc-
tion (Mackiewicz et al., 001b). The last observation
should result in a very strong bias in coding capacity
of the two DNA strands. To keep the coding capac-
ity of DNA strands more balanced, the other selection
272
Bła
˙
zej P., Mackiewicz P., Wa
´
nczyk M. and Cebrat S..
Evolution of Bacterial Genome under Changing Mutational Pressure - Computer Simulation Studies.
DOI: 10.5220/0004192802720277
In Proceedings of the International Conference on Bioinformatics Models, Methods and Algorithms (BIOINFORMATICS-2013), pages 272-277
ISBN: 978-989-8565-35-8
Copyright
c
2013 SCITEPRESS (Science and Technology Publications, Lda.)

force should be expected. It could be the different se-
lection pressure for gene surviving under the different
mutational pressure.
The translocation of genes between differently
replicated DNA strands and the influence of chang-
ing mutational pressure associated with replication
on such genes was studied in computer simulations
(Mackiewicz et al., 2004; Dudkiewicz et al., 2005;
Mackiewicz and Cebrat, 2009). They showed that
the most advantageous strategy for the majority of
genes is to switch their position between the DNA
strands from time to time. The translocation involves
a change in the direction of the mutational pressure,
which introduces intragenic suppression mutations
complementing the former ones which occurred in
the same gene. Those previous simulations used the
amino acid composition of particular gene products as
selection parameter. In the approach presented here,
we applied selection at the nucleotide level according
to the algorithm for prediction of protein coding se-
quences (Bła
˙
zej et al., 2010; Bła
˙
zej et al., 2011).
2 METHODS
In computer simulations, we applied the modified
model of prokaryotic genome evolution proposed in
(Bła
˙
zej et al., 2012). We considered the popula-
tion of 72 individuals. Such number was optimal
for the simulation program to perform computer cal-
culations. Each individual (genome) were repre-
sented by 475 protein coding sequences of Borrelia
burgdorferi genome, which is characterized by very
strong asymmetry in DNA composition. The gene se-
quences were downloaded from the NCBI database
(www.ncbi.nlm.nih.gov). This set of genes was di-
vided into subsets: 333 genes located on the leading
strand and 142 genes located on the lagging strand.
Nucleotides from the gene sequences were chosen
for mutation according to the Poisson process assum-
ing one mutation per genome. Then the nucleotide
was substituted by another one with probability in the
mutational matrices for the leading or lagging strands
(Tab. 1) accordingly to the current location of the
gene. However, in contrast to (Bła
˙
zej et al., 2012), we
also applied translocation of genes to the other DNA
strand with the probability 10
−3
, which is close to the
rearrangement rate per generation expected in bacte-
ria without selection (Rocha, 2006). In the next step
of simulation, such gene was subjected to the substitu-
tion matrix from this new strand. For comparison, we
also carried out simulations without translocations.
After the mutation stage, genes were eliminated
if they obtained a stop codon or their coding signal
Table 1: The substitution matrix describing mutational pres-
sure acting on the leading DNA strand for the B. burgdorferi
genome (Kowalczuk et al., 001b). A nucleotide in the first
column is substituted by a nucleotide in the first row. Be-
cause of strands’ complementarity, the substitution from the
lagging strand is complementary to the corresponding one
from the leading strand. For example, the lagging strand
substitution from C to T corresponds to the substitution
from G to A from the leading strand.
A T G C
A 0.81 0.10 0.07 0.02
T 0.07 0.87 0.03 0.03
G 0.16 0.12 0.71 0.01
C 0.07 0.26 0.05 0.62
was destroyed according to the algorithm for predic-
tion of protein coding sequences (Bła
˙
zej et al., 2010;
Bła
˙
zej et al., 2011). This algorithm calculates av-
erage coding signal uses three independent homoge-
neous Markov chains to describe occurrence of nu-
cleotides for each of three codon positions in a given
DNA sequence, separately. However, unlike (Bła
˙
zej
et al., 2012) we applied separate selection pressures
for genes according to their location on the leading or
lagging strands. Genes from the given DNA strand
were checked with the appropriate gene recognition
model based on the learning sets of protein coding
genes from the suitable strand.
We considered two types of selection of individu-
als according to the coding signal. An individual was
eliminated when at least one of its mutated gene se-
quences accumulated so many mutations that its cod-
ing signal became lower than: (i) the coding signal
from an alternative reading frame (’negative’ selec-
tion), or (ii) the original value at the beginning of the
simulation (’stabilizing’ selection). Simulations were
run over 10 million Monte Carlo steps (MCS).
3 RESULTS AND DISCUSSION
3.1 Coding Signal for Different Gene
Sets and Models
In Fig. 1, we compared the average coding sig-
nal calculated separately for the leading and lagging
strand genes based on two gene recognition models
trained on: (i) genes from the DNA strand on which
the analyzed genes are located (right model) and (ii)
genes from the opposite strand (wrong model). The
maximum of the coding signal for alternative read-
ing frames of the analyzed genes was also shown for
comparison. As expected, the application of the right
model for every gene set gives the higher coding sig-
EvolutionofBacterialGenomeunderChangingMutationalPressure-ComputerSimulationStudies
273
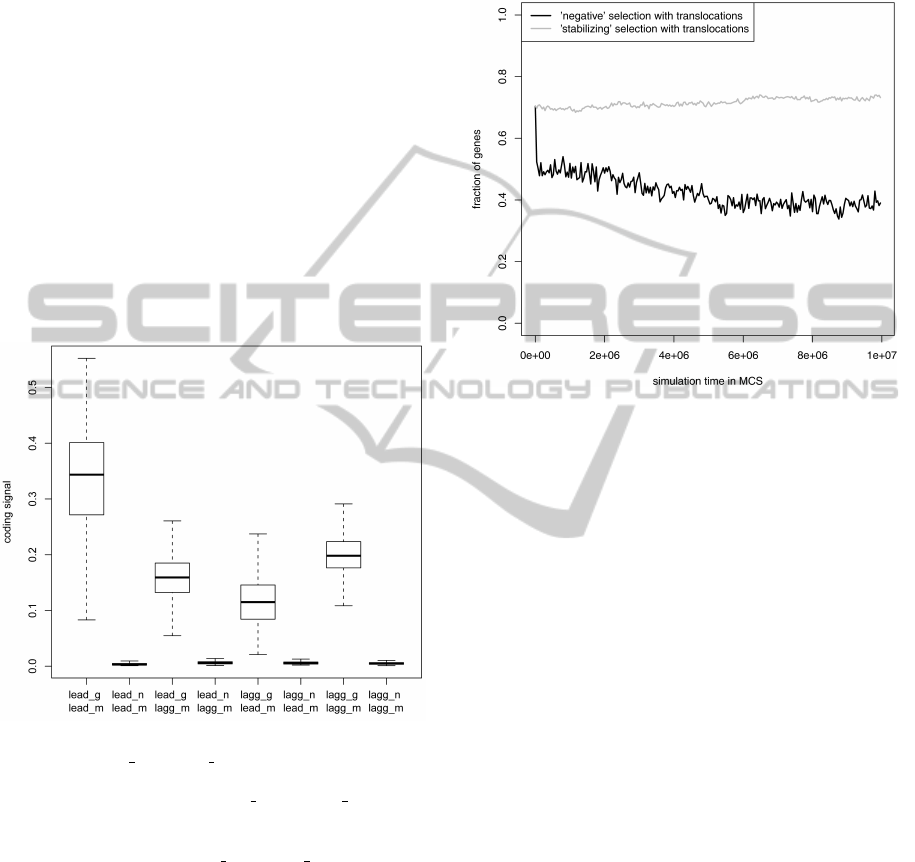
nal than in the case of the wrong model. However, the
difference is smallest for the lagging strand genes than
for the leading strand genes although the coding sig-
nal for the leading strand genes with the right model
shows the widest range and overlaps with the range of
the wrong model for the leading strand genes. Gen-
erally, the coding signal of correct reading frames is
much stronger than of the non-coding sequences for
all gene sets and models combinations. The small-
est difference between coding signals of the correct
and incorrect reading frames is if the coding signal of
lagging strand genes is calculated based on the learn-
ing set from the leading strand. It suggests that the
genes from the lagging strand should be more fre-
quently eliminated when they were subjected to the
selection typical of the leading strand genes. How-
ever, these expectation can be also influenced by the
applied mutational and selection pressures acting on
gene sequences.
Figure 1: Average coding signal for the leading and lagging
strand genes (lead g and lagg g, respectively) calculated ac-
cording to the gene recognition model trained on learning
sets from two DNA strands (lead m and lagg m, respec-
tively). Non-coding sequences represented by alternative
reading frames of genes from two DNA strands were also
included for comparison (lead n and lagg n, respectively).
The thick horizontal line in the boxplots indicates median,
the rectangle means quartile range and the whiskers show
the range without outliers.
3.2 Stability of Gene Location on DNA
Strands during Simulation
The simulations were started with 70% of genes com-
ing from the leading strand and 30% of genes from
the lagging strand (like in the real B. burgdorferi
genome). These proportions were almost unchanged
under the ’stabilizing’ selection while they changed
significantly under negative selection and the percent-
age of the genes staying on the leading strand dropped
to about 40% after 10 million MCS of simulation
(Fig. 2).
Figure 2: Fraction of genes occupying the leading strand
during simulation.
To check what kind of translocation led to this
distribution, we studied changes in fraction of genes
from DNA strands separately (Fig. 3 and Fig. 4).
These analyses showed that till 10, 000 MCS, about
the half of genes both from the leading and the lag-
ging strand were translocated to the opposite strand
under the ’negative’ selection. However, during the
simulation under this selection many lagging strand
genes returned to their proper strand reaching at the
end of the simulation about 60% (Fig. 3). In contrast
to that, more of leading strand genes left their own
strand and about 40% occupied the leading strand at
the end of the simulation for the ’negative’ selection
(Fig. 4). Interestingly, the ’stabilizing’ selection was
more conserving for positions of the leading than lag-
ging strand genes because it kept more than 90% of
the genes on the leading strand and about 80% of the
genes on the lagging strand.
This results indicate that for the ’negative’ selec-
tion, it is more advantageous for most of genes from
both DNA strands to stay under mutational and se-
lection pressures characteristic of the lagging strand.
However, for the more conserved ’stabilizing’ selec-
tion, more genes prefer the leading strand conditions
as it is observed in the real genomes (Mackiewicz
et al., 001b; Mackiewicz et al., 2003; Rocha and
Danchin, 003a; Rocha and Danchin, 003b).
BIOINFORMATICS2013-InternationalConferenceonBioinformaticsModels,MethodsandAlgorithms
274
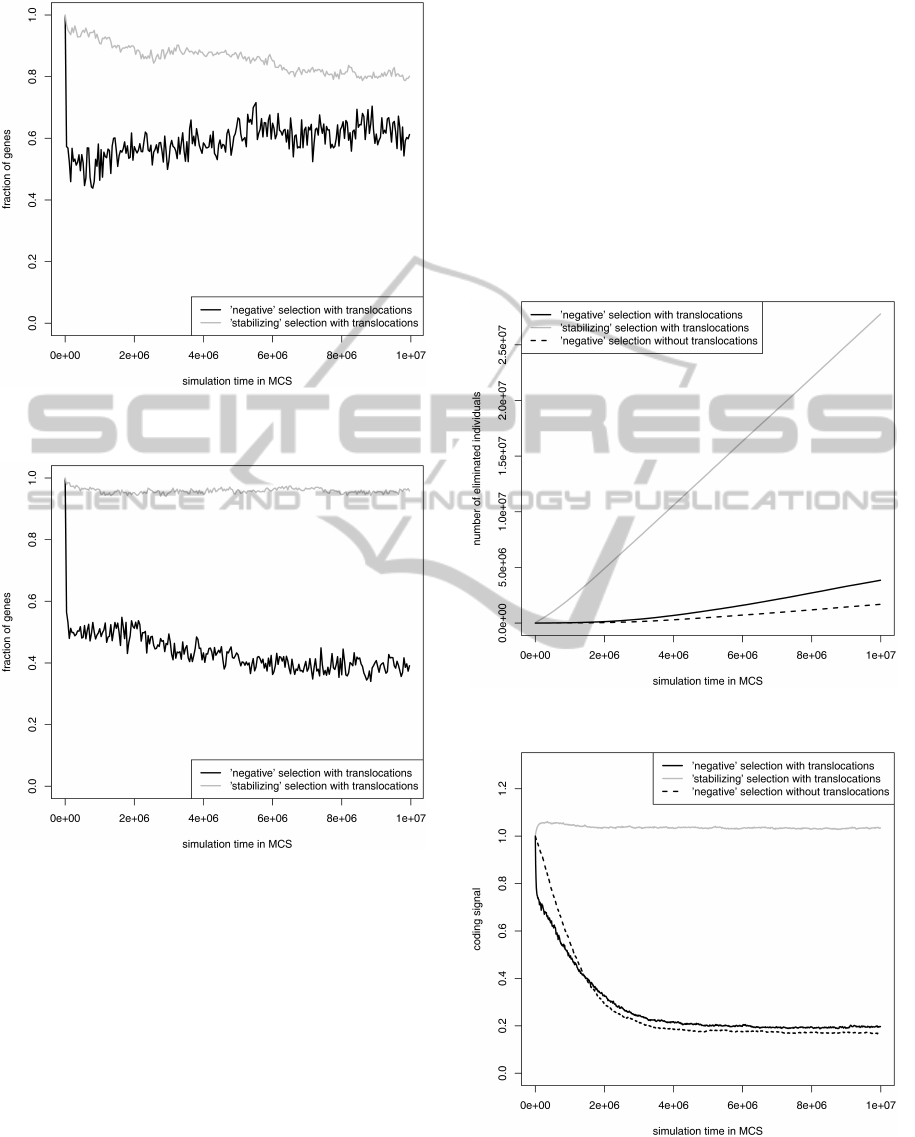
Figure 3: Fraction of lagging strand genes staying on their
own strand during simulation.
Figure 4: Fraction of leading strand genes staying on their
own strand during simulation.
3.3 Comparison of Two Selection Types
and Simulation Models
The used two selection types differ in their restric-
tions. The ’negative’ selection eliminated individu-
als when the coding signal of genes was smaller than
their alternative reading frames, whereas the ’stabiliz-
ing’ selection was more restrictive because a mutated
gene was not allowed to decrease its original coding
signal. Then, the ’stabilizing’ selection eliminated
more genomes than the ’negative’ one for the model
with translocations (Fig. 5). Moreover, the simula-
tion with the latter selection begun with a long de-
lay in which none or very few individuals were elimi-
nated until their gene sequences accumulated enough
number of mutations that decreased their coding sig-
nal. Therefore, the ’stabilizing’ selection was more
restrictive for the maintenance of the coding signal
during the whole simulation, whereas the ’negative’
selection allowed for its decrease (Fig. 6). The model
with gene translocations eliminated more individuals
than the model without them under the ’negative’ se-
lection (Fig. 5). This stronger selection resulted in
a slightly higher average coding signal of survived
genes for the model with translocations when the sim-
ulations reached equilibrium (Fig. 6).
Figure 5: Cumulated number of individuals eliminated be-
cause of the coding signal loss in their genes.
Figure 6: Change of the coding signal of gene sequences
during simulation.
Differences between two types of selections and
simulation models were much weaker when individ-
EvolutionofBacterialGenomeunderChangingMutationalPressure-ComputerSimulationStudies
275
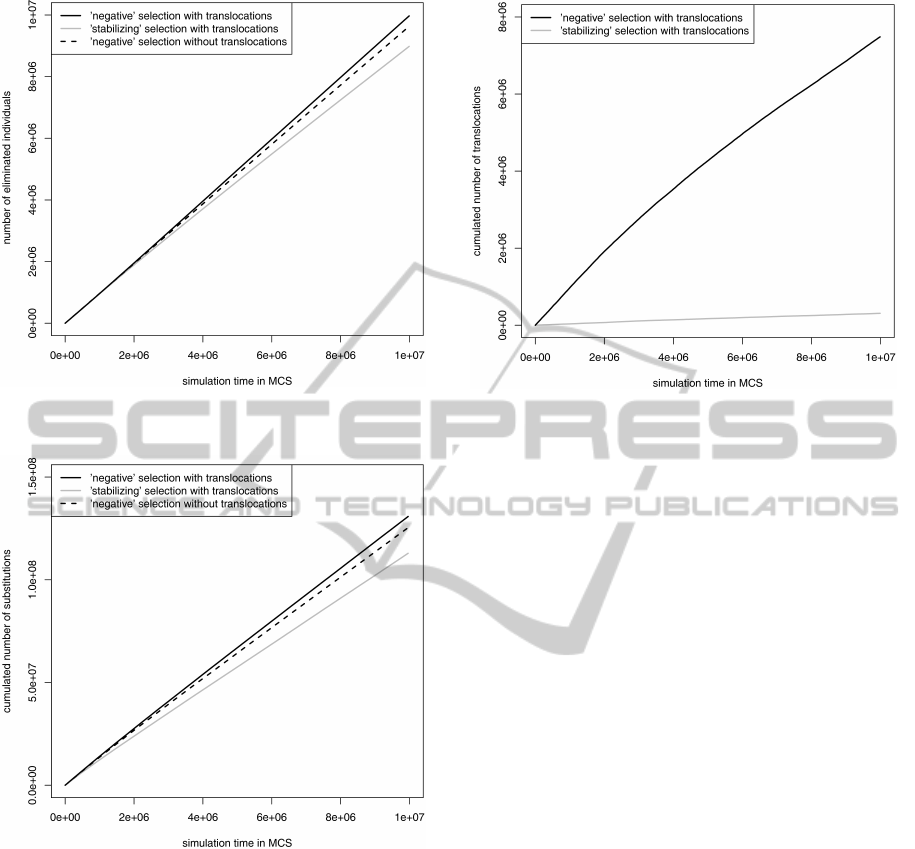
Figure 7: Cumulated number of individuals eliminated be-
cause of the codon stop.
Figure 8: Cumulated number of substitutions accepted in
gene sequences.
uals were eliminated by generation of the stop codon
inside their genes (Fig. 7). Then, the ’stabilizing’ se-
lection turned out less restrictive than the ’negative’
one for the model with translocations. Moreover, the
admission of gene movements between DNA strands
eliminated only slightly more individuals than the
model without translocations (Fig. 7).
Generally, the number of eliminated individuals
by stop codons was much bigger than the number of
individuals eliminated because of the coding signal
loss for models with and without translocations using
the ’negative’ selection (Fig. 5). The opposite was
for the ’stabilizing’ selection model with transloca-
tions. It seems that translocation effect on individual
elimination depends on the applied selection type.
Figure 9: Cumulated number of gene translocation between
differently replicated DNA strands.
The applied selections also differed in the num-
ber of accepted substitutions (Fig. 8) and the number
of translocated genes (Fig. 9). The ’negative’ selec-
tion allowed for only slightly more substitutions but
significantly more gene movements than the ’stabiliz-
ing’ one. The model with translocations caused accu-
mulation of more substitutions than the model with-
out them. It agrees with studies of bacterial genomes
showing higher divergence between homologs lying
on different than the same DNA strands (Rocha and
Danchin, 2001; Mackiewicz et al., 001b; Mackiewicz
et al., 2003). It may result from weaker selection on
translocated genes or higher susceptibility of their se-
quences to the opposite mutational pressure.
The presented simulations were based on Borre-
lia burgdorferi genes but similar results are expected
for other bacteria also showing compositional bias be-
tween differently replicated DNA strands. However,
pure mutational pressures should be found for these
genomes to perform comparative studies.
REFERENCES
Achaz, G., Coissac, E., Netter, P., and Rocha, E. (2003). As-
sociations between inverted repeats and the structural
evolution of bacterial genomes. Genetics, 164:1279–
1289.
Bellgard, M., Itoh, T., Watanabe, H., Imanishi, T., and Go-
jobori, T. (1999). Dynamic evolution of genomes and
the concept of genome space. Ann. N. Y. Acad. Sci.,
870:293–300.
Bła
˙
zej, P., Mackiewicz, P., and Cebrat, S. (2010). Using the
genetic code wisdom for recognizing protein coding
sequences. In Proceedings of the 2010 International
BIOINFORMATICS2013-InternationalConferenceonBioinformaticsModels,MethodsandAlgorithms
276

Conference on Bioinformatics & Computational Biol-
ogy (BIOCOMP 2010), pages 302–305.
Bła
˙
zej, P., Mackiewicz, P., and Cebrat, S. (2011). Algo-
rithm for finding coding signal using homogeneous
markov chains independently for three codon posi-
tions. In Proceedings of the 2011 International Con-
ference on Bioinformatics and Computational Biology
(ICBCB 2011), pages 20–24.
Bła
˙
zej, P., Mackiewicz, P., and Cebrat, S. (2012). Simula-
tion of bacterial genome evolution under replicational
mutational pressures. In Proceedings of 5th Interna-
tional Joint Conference on Biomedical Engineering
Systems and Technologies (BIOSTEC 2012), Interna-
tional Conference on Bioinformatics Models, Methods
and Algorithms (Bioinformatics 2012), pages 51–57.
Dudkiewicz, M., Mackiewicz, P., Mackiewicz, D., Kowal-
czuk, M., Nowicka, A., Polak, N., Smolarczyk, K.,
Kiraga, J., Dudek, M., and Cebrat, S. (2005). Higher
mutation rate helps to rescue genes from the elimina-
tion by selection. Biosystems, 80:192–199.
Eisen, J., Heidelberg, J., White, O., and Salzberg, S.
(2000). Evidence for symmetric chromosomal in-
versions around the replication origin in bacteria.
Genome Biol., 1:11.11–11.19.
Frank, A. and Lobry, J. (1999). Asymmetric substitution
patterns: a review of possible underlying mutational
or selective mechanisms. Gene, 238:65–77.
Grigoriev, A. (1998). Analysing genomes with cumulative
skew diagrams. Nucleic Acids Res., 26:2286–2290.
Hughes, D. (2000). Evaluating genome dynamics: the con-
straints on rearrangements within bacterial genomes.
Genome Biol., 1:REVIEWS0006.
Itoh, T., Takemoto, K., Mori, H., and Gojobori, T. (1999).
Evolutionary instability of operon structures disclosed
by sequence comparisions of complete microbial
genomes. Mol. Biol. Evol., 16:332–346.
Kowalczuk, M., Mackiewicz, P., Mackiewicz, D., Now-
icka, A., Dudkiewicz, M., Dudek, M., and Cebrat, S.
(2001a). DNA asymmetry and the replicational muta-
tional pressure. J. Appl. Genet., 42:553–577.
Kowalczuk, M., Mackiewicz, P., Mackiewicz, D., Now-
icka, A., Dudkiewicz, M., Dudek, M., and Cebrat,
S. (2001b). High correlation between the turnover of
nucleotides under mutational pressure and the DNA
composition. BMC Evol. Biol., 1:13.
Lobry, J. (1996). Asymmetric substitution patterns in the
two DNA strands of bacteria. Mol. Biol. Evol., 13:,
660–665.
Lobry, J. and Sueoka, N. (2002). Asymmetric directional
mutation pressures in bacteria. Genome Biol., 3:58.
Mackiewicz, D. and Cebrat, S. (2009). To understand nature
- computer modelling between genetics and evolution.
In J. Miekisz and M. Lachowicz (eds), From Genetics
to Mathematics, Series on Advances in Mathematics
for Applied Sciences 79, pages 1–33. World Scientific.
Mackiewicz, D., Mackiewicz, P., Kowalczuk, M., Dud-
kiewicz, M., Dudek, M., and Cebrat, S. (2003). Re-
arrangements between differently replicating DNA
strands in asymmetric bacterial genomes. Acta Mi-
crobiol. Pol., 52:245–261.
Mackiewicz, P., Dudkiewicz, M., Kowalczuk, M., Mack-
iewicz, D., Kiraga, J., Polak, N., Smolarczyk, K.,
Nowicka, A., Dudek, M., and Cebrat, S. (2004). Dif-
ferential gene survival under asymmetric directional
mutational pressure. LNCS, 3039:687–693.
Mackiewicz, P., Gierlik, A., Kowalczuk, M., Dudek, M.,
and Cebrat, S. (1999). Asymmetry of nucleotide com-
position of prokaryotic chromosomes. J. Appl. Genet.,
40:1–14.
Mackiewicz, P., Mackiewicz, D., Kowalczuk, M., and Ce-
brat, S. (2001a). Flip-flop around the origin and ter-
minus of replication in prokaryotic genomes. Genome
Biol., 2:1004.1–1004.4.
Mackiewicz, P., Szczepanik, D., Gierlik, A., Kowalczuk,
M., Nowicka, A., Dudkiewicz, M., Dudek, M., and
Cebrat, S. (2001b). The differential killing of genes
by inversions in prokaryotic genomes. J. Mol. Evol.,
53:615–621.
McLean, M., Wolfe, K., and Devine, K. (1998). Base com-
position skews, replication orientation, and gene ori-
entation in 12 prokaryote genomes. J. Mol. Evol.,
47:691–696.
Mrazek, J. and Karlin, S. (1998). Strand compositional
asymmetry in bacterial and large viral genomes. Proc.
Natl. Acad. Sci. U.S.A., 95:3720–3725.
Mushegian, A. and Koonin, E. (1996). Gene order is
not conserved in bacterial evolution. Trends Genet.,
12:289–290.
Rocha, E. (2006). Inference and analysis of the relative
stability of bacterial chromosomes. Mol. Biol. Evol.,
23:513–522.
Rocha, E. and Danchin, A. (2001). Ongoing evolution of
strand composition in bacterial genomes. Mol. Biol.
Evol., 18:1789–1799.
Rocha, E. and Danchin, A. (2003a). Gene essentiality deter-
mines chromosome organisation in bacteria. Nucleic
Acids Res., 31:5202–5211.
Rocha, E. and Danchin, A. (2003b). Essentiality, not ex-
pressiveness, drives gene strand bias in bacteria. Na-
ture Genet., 34:377–378.
Rocha, E., Touchon, M., and Feil, E. (2006). Similar com-
positional biases are caused by very different muta-
tional effects. Genome Res., 16:1537–1547.
Tillier, E. and Collins, R. (2000a). The contributions of
replication orientation, gene direction, and signal se-
quences to base composition asymmetries in bacterial
genomes. J. Mol. Evol., 50:249–257.
Tillier, E. and Collins, R. (2000b). Genome rearrangement
by replication-directed translocation. Nature Genet.,
26:195–197.
Watanabe, H., Mori, H., Itoh, T., and Gojobori, T. (1997).
Genome plasticity as a paradigm of eubacterial evolu-
tion. J. Mol. Evol., 44 (Suppl. 1):57–64.
EvolutionofBacterialGenomeunderChangingMutationalPressure-ComputerSimulationStudies
277
