
Assignment of Orthologous Genes by Utilization of Multiple Databases
The Orthology Package in R
Steffen Priebe and Uwe Menzel
Systems Biology and Bioinformatics Group, Leibniz Institute for Natural Product Research and Infection Biology
Hans-Kn
¨
oll-Institute, Jena D-07745, Germany
Keywords:
Orthologs, Databases, Multi-species, R Programming Language.
Abstract:
The assignment of orthologous genes between species is a key issue when multiple-species approaches are
conducted. This has become even more relevant over the past years, triggered by the development of high-
throughput genome sequencing technologies, which enable access to complete genomes in a rapid and cost-
effective way. In this paper, we present a new software that allows the user to access orthology relationships
across multiple species in an easy, fast, and flexible manner. The tool collects data from three prominent freely
available databases, and presents it to the user in a convenient, easily accessible way. Once the package is
installed, the software works on the local computer, therewith circumventing runtime delay caused by network
traffic often being a critical performance bottleneck when large datasets are studied or many organisms are
investigated simultaneously. By the consequent internal usage of unique identifiers, the software disburdens
the user from problems connected with the existence of synonyms or ambiguous gene denotations, a problem
that often hampers a clear-cut assignment of orthologs. The software is able to display frequently occurring,
complicated many-to-many orthology relationships in a visual manner. It is written in the R programming
language and freely available.
1 INTRODUCTION
Multiple-species approaches become more and more
important when universal, cross-species biological
principles are to be investigated, for example in sys-
tems biology, cancer- or age research. Furthermore,
ethical or practical reasons - e.g. a limited population
frequency - make the usage of model organisms in bi-
ological experiments often unavoidable, and conclu-
sions of general relevance have to be derived starting
from the results obtained for the model organisms. It
appears self-evident that the accurate determination of
orthologs - genes with a shared ancestor separated by
a speciation event - adopts a key role when using such
approaches. However, a researcher aiming at carrying
out an orthology search is frequently confronted with
a number of problems.
First of all, by committing oneself to a sin-
gle database only, important orthology relationships
might be missed because of the incompleteness of
present-day databases. Secondly, the search for or-
thologous genes is often hampered - if not made im-
possible - by the existence of a multitude of synonyms
or other ambiguous denotations that exist for the va-
st majority of annotated genes. Thirdly, if web-based
databases have to be used, access can be slow if large
datasets are investigated or many organisms are stud-
ied at the same time. Last but not least, orthol-
ogy relationships are often not in a 1-to-1 manner,
so that graphical presentations of many-to-many re-
lationships are desirable, while simple gene lists are
inconvenient and hard to perceive.
Up to now, various methods for the identification
of orthologous genes between species have been de-
veloped, starting from simple blast searches aiming
at the identification of bi-directional hits between the
genes of two species, up to advanced clustering or
tree-based methods (Kuzniar et al., 2008; Kristensen
et al., 2011). The results of this work have been stored
in a number of publicly available databases, providing
orthology information covering a growing number of
species to the research community. In this paper, we
utilize three prominent and comprehensive databases
that have been established in order to identify ortholo-
gous genes: i) the HomoloGene database maintained
at the National Center for Biotechnology Information
- NCBI (Geer et al., 2010), ii) the Ensembl Com-
para database driven by the Ensembl project (Vilella
105
Priebe S. and Menzel U..
Assignment of Orthologous Genes by Utilization of Multiple Databases - The Orthology Package in R.
DOI: 10.5220/0004193201050110
In Proceedings of the International Conference on Bioinformatics Models, Methods and Algorithms (BIOINFORMATICS-2013), pages 105-110
ISBN: 978-989-8565-35-8
Copyright
c
2013 SCITEPRESS (Science and Technology Publications, Lda.)
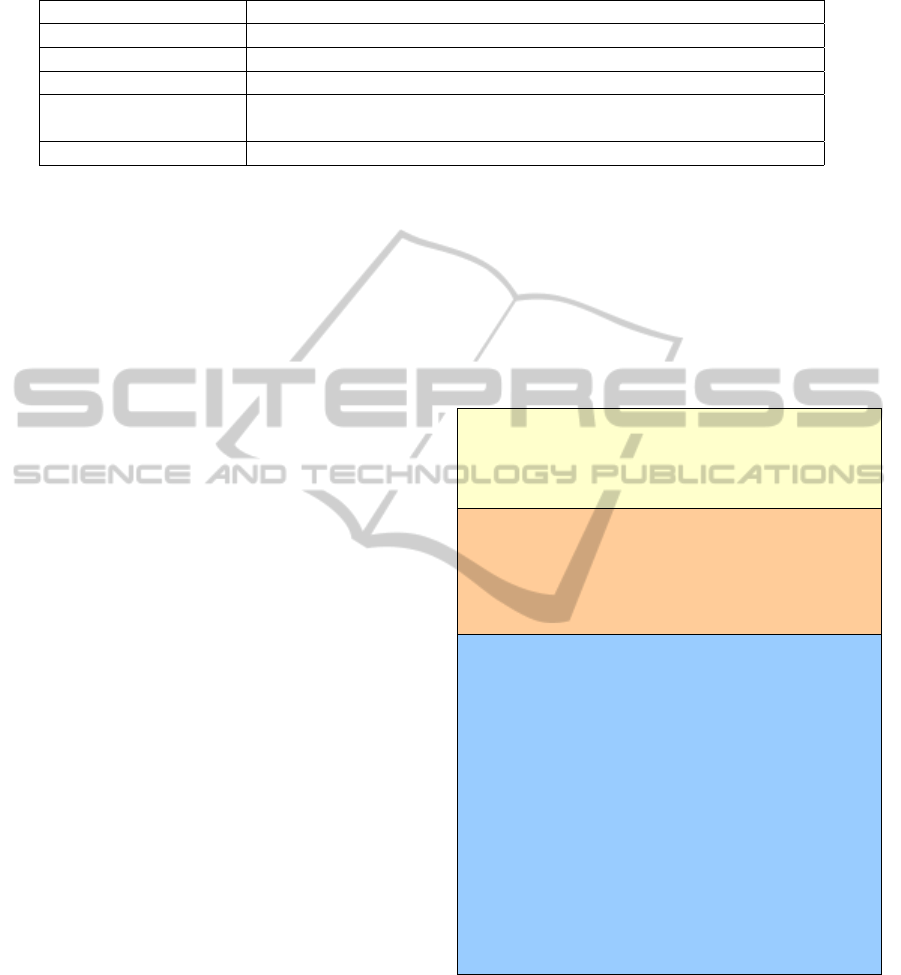
Table 1: The main commands of the R orthology package and their function.
Subroutine Task
get.gene.info access different identifiers and descriptive information for genes
get.orthologe get the orthologs in other species for a given gene and a given species
is.orthologe test if two genes from different species are orthologous
get.ortholog.table visualize orthology relationships between two or more species
and return table (see figure 1)
get.orthologe.set return a set of all orthologous genes between the input species
et al., 2009), and iii) the Inparanoid database held at
the University of Stockholm, Sweden (Ostlund et al.,
2010).
The HomoloGene database at NCBI is a system
for the automated detection of homologs among the
annotated genes of several completely sequenced eu-
karyotic genomes. The approach used to establish
this database relies on clustering the input sequences
from the different species based on sequence similar-
ity on the protein level, using the blastp protein se-
quence alignment tool (Altschul et al., 1990). As a
key feature, database creation considers taxonomy by
matching sequences from closely related species first,
subsequently adding sequences originating from or-
ganisms with bigger evolutionary distances to a tree
constructed during this procedure (Wheeler et al.,
2006). The HomoloGene database currently includes
21 species (Release 66).
The Ensembl Compara database is driven by the
Ensembl project. In order to establish this database,
orthology was predicted by gene tree generation us-
ing the TreeFam methodology (Ruan et al., 2008).
This involves building a graph of protein similarity
utilizing blastp, extracting clusters from this graph,
and generating multiple alignments within each clus-
ter. Based on these alignments, a gene tree is built
and reconciled with the taxonomy tree (Vilella et al.,
2009). An important feature of this approach is
that sequence similarity is connected with informa-
tion originating from the phylogenetic tree of the
species. The respective data can be accessed using
a Perl Application Programme Interface (Perl API) or
the BioMart portal (Haider et al., 2009).
As a third source of orthology information, we uti-
lize the Inparanoid database. Here, pairwise similar-
ity scores between complete proteomes were calcu-
lated in order to construct orthology groups, seeded
by the reciprocally best-matching pair. So far, this
database contains 100 eukaryotic species. While In-
Paranoid essentially relies on pairwise ortholog rela-
tionships, both HomoloGene and Ensembl Compara
use heuristic as well as phylogenetic methods to in-
fer orthologs, even though with considerably different
methods. The use of multiple databases - with varying
approaches to infer orthology - increases the number
of identifiable orthology relationships between genes
of different species. Furthermore, by using multiple
databases, it becomes possible to confine oneself to
robust predictions of orthology by merely consider-
ing data that are confirmed by more than one database
because biases in one database can be expected to be
overcome by another.
> get.gene.info("glr-2","external_gene_id","","ce")[1:5]
ensembl_gene_id ensembl_peptide_id external_gene_id entrezgene
13751 B0280.12 B0280.12b glr-2 175999
13752 B0280.12 B0280.12a glr-2 175999
wikigene_description
13751 GLutamate Receptor family (AMPA)
13752 GLutamate Receptor family (AMPA)
> get.orthologe("B0280.12","ce","mm")
$ensembl
ENSMUSG00000001986 ENSMUSG00000025892 ENSMUSG00000033981
"ENSMUSG00000001986" "ENSMUSG00000025892" "ENSMUSG00000033981"
ENSMUSG00000020524
"ENSMUSG00000020524"
$homologene
ENSMUSG00000001986
"ENSMUSG00000001986"
> get.orthologe.table(gene=get.gene.info("mod-5","external_gene_id",
"ensembl_gene_id","ce"),species="ce",plot=TRUE,self=FALSE)
$danrer
[1] "ENSDARG00000061165" "ENSDARG00000057017"
$mm
[1] "ENSMUSG00000020838"
$hs
[1] "ENSG00000108576"
$ce
[1] "Y54E10BR.7"
$ortho_table
ENSDARG00000061165 ENSDARG00000057017 ENSMUSG00000020838
ENSDARG00000061165 0 0 3
ENSDARG00000057017 0 0 0
ENSMUSG00000020838 3 0 0
ENSG00000108576 3 0 7
Y54E10BR.7 1 3 1
ENSG00000108576 Y54E10BR.7
ENSDARG00000061165 3 1
ENSDARG00000057017 0 3
ENSMUSG00000020838 7 1
ENSG00000108576 0 1
Y54E10BR.7 1 0
A
B
C
Figure 1: Usage of the main commands of the package
and example output. A: Accessing different gene IDs for
gene symbol glr-2 (C. elegans). B: Retrieval of orthologs in
mouse for the selected Ensembl gene ID. In this case only
Ensembl and HomoloGene provide orthologs. C: Listing
of all orthologs for the mod-5 gene (C. elegans) in human,
mouse and zebrafish. The number in the orthology table de-
fines the source of information. If the parameter plot is set
to TRUE, a network plot will be drawn (see Figure 2).
BIOINFORMATICS2013-InternationalConferenceonBioinformaticsModels,MethodsandAlgorithms
106
Orthologous gene relationship
for mod−5 in ce
Y54E10BR.7
mod−5
ENSDARG00000061165
slc6a4a
ENSDARG00000057017
slc6a4b
ENSG00000108576
SLC6A4
ENSMUSG00000020838
Slc6a4
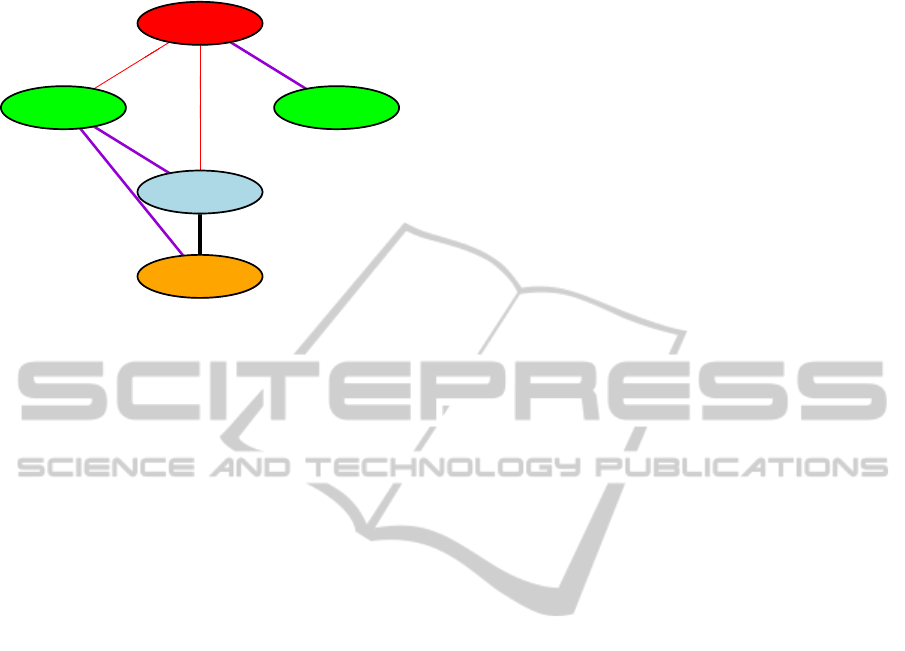
Node color: Red = C.elegans, Green = D.rerio, Blue = H.sapiens, Orange = M.musculus
Edge color: Red = Ensembl, Blue = Homologene, Yellow = Inparanoid
Violet = Ensembl+Homologene, Orange = Ensembl+Inparanoid, Green = Homologene+Inparanoid
Black = Ensembl+Homologene+Inparanoid
Figure 2: Graphical representation of the orthology table
produced using the command stated in figure 1 C. Here the
orthology relationship is less complex, with only four or-
thologous genes in three other species. The orthologous
connection of SLC6A5 (human) and Slc6a4 (mouse) is cov-
ered by all three databases (thick black edge), which is rep-
resented by a binary 111 (decimal 7) in figure 1 C). Self-
edges are not included.
2 RESULTS
The software described in this paper allows the user
to access information stored in several orthology
databases with one interface only, with the advantage
that the user does not have to know how the individual
databases are to be operated. The software provides
a collection of features which, amongst other things,
allow the translation of gene names to gene identi-
fiers, the accession of functional gene descriptions,
and the retrieval of orthology relationships between
two or more organisms. A few of the subroutines of
the software package and their respective functions
are listed in table 1.
2.1 Example Commands
The command get.orthologe takes a gene identifier
or gene symbol as input, and outputs the orthologs in
the organisms specified by the user. Upon request, all
three databases listed in the introduction can be taken
into account, or a subset of them.
Orthology relationships often are complicated
when more than two species are involved. In this case,
a graphical representation can help to understand this
complexity. The latter can be accomplished using the
function get.ortholog.table. This function dis-
plays orthology relationships in tabular form (figure
1) and visualizes these relationships in form of a net-
work graph.
In the table, gene names of two or more organ-
isms serve as column and row headers. Numbers in
the cells of the table encode the databases that re-
port orthology between the corresponding genes. We
use binary numbers for encoding, where 1 (2
0
) repre-
sents the Ensembl database, 2 (2
1
) represents the Ho-
moloGene database, and 4 (2
2
) stands for an orthol-
ogy relationship reported by the Inparanoid database.
The actual number shown in the table is then the sum
of the numbers representing the individual databases.
For example, 3 in a cell of the table means that or-
thology of the corresponding genes is reported by
the Ensembl database as well as by the HomoloGene
database. Certainly, every gene is orthologous to it-
self. Therefore, by default, self hits are labeled 0 in
the table and are suppressed in the graphical represen-
tation. However, if the parameters plot and self are
set TRUE, the self-hits appear as 10 in the table, and
self-edges are added to the plot.
Figure 2 shows a relatively simple example for
a graphical representation of orthology relationships
between genes, while figure 3 displays a more com-
plicated graph. It displays the glr-2 gene in C. elegans
and its orthologs in three other vertebrate species. In
this plots, nodes define genes and edges connect or-
thologous genes across species. While the node color
indicates species, the color of the edges stands for
the database the orthology is derived from. In this
case, like in many others, there is no simple 1-to-1 or-
thology relationship between the genes but there ex-
ists a multitude of (putative) orthologs in the organ-
isms considered, covered by different databases (1-
to-many and many-to-many).
An issue in orthology identification is if and how
the order of input affects the results. For example, if
the orthology request shown in figure 2 started from
the human SLC6A4 gene (marked blue in the figure),
the slc6a4b D. rerio gene (marked green, to the right)
would not appear in the resulting plot, since this gene
is solely listed as ortholog of the mod-5 C. elegans
gene. In order to overcome this discrepancy, a special
parameter loop - with default 0 - can be set to a posi-
tive integer value n. This causes the tool to carry out n
iterative loops of orthology searches, in which every
loop uses the results of the previous one as input.
2.2 Applications
The orthology package described here has been suc-
cessfully applied in the framework of the JenAge
project, a collaboration between several institutions
AssignmentofOrthologousGenesbyUtilizationofMultipleDatabases-TheOrthologyPackageinR
107
Orthologous gene relationship
for glr−2 in ce
B0280.12
glr−2
ENSDARG00000037496
gria4a
ENSDARG00000059368
gria4b
ENSDARG00000037498
gria3b
ENSDARG00000032737
gria3a
ENSDARG00000052765
gria2b
ENSDARG00000070173
gria2a
ENSDARG00000021352
gria1a
ENSDARG00000032714
gria1b
ENSG00000125675
GRIA3
ENSG00000152578
GRIA4
ENSG00000120251
GRIA2
ENSG00000155511
GRIA1
ENSMUSG00000001986
Gria3
ENSMUSG00000025892
Gria4
ENSMUSG00000033981
Gria2
ENSMUSG00000020524
Gria1
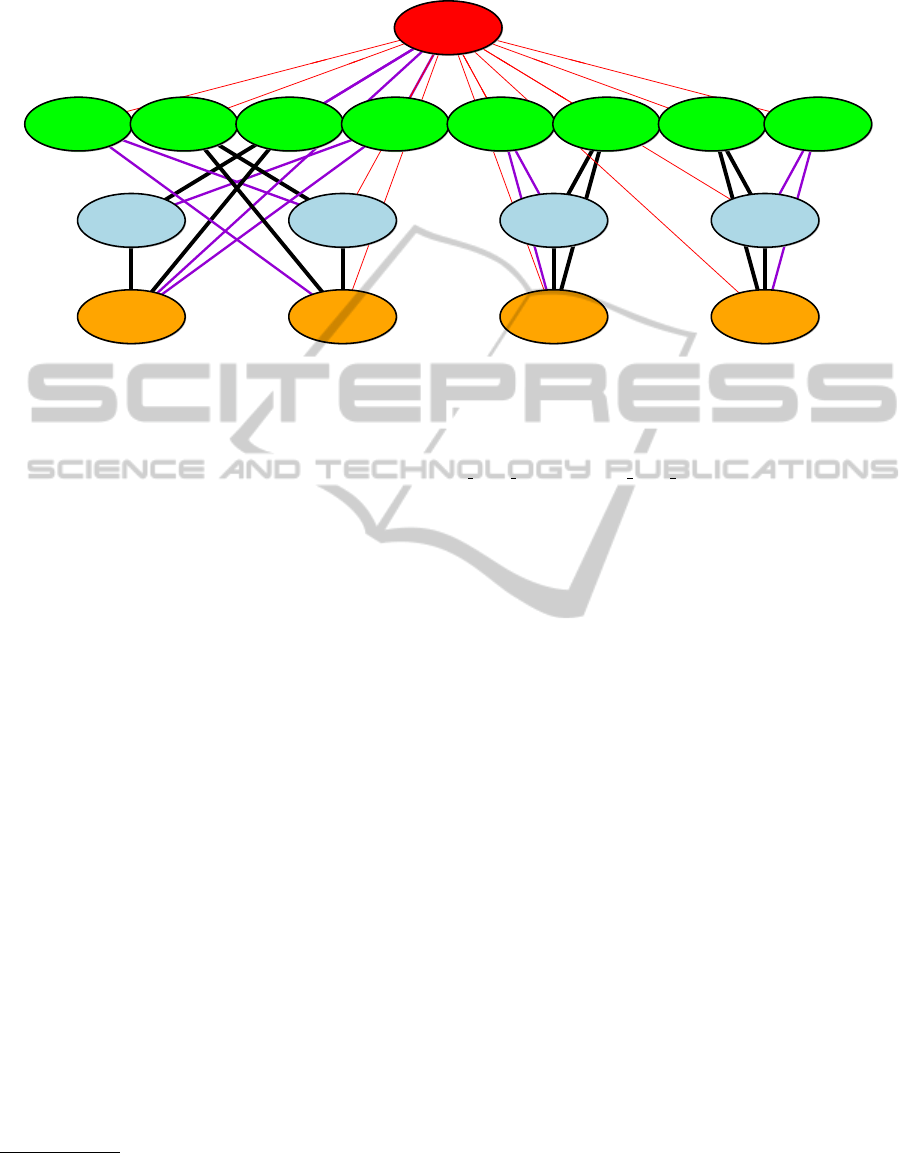
Node color: Red = C.elegans, Green = D.rerio, Blue = H.sapiens, Orange = M.musculus
Edge color: Red = Ensembl, Blue = Homologene, Yellow = Inparanoid
Violet = Ensembl+Homologene, Orange = Ensembl+Inparanoid, Green = Homologene+Inparanoid
Black = Ensembl+Homologene+Inparanoid
Figure 3: Example R plot for the orthologous relationship of the glr-2 gene in C.elegans
using the command: get.orthologe.table("B0280.12","ce",plot=TRUE,self=FALSE) or
get.orthologe.table(get.gene.info("glr-2","external gene id","ensembl gene id","ce"), +
"ce",plot=TRUE,self=FALSE).
in Jena, Germany
1
. In this project, normal and
perturbed ageing is investigated by measuring the
complete transcriptomes of five organisms (round-
worm, zebrafish, killifish, mouse and human) at dif-
ferent age levels using next-generation-sequencing
technologies. The goal of this project is to study
the complex interplay of maintenance and repair net-
works in the process of ageing in these organisms.
The software introduced in this paper has essentially
contributed to the evaluation of the transcriptome
data, for instance by clustering temporal expression
patterns across species, by enabling a gene set enrich-
ment analysis (GSEA) with four organisms included,
and by facilitating the construction of decision trees
for gene expression levels by inclusion of multiple
species.
In addition, the methods presented here were used
in a cross-species comparison (between M. musculus
and C. elegans) of genes that were differentially ex-
pressed as a consequence of artificially induced im-
paired insulin/IGF1 signalling, which extends lifes-
pan in both species. Thereby, six commonly downreg-
ulated and thirty commonly upregulated genes could
be identified (Zarse et al., 2012).
Another successful application of the orthology
package was presented at the RoSyBa
2
in 2011. Here,
genes of three species including different tissues,
1
http://www.jenage.de
2
http://goethe.informatik.uni-
rostock.de/ibima/rosyba2011/
which were differentially expressed during the pro-
cess of aging were compared using the methods de-
scribed in this paper, yielding 49 orthologous upregu-
lated (amongst others mod-5, shown in figure 2) and
66 downregulated genes (Fuellen et al., 2012).
3 DISCUSSION
The package presented here is capable of support-
ing genome-based multi-species approaches where
the knowledge of orthology relationships between the
genes of two or more organisms is required. Ex-
amples for areas of application are systems biol-
ogy, cancer- or age research. The package sub-
sumes data from three prominent open-access orthol-
ogy databases, and allows the user to retrieve the in-
formation contained in these databases in a consis-
tent manner. By collecting information from several
databases, the package gives a more complete picture
of orthology compared to each individual database. It
allows for selection of robust predictions of orthology
if the user confines the search to orthologies predicted
by more than one database. The package is free of
idle time caused by network traffic because the data
related to the investigated organisms is downloaded
and processed locally before the package is used for
the first time, and is therewith faster than web-based
tools. Problems arising from the existence of syn-
onyms for genes or from the occurrence of duplicate
BIOINFORMATICS2013-InternationalConferenceonBioinformaticsModels,MethodsandAlgorithms
108
gene names and non-unique gene identifiers are over-
come by using unique (Ensembl-) identifiers inter-
nally. The latter liberates the user from such issues,
and in many cases is a prerequisite for a successful or-
thology search. Orthology relationships between two
or more species can be drawn schematically as shown
in figure 2, which allows the user to gain insight even
if complicated many-to-many orthology relationships
between genes prevail.
By default, the current release of the orthol-
ogy package comprises data for four organisms:
C. elegans, D. rerio, M. musculus and H. sapiens. The
extension towards a larger set of supported species
is simply feasible as long as the referring data is
available in the HomoloGene database, the Ensembl
Compara database, and the Inparanoid database. Fu-
ture work could be the inclusion of more orthology
databases or species into the package. The software
is written using the R programming language and is
freely available at the Comprehensive R Archive Net-
work - CRAN
3
.
4 METHODS
In order to build the package described here, data
from different sources, with different structures, had
to be combined. The orthology information stored
in the databases involved was downloaded, and
the datasets were synchronized by cross-mapping
the corresponding identifiers used in the individual
databases. A diagram showing the databases used and
the mappings carried out is depicted in figure 4.
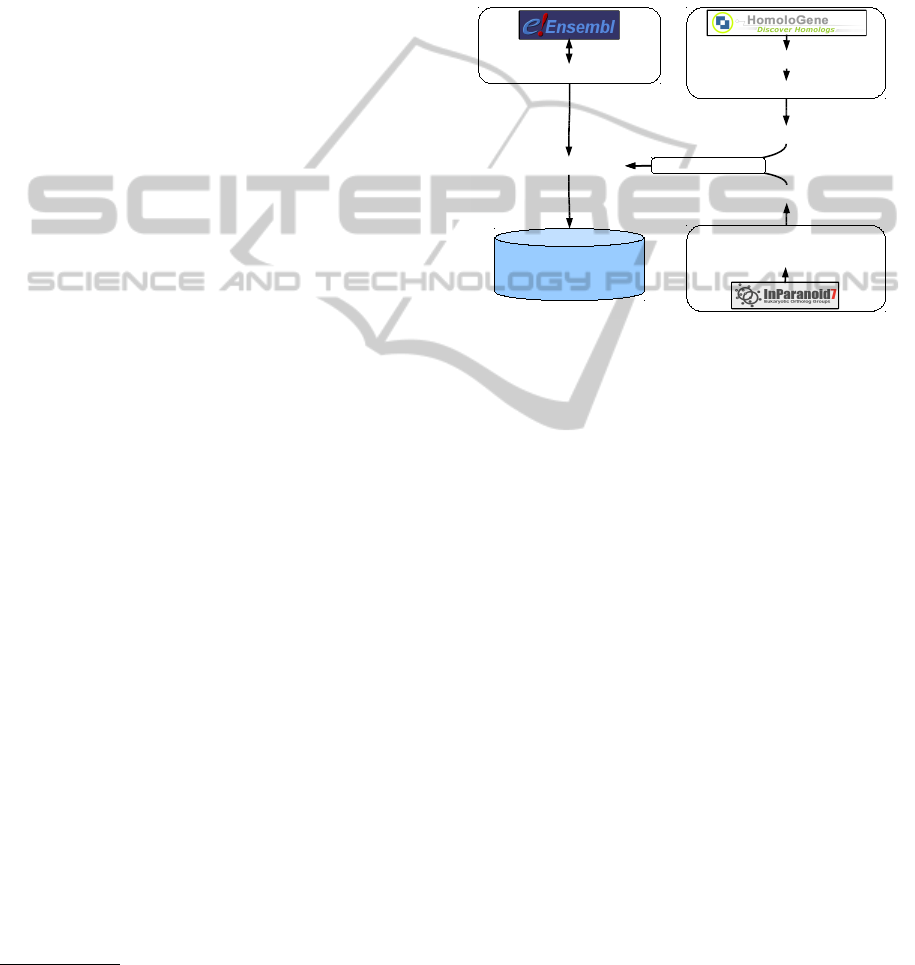
As internal identifiers for the orthology package,
Ensembl gene IDs were chosen since two of the in-
cluded databases work with Ensembl IDs. Informa-
tion from Ensembl Compara was accessed via the
biomaRt R package (Durinck et al., 2005) which facil-
itates connection to the Biomart portal. The Homolo-
Gene database was downloaded in flat-file format
4
and accessed using the R package annotationTools
(Kuhn et al., 2008). HomoloGene uses Entrez gene
IDs as internal identifiers which can be mapped
to Ensembl gene IDs using the biomaRt package.
Data from the Inparanoid database was retrieved with
the corresponding homology information R packages
from Bioconductor (e.g. hom.Hs.inp.db for human
or hom.Mm.inp.db for mouse) (Carlson and Pages,
2012). Inparanoid is based on Ensembl protein IDs
and, once again, these IDs were mapped using the
3
www.cran.r-project.org
4
ftp://ftp.ncbi.nih.gov/pub/HomoloGene/
current/homologene.data
biomaRt package. The complete datasets were pre-
processed and assembled into a compact R package
that is run on the local computer independently from
online resources. Because of the compact structure,
the commands shown in table 1 can be run in par-
allel on multiple CPUs, although this is not manda-
tory. The example commands used in this paper only
needed a few seconds on a standard desktop com-
puter.
BioMart via biomaRt R package
FTP data download
annotationTools R package
Entrez gene IDs
Ensembl gene IDs
biomaRt R package
homology information R packages:
hom.Hs.inp.db, hom.Mm.inp.db,
hom.Dr.inp.db, hom.Ce.inp.db
Ensembl protein IDs
local R orthology
package for fast access
Figure 4: Scheme of the accessed databases and of the gen-
eral data flow.
5 CONCLUSIONS
We present a software package that is able to access
and display orthology relationships between multiple
species. The software circumvents a number of is-
sues usually connected with orthology searches and
provides a convenient and consistent interface to the
user. The software has been proven to be useful in
several research projects, and is freely available at the
Comprehensive R Archive Network (CRAN).
ACKNOWLEDGEMENTS
This work is part of the research program of
the Jena Centre for Systems Biology of Ageing
(JenAge) funded by the German Ministry for Ed-
ucation and Research (Bundesministerium fur Bil-
dung und Forschung - BMBF; support code BMBF
0315581).
REFERENCES
Altschul, S. F., Gish, W., Miller, W., Myers, E. W., and
Lipman, D. J. (1990). Basic local alignment search
AssignmentofOrthologousGenesbyUtilizationofMultipleDatabases-TheOrthologyPackageinR
109

tool. J Mol Biol, 215(3):403–10.
Carlson, M. and Pages, H. (2012). hom.Hs.inp.db,
hom.Mm.inp.db, hom.Dr.inp.db and hom.Ce.inp.db:
Homology information for Homo Sapiens, Mus mus-
culus, Danio rerio and Caenorhabditis elegans from
Inparanoid. R package version 2.5.0.
Durinck, S., Moreau, Y., Kasprzyk, A., Davis, S., De Moor,
B., Brazma, A., and Huber, W. (2005). Biomart
and bioconductor: a powerful link between biological
databases and microarray data analysis. Bioinformat-
ics, 21(16):3439–40.
Fuellen, G., Dengjel, J., Hoeflich, A., Hoeijmakers, J.,
Kestler, H. A., Kowald, A., Priebe, S., Rebholz-
Schuhmann, D., Schmeck, B., Schmtz, U., Stolzing,
A., Shnel, J., Wuttke, D., and Vera, J. (2012). Sys-
tems biology and bioinformatics in aging research: A
workshop report. Rejuvenation Res.
Geer, L. Y., Marchler-Bauer, A., Geer, R. C., Han, L., He,
J., He, S., Liu, C., Shi, W., and Bryant, S. H. (2010).
The ncbi biosystems database. Nucleic Acids Res,
38(Database issue):D492–6.
Haider, S., Ballester, B., Smedley, D., Zhang, J., Rice, P.,
and Kasprzyk, A. (2009). Biomart central portal–
unified access to biological data. Nucleic Acids Res,
37(Web Server issue):W23–7.
Kristensen, D. M., Wolf, Y. I., Mushegian, A. R.,
and Koonin, E. V. (2011). Computational meth-
ods for gene orthology inference. Brief Bioinform,
12(5):379–91.
Kuhn, A., Luthi-Carter, R., and Delorenzi, M. (2008).
Cross-species and cross-platform gene expression
studies with the bioconductor-compliant r package
’annotationtools’. BMC Bioinformatics, 9:26.
Kuzniar, A., van Ham, R. C. H. J., Pongor, S., and Leunis-
sen, J. A. M. (2008). The quest for orthologs: find-
ing the corresponding gene across genomes. Trends
Genet, 24(11):539–51.
Ostlund, G., Schmitt, T., Forslund, K., K
¨
ostler, T., Messina,
D. N., Roopra, S., Frings, O., and Sonnhammer, E.
L. L. (2010). Inparanoid 7: new algorithms and tools
for eukaryotic orthology analysis. Nucleic Acids Res,
38(Database issue):D196–203.
Ruan, J., Li, H., Chen, Z., Coghlan, A., Coin, L. J. M.,
Guo, Y., Hrich, J.-K., Hu, Y., Kristiansen, K., Li, R.,
Liu, T., Moses, A., Qin, J., Vang, S., Vilella, A. J.,
Ureta-Vidal, A., Bolund, L., Wang, J., and Durbin, R.
(2008). Treefam: 2008 update. Nucleic Acids Res,
36(Database issue):D735–D740.
Vilella, A. J., Severin, J., Ureta-Vidal, A., Heng, L., Durbin,
R., and Birney, E. (2009). Ensemblcompara gene-
trees: Complete, duplication-aware phylogenetic trees
in vertebrates. Genome Res, 19(2):327–35.
Wheeler, D. L., Barrett, T., Benson, D. A., Bryant, S. H.,
Canese, K., Chetvernin, V., Church, D. M., DiCuc-
cio, M., Edgar, R., Federhen, S., Geer, L. Y., Helm-
berg, W., Kapustin, Y., Kenton, D. L., Khovayko,
O., Lipman, D. J., Madden, T. L., Maglott, D. R.,
Ostell, J., Pruitt, K. D., Schuler, G. D., Schriml,
L. M., Sequeira, E., Sherry, S. T., Sirotkin, K., Sou-
vorov, A., Starchenko, G., Suzek, T. O., Tatusov,
R., Tatusova, T. A., Wagner, L., and Yaschenko, E.
(2006). Database resources of the national center
for biotechnology information. Nucleic Acids Res,
34(Database issue):D173–D180.
Zarse, K., Schmeisser, S., Groth, M., Priebe, S., Beuster,
G., Kuhlow, D., Guthke, R., Platzer, M., Kahn, C. R.,
and Ristow, M. (2012). Impaired insulin/igf1 sig-
naling extends life span by promoting mitochondrial
l-proline catabolism to induce a transient ros signal.
Cell Metab, 15(4):451–65.
BIOINFORMATICS2013-InternationalConferenceonBioinformaticsModels,MethodsandAlgorithms
110
