
An Enhanced Ant Colony Optimization for Routing Area Mobility
Prediction over Cellular Communications Network
Mohammad Sh. Daoud
1
, Aladdin Ayesh
1
, Mustafa Al-Fayoumi
2
and Adrian A. Hopgood
3
1
Faculty of Technology, De Montfort University, Leicester, U.K.
2
College of Computer Engineering and Sciences, Salman bin Abdulaziz University, Al-Kharj, Saudi Arabia
3
Sheffield Business School, Sheffield Hallam University, Sheffield, U.K.
Keywords:
Ant Colony Optimization, LBSs, Mobility Prediction, Cellular Network, UMTS.
Abstract:
Cellular communication networks have become medium to provide various services. Most of the services
provided are based on the users’ locations, as in location-based services (LBSs); these services include both
common voice services as well as multimedia and integrated data services. Used techniques mostly suffered
from complex computation, accuracy rate regression and insufficient accuracy. Nevertheless, in the cell side,
reducing the complexity cost and preventing the prediction algorithm to perform in two closer time slot. That’s
why using routing area should be able to avoid the cell side problems. This paper discusses An Enhanced Ant
Colony Optimization for Routing Area Mobility Prediction over Cellular Communications Network (EA-
CORA) which is based on developed ant colony Optimization.
1 INTRODUCTION
Mobile networks have become the platform that pro-
vides leading-edge Internet services, for instance a
person can solve problems in any place without any
need to go to his office or to travel, just by us-
ing his mobile phone or laptop. These services in-
clude both common voice services as well as mul-
timedia and integrated data services. Integration of
the Internet Protocol (IP) with Third-Generation (3G)
wireless communication through the Universal Mo-
bile Telecommunications System (UMTS) All-IP net-
work was proposed by Third-Generation Partnership
Project (3GPP), as next-generation in the telecommu-
nications networks.
However, these networks are facing problems
such as fragile wireless link, consume resource, de-
nied of services and mobility of mobile users. The
mobility location is changing during the constantly
movement of mobile user’s. The cellular communi-
cations network is divided into cells, each cell cov-
ers a specific area within the network. The cell con-
tains Base Station (BS) that response to do commu-
nications with mobile users reside in the cell. Sev-
eral cells are grouped together belong to Routing Area
(RA). Consequently, the network consists a set of RA.
Mobile user being at the boundary of either cell or
RA and going to different one, the hand-off occurs
and the connection in some cases will be lost because
there are no resources to handle the mobile user at
new serving area. In contrast, if the resources are
enough at the new serving area often the connection
lose because the time when mobile user send a re-
quest message for re-located and be in the new area is
not enough to finish the hand-off procedure, specially
that happen at RA re-located. Finally, if the connec-
tion does not lose during the Hand-off, a service does
not deliver on the time to mobile users.
If the network has enough information about mo-
bile user and neighboured, appropriate artificial intel-
ligent systems are employed. These help the network
to predict the next displacement for mobile user with
high accuracy, then sensible resource will be saved,
delay time for delivering the services will decrease
and improve the network functionality such as pag-
ing, location update and Hand-off.
The EACORA is proposed in this paper to im-
prove the mobility prediction for Location-Based Ser-
vices, mobile user’s displacement is achieved by the
developed ant colony. EACORA works on the RA,
that means every RA classify as independent colony
and control their own. Variables pass through them
because each one of them needs to know the visibility
of his neighbours.
The main contribution of this paper targets the
LBSs cost by deploying a prediction technique that al-
419
Sh. Daoud M., Ayesh A., Al-Fayoumi M. and Hopgood A..
An Enhanced Ant Colony Optimization for Routing Area Mobility Prediction over Cellular Communications Network.
DOI: 10.5220/0004201004190424
In Proceedings of the 5th International Conference on Agents and Artificial Intelligence (ICAART-2013), pages 419-424
ISBN: 978-989-8565-39-6
Copyright
c
2013 SCITEPRESS (Science and Technology Publications, Lda.)

lows intelligent LBSs disclosing and hence minimizes
the computation cost, consumption of resources, re-
duce the message passing and the overall cost of the
location management process such as location update.
EACORA scheme utilizes geometrical and topologi-
cal techniques allowing users to receive desired ser-
vices timely fashion.
The rest of the paper is organized as follows: Sec-
tion 2 discusses the previous work on mobility predic-
tion for LBSs and their limitations are described. The
proposed technique is introduced in section 3 and its
simulation model and result analysis is presented in
section 4. Finally, the conclusion and future work is
presented in sections 5.
2 PREVIOUS WORKS
Locating users as they move from one place to another
in a mobile computing environment is the key to pro-
viding continuous services with unrestricted mobility.
Therefore, the data management in this environment
is especially challenging for the need to process infor-
mation on the move, to cope with resource limitations,
and to deal with heterogeneity. One of the applica-
tions of mobile data management is LBSs which have
been identified as one of the most promising areas of
research and development (Barbar, 1999).
In the cell technique (Das and Sen, 1999; J. Bi-
esterfeld and Jobmann, 1997; Kubach, 2000; Kumar
and Venkataram, 2002; Shah and Nahrstedt, 2002; U
and Rothermel, 2000) a service area is partitioned into
several cells. The cell covering the mobile user will
page his or her device to establish a radio link in order
to track changes in the location of mobile users.
The cells broadcast their identities and the mobile
user periodically listens to cell identity and compares
it with the cell identity stored in its buffer. If the com-
parison indicates that the location has been changed
then the mobile user sends a location update message
to the network (Holma and Toskala, 2001).
Prediction techniques based on a cell technique
can be enhanced by heuristic methods and neural net-
works (Lu, 2003; Capka and Boutaba, 2004). Liou
and Lu (Lu, 2003) divided the cell into two areas,
edge and non-edge. The edge areas have neighbour-
ing cells, while the remaining areas are considered
as non-edge areas. When the mobile user is in a
cell’s edge area, the information is passed to a neu-
ral network which predicts from the neighbouring
cells the next cell to be visited. Another technique
captures some of the mobile user activity and paths.
These paths are progressively recorded, giving a his-
tory record which is used as an input to a neural net-
work to predict the next cell to be visited (Capka and
Boutaba, 2004).
The first Ant Colony Optimization (ACO) al-
gorithm, called Ant System (AS)(Dorigo, 1996;
Dorigoa and Gambardella, 1997; Dorigo et al., 2000;
Dorigo and Di Caro, 1999), Dorigo et al., in (Dorigo,
1996) proposed that to solve the Traveling Sales-
man Problem (TSP). They proposed a new model
to combinative stochastic optimization, based on the
ants’ behavior, it is inspired from (S.Goss, 1990;
Deneubourg and Goss, 1989; Deneubourg et al.,
1983). This model is useful when use in greedy
heuristic to find acceptable results at the early pro-
cessing, complex system which need to use the dis-
tributed computational to deal with the random space
variable, that mean avoiding premature convergence.
The mobility prediction technique in (Daoui et al.,
2008) uses the first version of ACO, which the cell di-
viding has not used, stagnation of search is addressed,
and consuming computation cost because there was
no limitation for pheromone and the authors did not
use the modifications of ACO avoided.
Recent research ACO focuses on premature con-
vergence of the pheromone that the search concen-
trates at early state of search, which negatively affects
on the performance of ACO. It will lead to premature
stagnation of the search. Search stagnation is pro-
posed in (Dorigo, 1996) as the situation where all ants
follow the same path which is generated by other ants
and construct the same path over and over again, in a
sense, there are no new paths will be found anymore.
Map matching algorithm has been used for mobil-
ity prediction. Ren and Karimi developed the map
matching algorithm through using other techniques
such as Markov chain, hidden Markov fuzzy logic
to improve the mobility prediction for wheelchair.
In (Ren and Karimi, 2009a), the map matching al-
gorithm has been developed through its dependence
on the Markov chain and GPS sensor. The distance
and the direction between points which are recorded
by GPS are used. Prediction of the direction of
wheelchair users in sidewalk is considered as the out-
come from (Ren and Karimi, 2009a; Ren and Karimi,
2009b; Ren and Karimi, 2011).
The map matching techniques area proposed in
(Ren and Karimi, 2011; Ren and Karimi, 2009b;
Ren and Karimi, 2009a) suffered from many major
drawbacks. All of them are tested and evaluated for
wheelchair only in university camps sidewalk and it
works in outdoor only. These techniques are based
on GPS navigators. Therefore, anyone who needs to
use them must have GPS sensors. However, the GPS
sensors lead to extra physical cost bearing in mind
that they may not be applicable for all mobile devices.
ICAART2013-InternationalConferenceonAgentsandArtificialIntelligence
420

Moreover, GPS suffers from inaccurate data in narrow
roads, high building and is believed to use higher-end
GPS relievers to improve the signal, instead of low-
end.
A new Splitting-based Displacement Predic-
tion Approach for Location-Based Services (SDPA)
(Daoud et al., 2011) has been developed to improve
prediction rate, minimizes consumption of resources,
and the overall cost of the location management pro-
cess comparing with PLM. Also, the SDPA reduces
the service area and the number of predicted routes
during the mobile user trip, by dividing the cell
into eight equivalent regions. Thus, the SDPA ap-
proach improved the location prediction probability
over PLM. The average complexity requirements for
usage space are smaller than for the PLM approach.
In addition, these techniques still work on cell level
which the cost of messages passing and executions
time are highly, because the SDPA and PLM executed
in tightly time slot.
3 EACORA TECHNIQUE
This section presents a EACORA. This technique is
based on a third generation mobile network, such as
UMTS.
3.1 EACORA Principles
The EACORA based on the responsibility to the RA
component instead of using the mobile user or cell.
This avoids the computation power required at mo-
bile users, which could be prettier, since power and
resource limitations are obstacles for mobile manu-
factures.
Figure 1: Routing Area Coverage.
The SGSN is managing the RA, each RA contains
one or more cells based on the radio specifications and
geographical features, as shown in figure 1.
The SGSN is responsible for managing and up-
dating the history displacements for all mobile users
which are residing in. Moreover, it handles the pre-
diction model to predict the next displacement for the
mobile user according to the current location, history
displacements and visibility to surround neighbors.
When a mobile user enters network, the SGSN
uses his and neighbors’ histories to make a relation
between them. Thus, improving the prediction per-
centage and handling any unusual movement. In con-
trast, if SGSN does not contain the history displace-
ments for the mobile user, it should use the history of
his neighbors.
Each RA is modeled by an ant colony and each
mobile user is modelled by an ant. An ant goes from
current RA to neighboring RA looking for food. In
the food searching, the ant prefers to go through the
usual paths or according to the displacement of his
neighbors.
3.2 EACORA Prediction
When a registration to the network is made for a mo-
bile user, the SGSN creates an ant to represent the
mobile user. Whilst, moving the ant will deposit a
pheromone on RA, this would be considered as the
communication channel between all ants in the cellu-
lar communications network.
At the first entrance of mobile users to the net-
work, no pheromone would be found from any neigh-
bour, that’s why the movement goes randomly.
Over the time, each RA has its pheromone which
guides mobile users to the most preferable RA for the
future displacement.
Finding the probability of each RA, the previous
mobile user’s visibilities and the intensities of the
pheromones for all adjacent neighbours are required.
Suppose Ph is a vector of pheromone from 1 to A,
where A stands for the number of adjacent RAs. The
probability for the mobile user from current RA C
RA
-
th to j RA expressed in equation 1.
P
C
RAi, j
(t) =
[τ
C
RAi j
(t)]
α
∗ [V
allC
RA
i j
(t)]
β
∑
u∈Ph
A
(i)
[τ
iu
(t)]
α
∗ [V
all
iu
(t)]
β
(1)
Where P
C
RAi, j
the probability that the mobile user
at RA i at time t to RA j , t is the time factor,
τ the pheromone level and V
all
is the visibility -
memorization- of the mobile user. The visibility here,
V
all
, is obtained from the combination between local
and global visibility, accodring to euqation 2.
V
all
= P ∗ V
L
+ (1 − P) ∗ V
G
(2)
Where P between 0 and 1, V
L
is the local visibility
and V
G
is the global visibility.
Memorization entity is used to calculate the visi-
bility variable (V), it is represented by a vector (n) and
its length based on the number of adjacent RAs A
RA
.
An element of this vector either local or global repre-
sents the ant visibility of an adjacent RA. In a sense,
AnEnhancedAntColonyOptimizationforRoutingAreaMobilityPredictionoverCellularCommunicationsNetwork
421

the local memorization reflects the mobile user’s be-
haviour. Where, global memorization reveals all mo-
bile users’ behaviours at such RA. The local visibility
is managed by equation 3.
V
L
=
X +1 if the mobile user exists in Nr;
X = 1 if mobile user does not exist in Nr;
(3)
Where V
L
is a local visibility, L between 1 and
A
RA
, X is a value starts from 1 and Nr is a local mem-
orization table which stores the adjacent RAs. Mean-
while, the global visibility is represented by equation
4
V
G
=
Y + 1 if the mobile user exists in Mr ;
Y = 1 if mobile user does not exist in Mr;
(4)
V
G
is a global visibility, G between 1 and A
RA
for
each mobile user, Y start from 1, Mr is a global mem-
orization table which stores the adjacent RA, where
each mobile affects on this equation.
When a hard hand-off occurs for a mobile user,
the mobile user changes the RA to another one. At
this time, the mobile user deposits his pheromone
on the RA which has been just left. The amount of
pheromones is deposited on each RA represented by
equation 5.
∆τ
i, j
=
λ ∗ Q ∗ τ
staying in
if λ ∗ Q ∗ τ
staying in
< Q
Q if λ ∗ Q ∗ τ
staying in
>= Q
(5)
Where ∆ τ
i, j
is the pheromone quantity that would
be laid down on the RA by the mobile user when he
left RA i to RA j. Q is a constant which represents the
maximum quantity of pheromone that would be laid
on each RA. The value of Q is greater than zero > 0.
τ
staying in
is the time that has been spent by the mobile
user in RA i, λ is a constant fraction which value is
0 < λ < 1. λ is used to prevent the pheromone amount
that has been laid from exceed the Q value since this
amount proportional increases over time.
When the value of ∆ τ
i, j
is less than Q, the mobile
user’s pheromone affects the pheromones that held by
RA in a proportional to the time spent in that RA. If
∆ τ
i, j
greater than or equal to Q, the mobile user is
spending very long time in the RA, that means the
mobile user is working or living there, this leads to
have pheromone quantity greater than Q, therefore the
quantity will lay down is all Q, to avoid the bias of the
quantity that may laid down and stagnation of search.
In EACORA after δT the evaporation process will
take a place to decrease the pheromone level at each
RA in the network, this is represented by equation 6.
τ
acc RA
i
(t + 1) = τ
acc RA
i
(t) ∗ (1 − ρ) (6)
Where τ
acc RA
i
(t) represents the accumulative
pheromones in RA i, (1 − ρ) is the evaporation rate.
A small value of ρ carrying out to pheromone
evaporation slowly and the pheromone will accumu-
late more on a RA. A large value of ρ leads to forget
the behaviour of other mobile users and the prediction
turns into random way. In a case when ρ is equal 1 the
prediction becomes completely random. The value of
ρ affects on the prediction rate by permitting to forget
the behaviour of the elder mobile users and to remove
the bias mobile users’ behaviour.
Probabilities of all RAs that surround the RA
where the mobile user resides in are calculated in
equation 1, the highest probability would be taking in
consideration as next RA that mobile user will visit.
Hence, the next displacement is expressed in equation
7.
Next
RA
= max(P
C
RAi, j
(t)) (7)
Where Next
RA
is the next displacement.
4 DISCUSSION OF SIMULATION
AND RESULTS ANALYSIS
4.1 Parameter Setup and Environment
A simulator was created using Java programming lan-
guage for the EACORA, in which the algorithm based
on The developed ant colony model is implemented
and tested. Each experiment consisted of 10 different
iterations to improve accuracy. Each experiment took
five hours, as shown in table 1.
Table 1: Simulation Parameters.
Parameter Value
Number of cells 100
Cell radius 250 m
Transmission Rate 8 Mbps
Simulation time 18000 s
Iterations 10
Pause time 20 s
Velocity of UE
Slow Pedestrian 5.6 k/h
Fast Pedestrian 11.2 k/h
Slow Vehicle 44.8 k/h
Fast Vehicle 89.6 k/h
4.2 Experiments and Result Analysis
The experiments in this section made to obtain the op-
ICAART2013-InternationalConferenceonAgentsandArtificialIntelligence
422
timal value for each parameter; the parameters were
tested to evaluate the RA mobility prediction tech-
nique, which include: Parameter-1:the factor which
affects on evaporation rate. Parameter-2: quantity
of the initial pheromone that would be laid on each
RA. Parameter-3: calculating the participation ra-
tio of local visibility compared with global visibility.
Parameters-4: determining the effectiveness ratio be-
tween pheromone and visibility, which represented by
α and β.
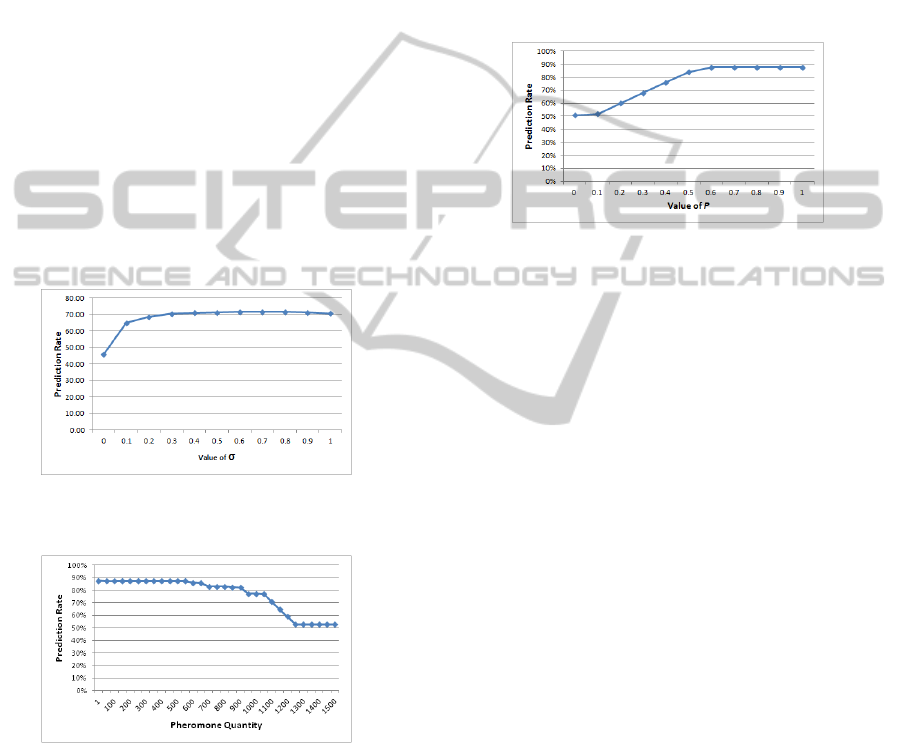
For parameter 1, the prediction rate is tested over
varied evaporation rates. Figure 2 shows the predic-
tion rate percentage over the change on factor ρ. The
experiments were carried out on a range of ρ between
[0, 1], where its increment was moved up by 0.1.
From the experiments depict the optimal values of ρ
were between 0.6 and 0.8 where the highest predic-
tion rates were achieved over the change on ρ. These
values encouraged the RA developed mobility predic-
tion technique to avoid search stagnation, finding new
solutions and prevent the deletion of any new solu-
tion.
Figure 2: Prediction rate according to the different values
of ρ.
Figure 3: Prediction rate over varied initial pheromone
quantities.
For parameter 2, the prediction rate over varied
initial pheromone quantities is examined. Figure 3
describes the initial pheromone quantity that would
be laid down on each RA before starting the run-
ning of the technique. The prediction rates between
88 and 53 over varied amounts of pheromone quan-
tity. The highest prediction rate was 88 when the
amounts of pheromone setup to 1, as a result the best
amount of pheromone to be laid down was 1 unit. The
use of small amount of initial pheromone would save
computation cost. For showing the effectiveness of
pheromone quantity that will lay down during the run-
ning of the algorithm the next parameter is addressed.
For parameter 3, the significant combination of
local and global visibility for the mobile user is vali-
dated. Figure 4 shows the prediction rate according to
the changing between local and global visibility par-
ticipations. Based on equation 2 two values should be
avoided in order to utilise these two concepts, these
values are 0 and 1.
Figure 4: Prediction rate according to the changing values
of P.
When the value of P equals to zero, the local vis-
ibility would be eliminated that means the RA will
use the neighbours’ heuristic information to predict
the next displacement for a mobile user. Thus the mo-
bile user cannot visit any of its favourites RA. In other
words, the mobile user displacements would be pre-
dicted randomly.
To achieve balancing between local and global
visibility, P was set to 0.6. This value guarantee a
full participation of both local and global visibility, as
well as better prediction rate would be obtained, see
figure 4.
For parameter 4, the prediction rate is tested over
varied distance between alpha and beta. Figure 5
shows the effect that resulted from varying the val-
ues of alpha and beta in order to determine the best
values to gain the highest prediction rate. As shown
in figure 5, it was noticed that when both Alpha and
Beta were equalled the prediction rate was highest.
Therefore, both Alpha and Beta are going to be cho-
sen according to the results, meaning that the values
of Alpha should be chosen to be equal to values of
Beta to achieve better prediction rates.
5 CONCLUSIONS AND FUTURE
WORK
This paper introduced new routing area displacement
prediction technique for location based services. This
technique is based on developed ant colony Optimiza-
AnEnhancedAntColonyOptimizationforRoutingAreaMobilityPredictionoverCellularCommunicationsNetwork
423
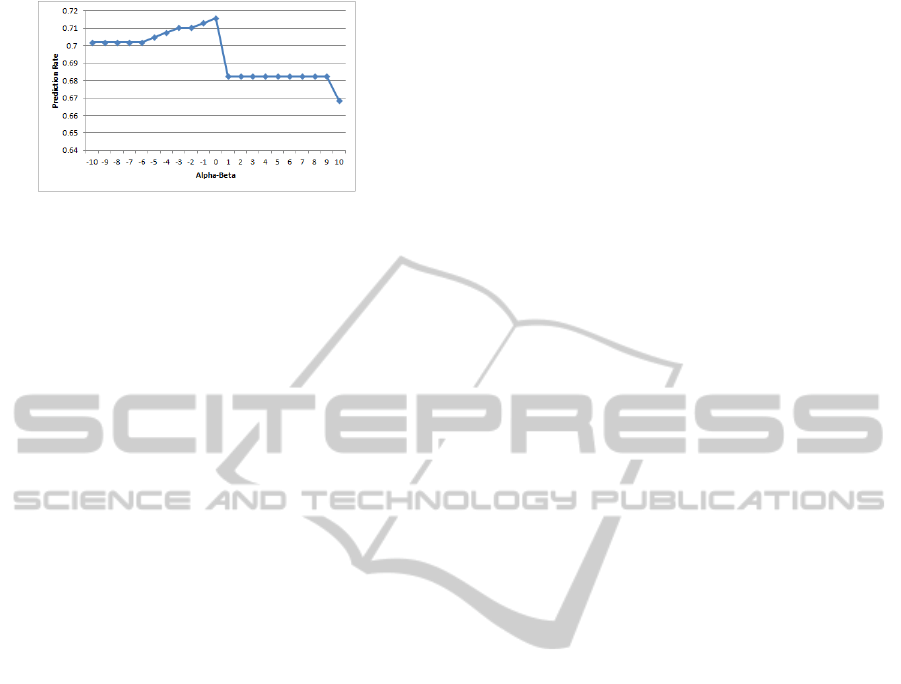
Figure 5: Prediction rate according to the varied Alpha-
Beta.
tion which achieved a high prediction rate up to 88%.
In addition, this paper has obtained the optimal values
for all the parameters that improve the prediction rate
and reduce the complexity. More work needs to be
carried out, for example the different number of mo-
bile users effect on using the new technique have to
be tested. In addition, the effect of the mobile users’
history, complexity time and memory usage with the
current techniques.
REFERENCES
Barbar, D. (1999). Mobile computing and databases-a sur-
vey. IEEE Transactions on Knowledge and Data En-
gineering, 11:108–117.
Capka, J. and Boutaba, R. (2004). Mobility Prediction in
Wireless Networks Using Neural Networks, volume
3271/2004. Springer Berlin / Heidelberg.
Daoud, M., Ayesh, A., Hopgood, A., and Al-Fayoumi, M.
(2011). A new splitting-based displacement predic-
tion approach for location-based services. In Systems,
Man, and Cybernetics (SMC), 2011 IEEE Interna-
tional Conference on, pages 392 –397.
Daoui, M., M’zoughi, A., Lalam, M., Belkadi, M., and
Aoudjit, R. (2008). Mobility prediction based on an
ant system. Comput. Commun., 31(14):3090–3097.
Das, S. and Sen, S. (1999). Adaptive location prediction
strategies based on a hierarchical network model in a
cellular mobile environment. In The Computer Jour-
nal, volume 42, pages 473–486.
Deneubourg, J.-L. and Goss, S. (1989). Collective patterns
and decision making. Ethology, Ecology and Evolu-
tion, 1(4):295–311.
Deneubourg, J.-L., Pasteels, J. M., and Verhaeghe, J. C.
(1983). Probabilistic behaviour in ants: A strategy of
errors? Journal of Theoretical Biology, 105:259–271.
Dorigo, M., Bonabeau, E., and Theraulaz, G. (2000). Ant
algorithms and stigmergy. Future Gener. Comput.
Syst., 16(9):851–871.
Dorigo, M. and Di Caro, G. (1999). The ant colony op-
timization meta-heuristic. McGraw-Hill Ltd., UK,
Maidenhead, UK, England.
Dorigo, M.; Maniezzo, V. C. A. (1996). Ant system: op-
timization by a colony of cooperating agents. IEEE
Transactions on Systems, Man, and Cybernetics Part
B: Cybernetics, 26:29 – 41.
Dorigoa, M. and Gambardella, L. M. (1997). Ant colonies
for the travelling salesman problem. Biosystems,
43(2):73–81.
Holma, H. and Toskala, A. (2001). Wcdma for umts: Radio
access for third generation mobile communications. In
Transactions on Networking, volume 9, pages 790–
800, New York, NY, USA. John Wiley and Sons.
J. Biesterfeld, E. E. and Jobmann, K. (1997). Location pre-
diction in mobile networks with neural networks. In
the International Workshop on Applications of Neural
Networks to Telecommunications, pages 207–214.
Kubach, U. (2000). A map-based, context-aware
hoarding mechanism. In Berichtskolloquium des
Graduiertenkollegs Parallele und Verteilte Sys-
teme,University of Stuttgart, Germany.
Kumar, B. P. V. and Venkataram, P. (2002). Prediction-
based location management using multilayer neural
networks. In Journal of Indian institute of science,
pages 7–21.
Lu, S.-C. L. H.-C. (2003). Applied neural network for lo-
cation prediction and resources reservation scheme in
wireless networks. In International Conference on
Communication Technology Proceedings, 2003, ICCT
2003, IEEE, volume 2, pages 958 – 961.
Ren, M. and Karimi, H. (2011). A fuzzy logic map match-
ing for wheelchair navigation. GPS Solutions, 15:1–
10. 10.1007/s10291-011-0229-5.
Ren, M. and Karimi, H. A. (2009a). A chain-code-based
map matching algorithm for wheelchair navigation.
Transactions in GIS, 13(2):197–214.
Ren, M. and Karimi, H. A. (2009b). A hidden markov
model-based map-matching algorithm for wheelchair
navigation. The Journal of Navigation, 62(03):383–
395.
S.Goss, R.Beckers, J. S.-J. (1990). How trail laying and
trail following can solve foraging problems for ant
colonies. in Behavioural Mechanisms of Food Selec-
tion, R.N.Hughes ed., NATO-ASI Series, G20:0.
Shah, S. H. and Nahrstedt, K. (2002). Predictive location-
based qos routing in mobile ad hoc networks. In
IEEE International Conference on Communications
(ICC ’02), volume 2, pages 1022–1027, New York,
NY, USA.
U, K. and Rothermel, K. (2000). An adaptive, location-
aware hoarding mechanism. In Proceedings. ISCC
2000. Fifth IEEE Symposium on Computers and Com-
munications, pages 615–620, Antibes-Juan les Pins,
France.
ICAART2013-InternationalConferenceonAgentsandArtificialIntelligence
424
