
Unsupervised Light Spot Detection using Background Subtraction
Takaya Niwa and Kazuhiro Hotta
Meijo University, 1-501 Shiogamaguchi, Tempaku-ku, Nagoya 468-8502, Japan
Keywords: Light Spot Detection, Wnt-3a, Intracellular Images, Robust Statistics, Background Estimation.
Abstract: Live cell imaging has been developing rapidly by the development of the microscope and fluorescence
technique. Light spot detection in intracellular image is important for elucidation of form of morphology of
animal. However, light spots are detected manually now, and human can not treat a large number of images.
If automatic detection by computer is realized, we can obtain many objective data, and it will be useful for
the biology development. In general, supervised learning is useful to develop a good detector. However,
many particles are included in an intracellular image, and it is difficult to make a lot of supervised samples.
Therefore, in this paper, we propose a light spot detection method based on unsupervised learning.
Concretely, we use background subtraction and robust statistics to detect the light spots. In experiments
using Wnt-3a images, the proposed method outperforms ImageJ which is usually used in cell biology.
1 INTRODUCTION
According to the development of fluorescence
technique as GFP and microscope, we can get large
number of intracellular images (Sakaushi et al.,
2007; Sugimoto et al., 2010). It is expected to
elucidate the form of morphology of animal.
However, light spot detection in intracellular images
by computer is a new research field, and the
automatic detection methods are still little. Thus,
light spots are detected manually now, and we need
a lot of effort to obtain reliable data. This task
wastes a lot of time and heavy burden of physically
and mentally. In addition, the data becomes
subjective. To solve these problems, we develop
automatic detection based on robust statistics.
Wnt family of secreted signaling proteins has an
important role in situation of embryogenesis
(Takada et al., 2006). Wnt is one of signaling
proteins. It involves cell's life and development.
When the cell composed of multi-cellular organisms
transfers the information from cell to cell, it secretes
Wnt. The information transferred by Wnt is called
Wnt signaling. It is essential signal made in various
tissues of animals. However, if it is much
transferable, cells are canceration. Therefore,
properly controlling the secretional capacity of Wnt
is important for treatment of cancer. However, we
have not understood it yet. We require the detection
and tracking method of signaling proteins from large
number of intracellular images. We also need
statistical analysis which is independent of
subjectivity of observer. Thus, we propose light spot
detection in Wnt-3a (Shibamoto et al., 1998) images
by computer.
The sizes and shape of the Wnt-3a in images are
inconsistent. In general, supervised learning is used
to develop a good classifier (Kumagai, 2012).
However, it is not easy to make a lot of supervised
data by specialists. It wastes a lot of effort and time.
In addition, intracellular image includes a lot of
noises as shown in Figure 2(a), and there are also
light spots as small as 1 pixel. Therefore it is
difficult for specialist to distinguish between noises
and small right spots. In fact, we could get only 3
images with ground truth. Thus, we propose the
method for detecting Wnt-3a by background
subtraction in which supervised information is not
required. Since the images used in experiments were
captured at long interval, we can not use sequential
information to estimate the background (Shimai et
al., 2007). To estimate the background from only
one test image, we use median of a local region. We
compute the difference between the estimated
background and test image, and light spots are
emphasized. To detect the light spots from the
difference image, LMedS and binarization are used.
In experiments, Wnt-3a images obtained by
National Institute for Basic Biology are used. The
accuracy is evaluated by using 3 images with ground
518
Niwa T. and Hotta K. (2013).
Unsupervised Light Spot Detection using Background Subtraction.
In Proceedings of the 2nd International Conference on Pattern Recognition Applications and Methods, pages 518-521
DOI: 10.5220/0004201205180521
Copyright
c
SciTePress

truth by a specialist. In general, evaluation with only
3 images is not sufficient. However, in a Wnt-3a
image, many light spots are included as shown in
Figure 4. Thus, we consider that the evaluation is
sufficient. The accuracy of our method achieves
85.28%. This is much better than ImageJ
(
http://rsbweb.nih.gov/ij/) which is used in cell
biology.
Section 2 explains the light spots detection by
robust statistics (Huber, 1981). In section 3,
experimental results one shown. Conclusions and
future works are described in section 4.
2 LIGHT SPOT DETECTION AND
NOISE REDUCTION
First, we estimate a background image from only an
input image, and we perform background subtraction
to emphasize the Wnt-3a. The Wnt-3a is detected
from the difference image by using the robust
statistics. However, since there are many noises
which are similar to Wnt-3a, noises are also detected
as Wnt-3a. Thus, it is difficult to detect the light
spots by only one step and by Otsu's binarized
method after candidates of light spots are detected
by background subtraction.
In the following sections, we explain the details
of our method.
2.1 Background Estimation
It is the best that we prepare the background image
without foreground in advance. However, in Wnt-3a
images, the background regions are also changed
and we can not prepare the background image in
advance. We can not use the sequential information
too. Therefore, we make a background image from
only one test image by median filter. In experiments,
we apply a median filter with the size of 9 x 9 to the
test image to estimate the background.
Foreground such as light spots are emphasized
by subtracting the estimated background image from
the test image. To classify the foreground and
background, good threshold value is required.
However, adequate threshold value is changed for
every image. Therefore, the threshold is determined
by Least Median of Squares (LMedS) which is one
of robust statistics. Since the area of background is
larger than that of foreground, the inlier becomes
background and outlier becomes foreground.
2.2 Light Spot Detection using Robust
Statistics
We use LMedS (Rousseeuw, 1984) to classify
foreground and background. LMedS is more robust
to outlier than least squares. In LMedS, the
estimation result does not so change if the ratio of
outlier is below 50 percents.
Next, we describe how to use LMedS criteria.
We calculate difference image between test image
and the estimated background image. Next, we
calculate the median d
medd
in the
difference image. The standard deviation of error
distribution is computed by using the median as
σ
1.48261
5
M1
d
,
(1)
where M is number of pixels in the image, and
1.4826 is a coefficient which error distribution
normal distribution is in accordance with normal
distribution. 5/(M-1) is a correction term for small
number samples. We determined outlier (light spot
candidates) as d
2.5σ.
2.3 Noise Reduction
There are a lot of noises in images of Wnt-3a. Since
only background subtraction can not classify noises
and light spots, we distinguish the noises and light
spots by Otsu’s binarized method (Otsu, 1979) after
LMedS. However, there are noises with higher
intensity than light spot. Therefore, if we use Otsu’s
binarized method instead of LMedS, light spots are
not detected well. Since there are small light spots
with 1 pixel. We can not use the morphological
operation. To classify noise and Wnt-3a, we pay
attention to the neighboring intensities because noise
is always the spike and the intensities of neighboring
region is not large. Figure 1 shows the noise and
light spot. Figure shows the neighboring pixels of
noise have low intensity. Therefore, we compute
average intensity of a local 3 x 3 region whose
center is the point detected by background
subtraction. The average intensities in 3 x 3 pixels
are fed into Otsu's binarized method, and we detect
light spots with unsupervised manner.
Figure 1: Comparison between around noise and light spot.
(a) noise. (b) light spot.
(a) (b)
UnsupervisedLightSpotDetectionusingBackgroundSubtraction
519
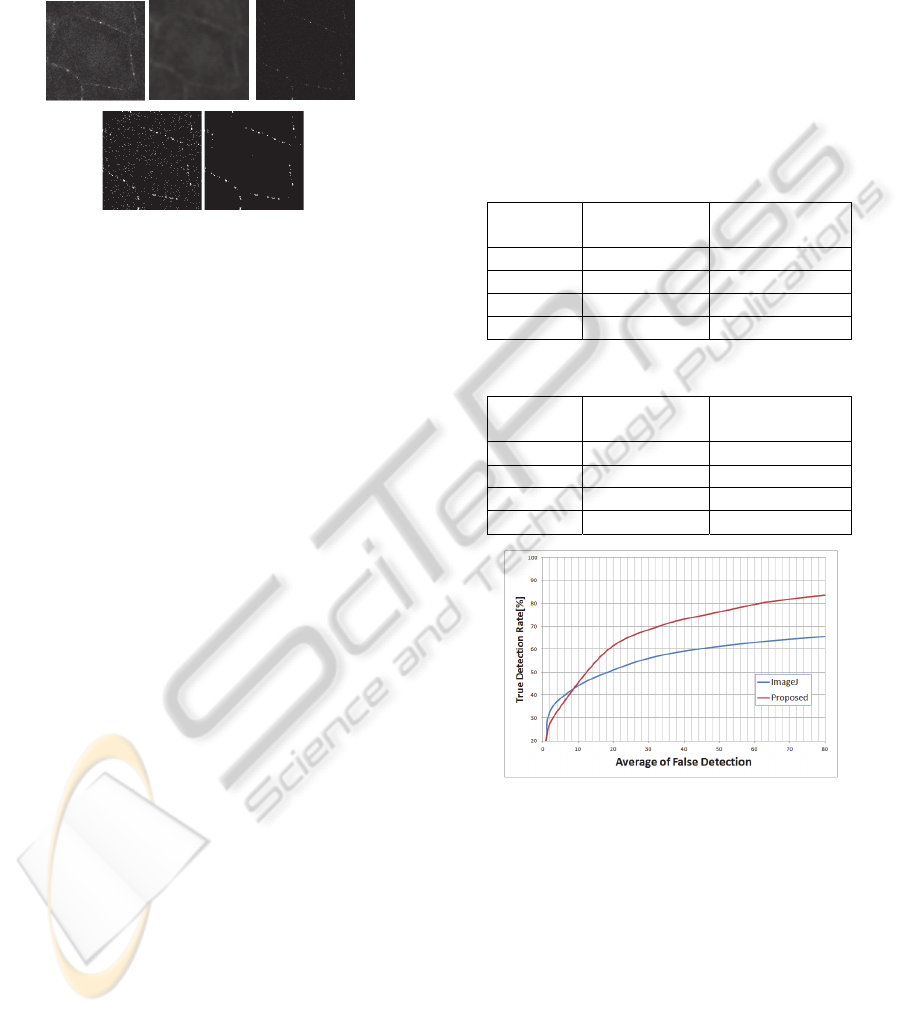
Figure 2 shows the overview of our approach.
Figure 2 (a) and (b) are an input image and
estimated background image. Figure (c) shows the
difference image between (a) and (b). Figure (d) and
(e) show the result of LMedS and final result.
Figure 2: The flow of light spot detection. (a) Input image.
(b) Estimated background image. (c) Difference image. (d)
Result of LMedS. (e) Final result by Otsu binalization.
3 EXPERIMENTS
Effectiveness of our method is shown by
experiments. In section 3.1, we describe image
dataset. Section 3.2 shows experimental setting and
results.
3.1 Wnt-3a Image Dataset
We use 3 intracellular images with Wnt-3a obtained
by Takada laboratory in National Institute for Basic
Biology. The images with ground truth are only 3,
and we used given by a specialist 3 images for
evaluation. In general, the evaluation using 3 images
is not sufficient. However, the number of light spots
in an image is large, and we consider that the
evaluation is sufficient to evaluate the effectiveness.
The size of images is 696 x 525 pixels. Example of
image is shown in Figure 2 and 4. The image is the
Wnt-3a which is generated by entering the mRNA in
egg. The size and shape of light spots are different.
About 200 light spots are included in an image.
3.2 Result
We compare the proposed method with ground truth
position of Wnt-3a obtained by specialist. We judge
that it is correct if the detected point is included in 5
x 5 pixels around ground truth. Table 1 shows
evaluation results. Accuracy rate of proposed
method achieves 85.28%. Even though the number
of false positive is not so small. Figure 4 shows the
example of detection result. Figure 4(a) shows
ground truth with red square. Figure 4(b) shows our
result in which almost light spots are detected.
Next, our method is compared with ImageJ
which is frequently used in cell biology. The result
by ImageJ is shown in Table 2. Accuracy rate of
ImageJ achieves only 66.85% when the average
number of false positive same as our method and the
parameter “Noise tolerance” was set to 45. ROC
curve is shown in Figure 3. Our method obviously
better than ImageJ. Figure 4(c) shows detection
result by ImageJ in which the detected light spots are
indicated by yellow crosses. ImageJ failed to detect
many light spots.
Table 1: Result of proposed method.
Accuracy
rate[%]
Number of false
positive
Image 1 87.91 141
Image 2 85.06 72
Image 3 82.86 72
Average 85.28 95
Table 2: Result of ImageJ.
Accuracy
rate[%]
Number of false
positive
Image 1 68.13 182
Image 2 71.84 76
Image 3 60.57 27
Average 66.85 95
Figure 3: ROC curve of proposed and ImageJ.
As shown in Figure 4, the accuracy of our
method is high and the problem is the false positive.
When the intensity of background is high as shown
in Figure 5, noises are detected as light spots
because we assume that neighboring region of noise
is low intensity. When intensities of neighboring
region in background are large, average intensity
value becomes large. Almost false positive are those
kinds of errors. Figure 6 shows the ground truth and
the result by our method. Our method detected 3
light spots in 5 correct light spots. We consider that
difference of intensity between light spot and
(a) (b) (c)
(d) (e)
ICPRAM2013-InternationalConferenceonPatternRecognitionApplicationsandMethods
520
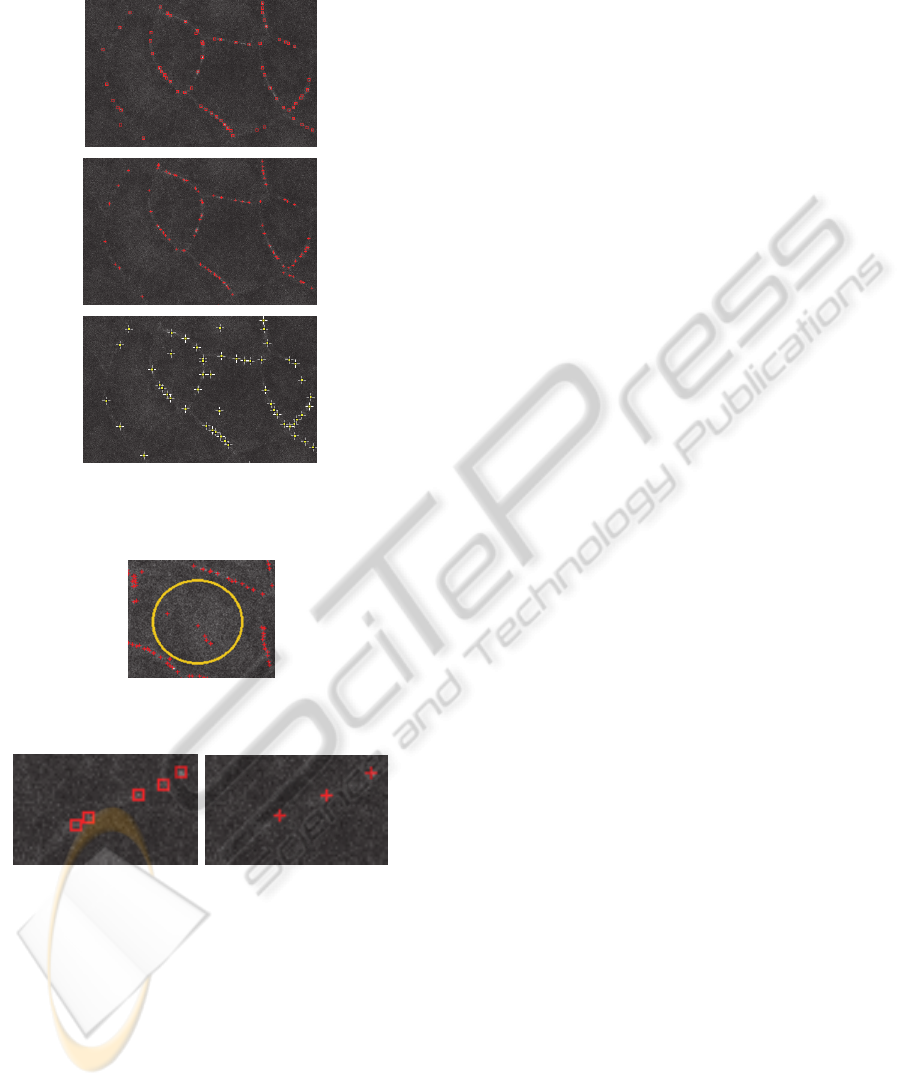
background is very small. Almost of all false
negative are those kinds of errors.
Figure 4: Example of light spot detection. (a) Ground truth
by a specialist. (b) Detection result of (a) by the proposed
method. (c) Detection result of (a) by the ImageJ.
Figure 5: Example of high intensity background. There are
no light spots in circle in fact.
Figure 6: Example of false negative. (a) Ground truth. (b)
Result of (a).
4 CONCLUSIONS
In this paper, we proposed unsupervised light spot
detection based on background subtraction because
development of supervised data is time-consuming.
The accuracy of proposed method is high while the
number of false positive is not small. The research
field of intracellular image processing has started in
recent years, there is little conventional method.
Therefore, we can not compare except for ImageJ.
Our method outperformed ImageJ and can detect
light spots with various shape and size. However
there are still some problems as
1. When the intensity of background is high, noises
are detected as light spots.
2. When intensity of background and light spot are
similar, detection is difficult.
The current method used only local region with 3 x
3 pixels. Namely, we pay attention to only a light
spot now. One way is to use the neighboring
contextual information around a light spot. If we use
the neighboring information around a light spot, the
computer may train the context information
automatically. This is a subject for future works.
ACKNOWLEDGEMENTS
We would like to thank Prof. Shinji Takada and Kei
Nakayama at National Institute for Basic Biology.
This work was supported by KAKENHI
No.23113727.
REFERENCES
Huber, P, J., (1981). Robust Statistics. John Wiley & Sons.
ImageJ http://rsbweb.nih.gov/ij/
Kumagai, S. Hotta, K., (2012). Counting and Radius
Estimation of Lipid Droplet in Intracellular Images.
Proc. of IEEE International Confference on Systems.
Man and Cybernetics, pp.67-71.
Otsu, N., (1979). A threshold selection method from gray-
level histograms. IEEE Trans. on System, Man, and
Cybernetics, Vol.SMC-9, No.1, pp. 62-66.
Rousseeuw, R, J., (1984). Least median of squares
regression. Journal of American Statistics Association,
79, pp. 871-880.
Sakaushi, S. et al., (2007). Dynamic behavior of FCHO1
revealed by live-cell imaging microscopy: it's possible
involvement in clathrin-coated vesicleformation.
BiosciBiotechnolBiochem, 71, 7, pp. 1764-1768.
Shibamoto, S. et al., (1998). Cytoskeletal reorganization
by soluble Wnt-3a protein signaling. Genes Cells 3,
pp.689-670.
Shimai, H. et al., (2007). Adaptive background estimation
based on robust statistics. Systems and Computers in
Japan, vol. 38, pp. 98-108.
Sugimoto, K. & Tone, S., (2010). Imaging of mitotic cell
division and apoptotic intra-nuclear processes in
multicolor. Methods Mol. Biol, 591, pp. 135-146.
Takada, S. et al., (2006). Monounsaturated fatty acid
modification of Wnt protein: its role in Wnt secretion.
Dev. Cell 11, pp. 791.
(b)
(c)
(a) (b)
(a)
UnsupervisedLightSpotDetectionusingBackgroundSubtraction
521
