
On the Implementation of Servers for Large Scale CAR Systems based
on Mobile Phones
V´ıctor Fern´andez, Juan Manuel Ordu˜na and Pedro Morillo
Departamento de Inform´atica, University of Valencia, Valencia, Spain
Keywords:
Collaborative Augmented Reality, Mobile Phones.
Abstract:
This paper presents the experimental comparison of different server implementations for CAR systems based
on mobile phones. The results show that the UDP-based implementation provides a significant improvement
in system throughput, supporting more than one thousand client devices at interactive rates, at the cost of
loosing a very small percentage of updating messages.
1 INTRODUCTION
From the beginning of AR systems, the potential
of collaborative AR (CAR) systems was exploited
for different activities such as Collaborative Com-
puting (Billinghurst et al., 2000) or Teleconferencing
(Billinghurst and Kato, 1999). Wearable devices were
used to provide CAR systems, where a wearable AR
user could collaborate with a remote user at a desktop
computer (Hallerer et al., 1999). On other hand, mo-
bile phones have become an ideal platform for CAR
systems, due to the multimedia hardware that they in-
clude. As an example, Figure 1 shows a CAR system
developed for collaborative training in industrial elec-
tricity. It shows on the left image the execution of the
CAR tool on a Samsung Galaxy NOTE mobile phone,
while the image on the center shows a real image of
the the panelboard where technicians collaboratively
operate, and the right image shows the execution of
the CAR tool on a HTC Nexus One mobile phone.
Figure 1: Example of a CAR application developed for
training in industrial electricity.
The wide variety of current mobile phones, with
different graphic and processing capabilites, and dif-
ferent operating systems, can have significant effects
on the performance of a large-scale CAR system, in
terms of system latency, frames per second or num-
ber of supported clients with certain latency levels.
In previous works, we have characterized the behav-
ior of different mobile phones and the server when
used in Collaborative Augmented Reality applica-
tions, (Bauset et al., 2011; Bauset et al., 2012). The
results showed that CAR systems throughput heavily
depends on the kind of client devices, but for certain
kind of devices, the system bottleneck is the server
I/O.
In this paper, we propose a comparative study of
different implementations of the CAR server, in order
to improve the performance of CAR systems based on
mobile phones. The performance evaluation results
show the UDP-based implementation provides a sig-
nificant improvement in system throughput with re-
spect to other implementations, supporting more than
one thousand clients at interactive rates (twice the
number of supported clients of the TCP implemen-
tation). This improvement is achieved at the cost of
loosing a very small percentage of updating messages
but the effects of these dropped messages cannot ex-
pand beyond some jitter (bounded within a short pe-
riod of time) in a reduced number of clients.
2 SERVER IMPLEMENTATIONS
We have developed a multithreaded CAR server that
supports simulated clients (simulated mobile devices)
with the behavior measured in our previous work
381
Fernández V., Orduña J. and Morillo P..
On the Implementation of Servers for Large Scale CAR Systems based on Mobile Phones.
DOI: 10.5220/0004204203810384
In Proceedings of the International Conference on Computer Graphics Theory and Applications and International Conference on Information
Visualization Theory and Applications (GRAPP-2013), pages 381-384
ISBN: 978-989-8565-46-4
Copyright
c
2013 SCITEPRESS (Science and Technology Publications, Lda.)
(Bauset et al., 2011). The system configuration con-
sists of this server and a certain amount of mobile de-
vices that are scanning the visual space of their video
camera looking for a marker that will be converted
into a 3D object in their display. After each updating
of the object location, the mobile device sends a loca-
tion update message (containing the new location) to
each of its neighbor devices. The neighbor devicesare
those who participate in the same collaborative task,
and we have denoted this set of neighbor devices as
a working group. The messages are sent through the
server (that is, it sends the location update message to
the server, and then the server re-sends the message to
the appropriate clients). For performance evaluation
purposes, the destination clients return an acknowl-
edgment message (ACK) to the server, which, in turn,
forwards it to the source client.
The system latency provided for each location up-
date is computed by recording a timestamp when the
first message is sent to the server. Next, a second
timestamp is recorded with the last ACK message for
that location update received from the server. The sys-
tem response time is computed by subtracting these
two timestamps. The server response time is com-
puted by timestamping both each message forwarded
from each client and the reception of the correspond-
ing ACK message from the destination client. Also,
the percentage of CPU utilization is measured both in
the server and the mobile devices every half second.
2.1 TCP Implementation
The simulator starts generating a Server Process, and
for every 50 clients it generates a Client Process. Fig-
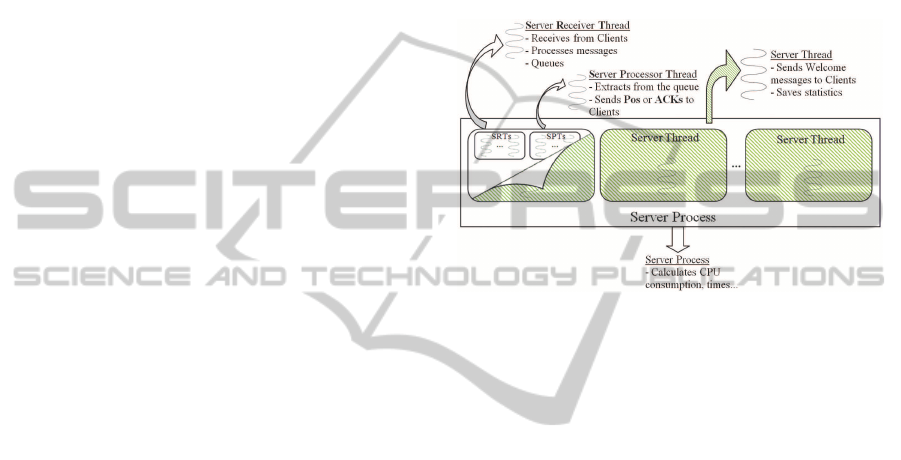
ure 2 illustrates the general scheme of the Server Pro-
cess. This process starts listening connections, and
for each connection it generates a new array of X TCP
sockets, where X is the number of clients that will be
within a given working group. When all the clients
have connected to the Server Process (the population
size is a simulation parameter) then the Server Process
generates as many Server Threads as needed. Each
Server Thread is in charge of managing all the clients
within a working group. Concretely, it starts the simu-
lation by sending a welcome message to all the client
sockets. When the simulation finishes, it collects
statistics from all the clients in its working group. But
the most important task performed by server threads
is the generation of two threads for each of the clients
in the working group: the Server Receiver Thread
(SRT) and the Server Processor Thread (SPT). The
SRT associated to client i receives the location up-
date messages from the client i. Next, it computes
the correct destination clients (the neighbor clients,
that is, the clients within the same working group)
and it generates messages that will be stored in the
queues of the Server threads managing these neigh-
bor clients. The SPT associated to client i extracts the
queued messages that the SRTs associated to other
clients may have generated for client i, and it sends
them to this client. Additionally, the server process
collects and processes the statistics generated by the
server threads, and it also measures the percentage of
CPU utilization.
Figure 2: General scheme of the server process in the TCP
implementation.
Figure 3 illustrates the general scheme of the
Client Process. This process generates 50 client
threads (we have assumed a maximum population
size of 1000 client devices), and it also computes
the percentage of CPU utilization, client latencies,
etc.. Each Client Thread generates two threads for
each client: the Client Receiver Thread (CRT) and
the Client Processor Thread (CPT), and when the
welcome message from the Server Thread arrives to
the associated socket, then the Client Thread starts
the simulation, that consists of sending a given num-
ber of position update messages and receiving the
corresponding acknowledgments from the neighbor
clients.
Also, we developed another version where each
Server Thread has a single SRT and a single SPT for
managing all the clients in each working group, in-
stead of one SRT and one SPT for each client. Us-
ing the
Select
function, the SRT receives messages
from all the clients and it processes them. As it could
be expected, we obtained better performance results
with the Select version of the TCP implementation.
2.2 UDP Implementation
Finally, we have considered a connectionless oriented
implementation for the CAR system, in order to study
the effectiveness of TCP connections in a distributed
GRAPP2013-InternationalConferenceonComputerGraphicsTheoryandApplications
382

Figure 3: General scheme of the client process in the TCP
implementation.
environment like a CAR system. The motivation
of this study are both the short message size (usu-
ally carry a position update consisting of a bunch of
bytes) and the huge amount of the messages gener-
ated by CAR systems. Although the UDP protocol
can loose messages and the effects and size of these
losses should be studied, we have also considered this
implementation for comparison purposes. The UDP
implementation is very similar to the TCP-Select im-
plementation. The only difference is that in this im-
plementation we have used UDP sockets. Since this
implementation can drop messages, it also counts the
number of dropped or lost messages (since both the
number of iterations and the number of clients in each
working group is known, each client can compute the
number of message that should arrive).
3 PERFORMANCE EVALUATION
We have performed different measurements on differ-
ent simulated systems using these implementations.
We have performed simulations with different num-
ber of clients and we have measured the response time
provided to these clients (the round-trip delay for each
updating message sent by a given client to the clients
in its working group). In this way, we can study the
maximum number of clients that the system can sup-
port while providing a response time below a given
threshold value. In order to define an acceptable be-
havior for the system, we have considered 250 ms. as
the threshold value, since it is considered as the limit
for providing realistic effects to users in DVEs (Hen-
derson and Bhatti, 2003).
We have considered the system response time (in
milliseconds) for each updating message sent by a
given client to its neighbor clients as the time re-
quired for receivingthe acknowledgmentsfrom all the
clients in the working group of this givenclient. In or-
der to measure the dispersion of this metric, we have
measured the standard deviation for all the updating
messages sent, as well. Also, we have computed the
response time in the server (in milliseconds) as the
time required by the destination clients to answer the
server messages.
Table 1 shows the results for a working group size
of 25 clients. The most-left column in these subta-
bles shows the number of clients in the system, that is,
the population size. The values in this column range
from 100 to 1000 clients in the system. The next two
columns show the average value of the response times
(in milliseconds) provided by the system to all the
clients (labeled as ”RT”), as well as the corresponding
standard deviation values (column labeled as ”Dev”).
The fourth column (labeled as ”CPU”) shows the per-
centage of the CPU utilization in the server. Finally,
the fifth and sixth columns (labeled as ”RT S” and
”% lost”, respectively) show the average values (in
milliseconds) of the response time in the server for
all the messages exchanged during the simulation and
the percentage of messages dropped by the system.
The latter column has been computed by subtracting
the number of messages received by all the clients in
a simulation (measured in the simulation itself) from
the theoretical number of messages that clients should
exchange for a given population size.
Table 1: Results for a working group size of 25 neighbors.
TCP-Select implementation
Size RT Dev CPU RT S % lost
100 90.8 24.7 23.2 19.35 0.00
200 89.95 21.13 47 33.4 0.00
300 123.95 32.36 72 54.7 0.00
400 209.2 35.88 87.2 85.55 0.00
500 268.17 44.44 86 112.07 0.00
700 383.96 70.6 93.1 151.56 0.00
1000 566.44 133.33 93.1 166.79 0.00
UDP implementation
Size RT Dev CPU RT S % lost
100 9.86 6.78 72.50 4.06 0.83
200 21.70 14.73 82.00 9.84 1.18
300 26.01 21.91 79.60 11.61 0.69
400 39.41 30.66 81.90 18.26 0.83
500 48.68 39.68 83.80 22.84 0.74
700 79.70 97.87 85.10 37.26 0.76
1000 122.37 85.35 85.00 44.98 0.90
Table 1 shows that for this level of workload
the system enters saturation in the TCP-based imple-
mentation. Effectively, the RT column shows that
TCP-Select implementation reaches (and exceeds)
this threshold value for a population of 500 clients.
However, the UDP implementation does not reach
even half of this value for the maximum population
OntheImplementationofServersforLargeScaleCARSystemsbasedonMobilePhones
383

size considered, one thousand clients.
It is worth mention that for those cases when the
system reaches saturation, the percentage of CPU uti-
lization in the server is 85% or higher. The gap be-
tween 85% and 98% of CPU utilization for reaching
the saturation point can be explained by the shared
memory architecture of current multicore processors
(the dual core processor in the computer platform
used as simulation server), as shown in (Bauset et al.,
2012).
The ”% loss” column shows that for the UDP im-
plementation the percentage of lost messages is not
higher than 1.2%. The effects of loosing some mes-
sages will consist of producing some jitter in the dis-
play of the clients. However, these percentage val-
ues ensure a reasonable quality in the visualization of
the CAR system. In order to ensure that the effects
of the UDP implementation in terms of dropped mes-
sages are consistent for all the workload levels consid-
ered, Figure 4 shows the average number of packets
dropped for each working group size considered.
Figure 4: Number of packets lost in the UDP implementa-
tion.
Figure 4 shows that for working group sizes of
5 and 10 neighbor clients there are no packet losses.
For a working group size of 20 neighbors, the amount
of lost packets reaches 8581 for a theoretical total of
packets sent of 1.9 million packets. Analogously, for
a working group size of 25 neighbors, the amount of
lost packets reaches 21593 out of 2.4 million packets
sent. Therefore, in the worst case the number of lost
packets only represent a 1’18 % of the total amount
of packets sent. This value represents only a small
image flicker on some clients, and in very limited pe-
riods of time. As the information is sent more than
once per second (since the action cycle of the HTC
Nexus One is 167.11 ms.), this value can be consid-
ered an insignificant flickering.
4 CONCLUSIONS
This paper has proposed the experimental comparison
of different large-scale CAR systems based on mobile
phones with different server implementations. The
performance evaluation results show that the best im-
plementation is the one based on UDP messages, in-
stead of classical TCP connections, in order to support
more than one thousand clients at interactive rates.
These results validate the proposed UDP-based im-
plementation as the best option for large-scale CAR
systems based on mobile phones.
ACKNOWLEDGEMENTS
This work has been jointly supported by the Span-
ish MICINN and the European Commission FEDER
funds, under grant TIN2009-14475-C04.
REFERENCES
Bauset, V. F., Ordu˜na, J. M., and Morillo, P. (2011). Perfor-
mance characterization on mobile phones for collab-
orative augmented reality (car) applications. In Pro-
ceedings of the 2011 IEEE/ACM 15th DS-RT, DS-RT
’11, pages 52–53.
Bauset, V. F., Ordu˜na, J. M., and Morillo, P. (2012). On
the characterization of car systems based on mobile
computing. In Proceedings of HPCC ’12 (AHPCN
workshop).
Billinghurst, M. and Kato, H. (1999). Real world telecon-
ferencing. In Proc. of the conference on Human Fac-
tors in Computing Systems (CHI 99).
Billinghurst, M., Poupyrev, I., Kato, H., and May, R.
(2000). Mixing realities in shared space: an aug-
mented reality interface for collaborative computing.
In IEEE International Conference on Multimedia and
Expo (ICME 2000), volume 3, pages 1641–1644.
Hallerer, T., Feiner, S., Terauchi, T., Rashid, G., and Hall-
away, D. (1999). Exploring mars: Developing indoor
and outdoor user interfaces to a mobile augmented re-
ality system. Computers and Graphics, 23:779–785.
Henderson, T. and Bhatti, S. (2003). Networked games:
a qos-sensitive application for qos-insensitive users?
In Proceedings of the ACM SIGCOMM 2003, pages
141–147. ACM Press / ACM SIGCOMM.
GRAPP2013-InternationalConferenceonComputerGraphicsTheoryandApplications
384
