
Evaluation and Comparison of Textural Feature Representation for the
Detection of Early Stage Cancer in Endoscopy
Arnaud A. A. Setio
1
, Fons van der Sommen
1
, Svitlana Zinger
1
, Erik J. Schoon
2
and Peter H. N. de With
1
1
Dept. of Electrical Engineering, Eindhoven University of Technology,
Den Dolech 2, 5612 AZ, Eindhoven, The Netherlands
2
Dept. of Gastroenterology and Hepatology, Catharina Hospital,
Michelangelolaan 2, 5623 EJ, Eindhoven, The Netherlands
Keywords:
HD Endoscopy, Cancer Detection, Esophageal Irregularities, Co-occurance Matrix, Texture Spectrum
Histogram (TSH), Rotation Invariant Uniform Local Binary Patterns (RIULBP), Gabor Features.
Abstract:
Esophageal cancer is the fastest rising type of cancer in the Western world. The novel technology of High
Definition (HD) endoscopy enables physicians to find texture patterns related to early cancer. It encourages
the development of a Computer-Aided Decision (CAD) system in order to help physicians with faster identi-
fication of early cancer and decrease the miss rate. However, an appropriate texture feature extraction, which
is needed for classification, has not been studied yet. In this paper, we compare several techniques for tex-
ture feature extraction, including co-occurrence matrix features, LBP and Gabor features and evaluate their
performance in detecting early stage cancer in HD endoscopic images. In order to exploit more image char-
acteristics, we introduce an efficient combination of the texture and color features. Furthermore, we add a
specific preprocessing step designed for endoscopy images, which improves the classification accuracy. After
reducing the feature dimensionality using Principal Component Analysis (PCA), we classify selected features
with a Support Vector Machine (SVM). The experimental results validated by an expert gastroenterologist
show that the proposed feature extraction is promising and reaches a classification accuracy up to 96.48%.
1 INTRODUCTION
Esophageal cancer is the fastest rising type of cancer
in the Western world. The majority of the patients are
diagnosed in a late stadium, in which the survival rate
is only about 2-20% (Howlader et al., 2012). With
the availability of HD endoscopes, specialist physi-
cians are able to identify early stages of esophageal
cancer, by looking for subtle changes in color and
texture (Kara et al., 2010). However, these subtle
indicators of early cancer are easily overlooked. As
a consequence, identification of early cancer in the
esophageal tissue still requires significant effort and
experience. A supporting system that selects the visu-
ally informative areas and forwards them to the physi-
cian for further analysis and judgment would be of
high relevance and help for the physician in identify-
ing early stage cancer in the esophagus. In this study,
we present the first steps towards the development
of such a system. In comparative studies, various
methodologies have been applied for the detection
of anomalies in images obtained by a Wireless Cap-
sule Endoscope (WCE). They are classified into three
domains: spatial-domain features, frequency-domain
features and high-level features (Liedlgruber and Uhl,
2011). Spatial-domain features, for instance RIULBP
(Ojala et al., 2002), or co-occurrence texture features
(Haralick et al., 1973), are the most commonly used
feature types.
In studies that focus on frequency-domain fea-
tures, Gabor filters have shown to be successful
for the detection of intestinal juices (Vilarino et al.,
2006). Feature properties characterized at multiple
scales, using for instance a wavelet transform, also
show a better performance compared to most tradi-
tional spatial-domain features (Unser, 1995). High-
level features obtained using Canny edge detection,
are suitable for the real-time image processing sys-
tem due to the short processing time (Kang and Do-
raiswami, 2003).
However, there is no study yet on feature extrac-
tion using the novel technology of HD endoscopy. In
this paper, we compare several texture feature extrac-
tion techniques in order to find the best technique
238
A. A. Setio A., van der Sommen F., Zinger S., Schoon E. and de With P..
Evaluation and Comparison of Textural Feature Representation for the Detection of Early Stage Cancer in Endoscopy.
DOI: 10.5220/0004204502380243
In Proceedings of the International Conference on Computer Vision Theory and Applications (VISAPP-2013), pages 238-243
ISBN: 978-989-8565-47-1
Copyright
c
2013 SCITEPRESS (Science and Technology Publications, Lda.)
for early cancer detection. Our research also aims
at finding the best combination of features in order
to increase the classification accuracy. Afterwards,
we perform clinical validation and analysis of the ob-
tained result. Moreover, we add a specific HD prepro-
cessing step to optimize classification accuracy.
2 METHODS
In this study, we evaluate texture feature extraction
techniques for finding early cancer using HD endo-
scopic images. Since we want to be able to localize
the early cancers, we segment the image into small
square tiles prior to further analysis. Using images
annotated by an expert physician, we divide this set
of tiles into a training and a test set. Section 3 offers
more detailed discussion about this.
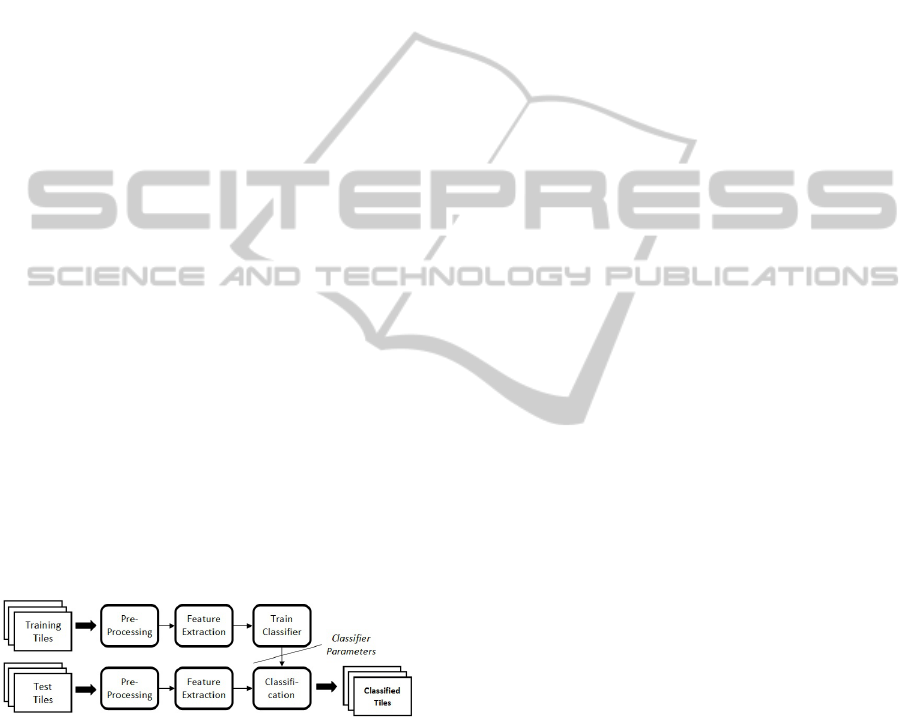
In order to evaluate the feature performance, we
use the algorithm depicted in Figure 1. During the
first step, the input tiles are preprocessed to remove
irrelevant tiles or textures. In the second stage, tex-
ture features are extracted using the feature extractor
designed specifically for endoscopic images. In addi-
tion, we also propose the usage of combined feature
vector in order to improve the classification accuracy.
After reducing the feature dimensions using PCA, the
obtained features are used for training or classification
using SVM in the last stage.
In this section, we present features which have
been successfully used to describe texture and adjust
them for finding patterns associated with early cancer.
The section also explains how we reduce the dimen-
sions of the feature vectors, combine the feature vec-
tors into one vector, and then perform classification.
Figure 1: Block Diagram of the Cancer Detection System.
2.1 Pre-processing of HD Images
Endoscopic images contain areas that may consider-
ably disturb texture feature analysis. These areas in-
clude specular reflection and irrelevant texture pat-
terns, which are not informative for cancer detection.
In general, the dichromatic plane is often used to
represent the specular reflection. However, the use
of the dichromatic plane is not efficient in correcting
highly textured images, since it is designed for uni-
form color areas (Saint-Pierre et al., 2011). In other
studies, the specular reflections in endoscopic im-
ages are corrected using linear skew (Tchoulack et al.,
2008) or digital inpainting (Saint-Pierre et al., 2011).
These approaches estimate the values of the images
affected by specular reflection for visual processing
only. However, the corrected areas still contain irrele-
vant information because the textures are not real. For
this reason, we propose to detect and discard the tiles
containing specular reflection.
The parts of the image containing specular reflec-
tion of the endoscopic light source are usually much
brighter than the relevant parts of the image. To detect
these regions, we convert the tiles to grayscale and
apply an empirically determined upper threshold of
T = 220 to every pixel of the tile. If 0.1% of the pix-
els in a tile exceeds this threshold, the tile will be re-
jected for further processing. To reduce the influence
of texture that is not informative for cancer detection,
we propose the usage of a median filter. Compared to
other smoothing filters, it has a better performance in
removing noise, while preserving edges. Since edges
are of crucial importance for the texture of the image,
we have adopted such a 5 × 5 median filter. This win-
dow size is based on visual evaluation of experimental
results.
2.2 Feature Extraction
From the tiles obtained in the preprocessing step, rel-
evant features are extracted, using several techniques.
These features are then comparatively studied in or-
der to find an optimal of their combination for cancer
detection. In spatial domain, we use seven features
based on the co-occurrence matrix, Texture Spectrum
Histogram (TSH), Local Binary Patterns (LBP), His-
togram of Oriented Gradients (HOG), and Dominant
Neighbors Structure (DNS). In the frequency domain,
we employ two Gabor-based features and Fourier fea-
tures. In addition, we also consider adding color in-
formation to the combined feature vector, since the
early cancer leads to both subtle color and texture dif-
ferences. Let us now provide more detail on each of
the applied features.
2.2.1 Co-occurrence based Texture Features
A gray-level co-occurrence matrix M
d
I
c
is defined as
M
d
I
c
(i, j) =
m
∑
p=1
n
∑
q=1
1 I
c
(p,q) = i ∧
I
c
(p + d
1
,q + d
2
) = j
0 otherwise,
(1)
where I
c
is the m × n image in color plane c, p and
q are the pixel location, d = [d
1
,d
2
] is the displace-
ment vector and i and j are the intensities of the corre-
EvaluationandComparisonofTexturalFeatureRepresentationfortheDetectionofEarlyStageCancerinEndoscopy
239
sponding pixel (Haralick et al., 1973). From these co-
occurrence matrices, statistical features are extracted.
Based on experimental results with the training set,
we select 7 features that perform best for endoscopic
images, namely: homogeneity, contrast, energy, en-
tropy, dissimilarity, correlation, and variance.
Applying Haralick’s algorithm to our case, 32
bins offer sufficient information. We propose
exponential displacement vectors D
θ
(k) = 2
k
for
k = 0,1,... ,
b
log
2
(min(m,n))
c
and angles θ =
0
o
,45
o
,90
o
,135
o
, to account for local as well as dis-
tant pixel relations.
2.2.2 Texture Spectrum Histogram (TSH)
As a textural counterpart of the well-known His-
togram of Color, the Texture Spectrum Histogram of-
fers information on the distribution of texture in an
image, based on small units of texture, called Texture
Units (TUs) (Wang and He, 1990). A TU is repre-
sented by 8 elements, which are neighbors of center
pixel g
c
in a 3 × 3 window. Each of the neighboring
elements g
p
is mapped to one of three possible values
(0, 1, 2) by
B
p
=
0 g
p
< g
c
,
1 g
p
= g
c
,
2 g
p
> g
c
p = 1, 2, ... 8. (2)
A texture unit TU is then computed by
TU
i, j
=
8
∑
p=1
B
p
× 3
p−1
, (3)
where i, j define the pixel position of g
c
. Parameter
TU
i, j
is calculated for all pixels of each tile. The oc-
currence histogram of TU is used as a feature vector.
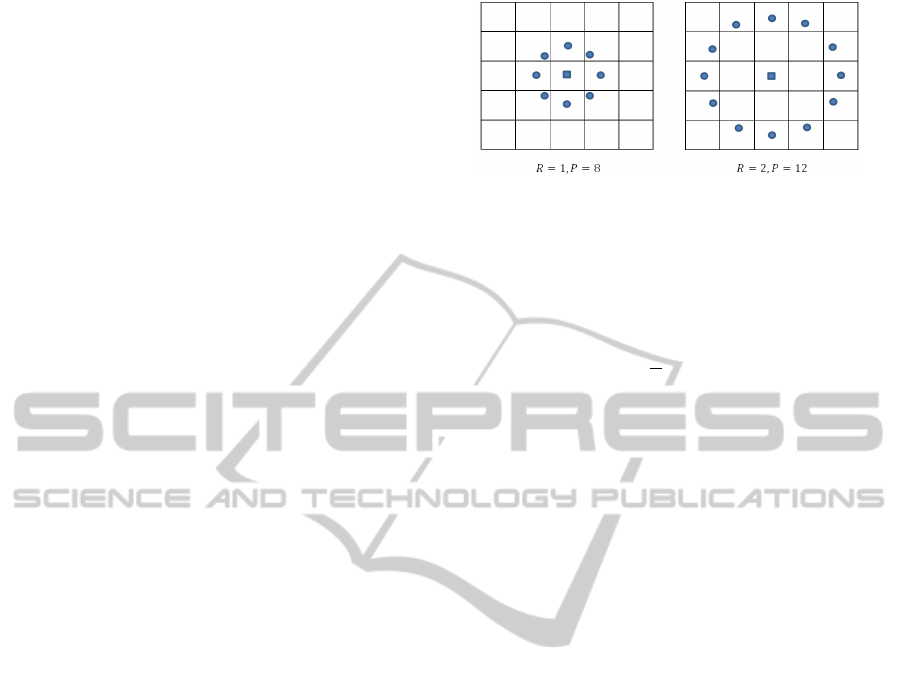
2.2.3 Rotation Invariant Local Binary Patterns
Rotation Invariant Uniform Local Binary Patterns
(RIULBP) is an efficient texture operator based on
a set of circular neighbors (Ojala et al., 2002). The
neighbors set consists of P elements lying on a circle
of radius R (Fig. 2). The pixel value of neighbors that
are not exactly in the center of pixels are estimated by
interpolation. Afterwards, RIULBP is computed by
LBP
riu2
P,R
=
(
∑
P
p=1
s(g
p
− g
c
) U (LBP
P,R
) ≤ 2,
P + 1 otherwise,
(4)
where U (LBP
P,R
) is the number of the spatial transi-
tion in the neighbors set and s(x) is the sign function.
To add more information on the textural features,
the contrast of local image texture is considered by
locally observing the values of individual pixels and
Figure 2: Circularly symmetric neighbor sets for different
values of P,R.
deriving mean and variance values from them. There-
fore, we calculate a rotation invariant variance mea-
sure (VAR) as
VAR
P,R
=
1
P
P−1
∑
p=0
(g
p
− µ)
2
, (5)
where µ is the mean value of all neighbors lying on the
same circle. Since LBP
riu2
P,R
and VAR
P,R
complement
each other, the joint combination of LBP
riu2
P,R
/VAR
P,R
is more accurate in describing the image texture.
2.2.4 Histogram of Oriented Gradients (HOG)
HOGs are a modification of Scale-Invariant Fea-
ture Transform (SIFT) descriptors (Dalal and Triggs,
2005). This method is based on evaluating a local his-
togram of image gradient orientations in a dense grid.
For better invariance to illumination and contrast, the
gradient strengths are locally normalized.
2.2.5 Dominant Neighbors Structure (DNS)
DNS is obtained by generating an estimated global
map representing the measured intensity similarity
between any given image pixel and its surrounding
neighbors within a certain window (Khellah, 2011).
In order to compute the intensity similarity, several
pixels i are used as the center of the search windows
S
i
. The distances between pixels i and several neigh-
boring pixels j on R concentric circles of various radii
are calculated using Euclidean distance d. Further-
more, the average value of the obtained neighborhood
structures is computed for all chosen pixels i.
2.2.6 Gabor Features
As a tool for local time-frequency analysis, the Gabor
wavelet is one of the important methods for texture
feature extraction (Zhang and Ma, 2007). It repre-
sents the response of cortical cells of human visual
system devoted to the processing of visual signals. In
our study we employ scale and rotation invariant Ga-
bor features.
VISAPP2013-InternationalConferenceonComputerVisionTheoryandApplications
240

The Gabor wavelet transform is described as the
convolutional operation of input image f (x,y) with
the complex conjugate of the Gabor function. The
transform can be written as
G
pq
(x,y) =
∑
s
∑
t
f (x − s, y −t)ψ
∗
pq
(s,t), (6)
where s and t are the filter mask size, p = 0, 1,...,P−1
and q = 0,1,...,Q − 1 are the scale and direction val-
ues, respectively, and ψ
∗
pq
is the complex conjugate of
the Gabor function. We use a dyadic function to de-
sign the Gabor filter. For each combination of p and q,
we calculate the mean µ
pq
and standard deviation σ
pq
of the filtered image. These are used for the feature
vector.
In order to make the feature vectors invariant
against rotation, we employ two approaches: DFT-
based (Lahajnar and Kovacic, 2003) and the Circular
Shift (CS) (Ng et al., 2005). In DFT-based process-
ing, we compute the Discrete Fourier Transform of
the original feature vector for each scale. In the CS
approach, the feature vector is re-oriented based on
the dominant orientation d. The dominant orientation
d is shifted to the first element of feature vector.
2.2.7 Fourier Features
Another method to capture texture, using the Fourier
feature vector, has been used to classify celiac disease
from duodenal images (Vecsei et al., 2008). In this ap-
proach, the Fourier domain image is calculated from
the input image using the Fourier transform. After-
wards, multiple ring-shaped filters are applied to the
center of the Fourier spectrum of each color channel
in order to differentiate the frequency characteristic in
several frequency regions.
For our purpose, this approach is adapted as fol-
lows. We use uniform width, W = R/Q, of rings
where R is the maximum width of the Fourier domain
image and Q denotes the number of rings. From each
ring, we calculate the mean and standard deviation,
which are used in the feature vectors.
2.3 Combined Feature Vector
In general, studies on irregularity detection in endo-
scopic images are typically based on single features
only. It results in non-optimal texture classification,
since only one aspect of the irregularity is taken into
account, e.g. only color or only texture. To improve
the classification accuracy, we propose to combine
our feature vectors for texture with simple color im-
age statistics, namely the sample mean and sample
variance per color plane. This should account for the
subtle difference in color that early cancerous tissue
shows.
Focusing on combining features in different com-
plementary domains, next to the combination of color
and texture features, we evaluate the combination of
spatial- and frequency-domain texture features. Each
feature extraction method produces a feature vector,
F
1
to F
M
, where M stands for the number of fea-
ture extraction methods used in the combined algo-
rithm. The individual feature vectors are concatenated
to generate the combined feature vector F
c
.
2.4 Dimensionality Reduction
In order to remove any redundancy and reduce the
dimensionality of the feature vector set, we employ
Principal Component Analysis (PCA). This technique
rotates the data such that the first dimension has the
highest variance and the last dimension has the low-
est variance. Then only the first D
∗
dimensions of
the rotated data are used for the reduced-dimensional
data. We select D
∗
by taking the first N dimensions
for which the sum of the singular values is 0.95 of the
total sum of the singular values.
2.5 Classification
SVM is a classification method for two-group clas-
sification problems (Cortes and Vapnik, 1995). Re-
cently, it has gained considerable attention due to the
excellent performance in producing accurate and ro-
bust classification results.
In this paper, SVM is implemented using the soft-
ware LIBSVM (Chang and Lin, 2011). An SVM clas-
sifier depends on cost parameter C, kernel function
K (x
i
,x
j
) and training data D
tr
. In order to find the
optimal C and K (x
i
,x
j
), we use a grid search and
10-fold cross-validation in order to evaluate the per-
formance parameters. We employ the Radial Basis
Function (RBF) kernel and determine the RBF width
γ in the grid search described above.
3 CLINICAL VALIDATION
For clinical evaluation of the proposed algorithm, we
have gathered 50 RGB endoscopic images with a res-
olution of 1600 × 1200 pixels for each class, being
‘tumorous’ and ‘normal tissue’. From each class, the
images are split into non-overlapping tiles with pixel
dimensions 25 × 25, 50 × 50, or 75 × 75. Afterwards,
600 tiles are selected for the dataset. We have used
40% of the total dataset for training and the other 60%
EvaluationandComparisonofTexturalFeatureRepresentationfortheDetectionofEarlyStageCancerinEndoscopy
241
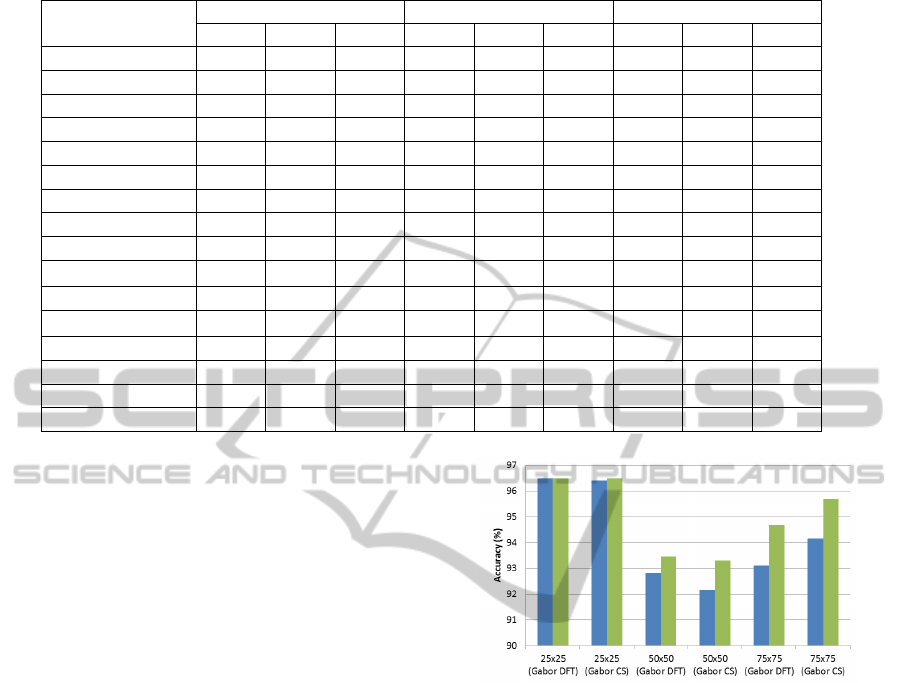
Table 1: Classification performance (%) of tumorous tissue in RGB color space. Best accuracy of each tile size is in bold.
Features
25 × 25 50 × 50 75 × 75
acc sen spe acc sen spe acc sen spe
Homogeneity 94.25 95.93 92.53 87.58 82.31 91.94 91.05 90.94 91.16
Contrast 94.25 93.90 94.62 90.20 84.48 94.93 92.77 90.59 94.90
Energy 94.60 97.29 91.84 87.58 86.28 88.66 90.71 90.94 90.48
Dissimilarity 94.17 95.59 92.71 89.22 85.20 92.54 92.43 91.29 93.54
Entropy 94.77 95.93 93.58 88.24 81.95 93.43 92.25 92.33 92.18
Variance 94.43 94.41 94.44 88.40 80.51 94.93 93.29 91.99 94.56
Correlation 92.62 93.39 91.84 89.22 87.36 90.75 91.57 91.99 91.16
TSH 86.36 86.95 85.76 80.39 73.29 86.27 83.65 77.70 89.46
HOG 90.65 91.36 89.93 88.24 80.51 94.63 88.12 89.90 86.39
LBP
riu2
P,R
84.13 84.24 84.03 85.46 80.14 89.85 84.51 83.62 85.37
VAR
P,R
93.57 95.59 91.49 88.89 85.20 91.94 90.88 92.68 89.12
LBP
riu2
P,R
/VAR
P,R
94.00 95.08 92.88 90.03 90.25 89.85 92.60 95.47 89.80
DNS 94.00 93.05 94.97 88.24 81.95 93.43 91.57 91.29 91.84
Gabor (DFT) 96.48 97.46 95.49 92.81 88.09 96.72 93.12 91.29 94.90
Gabor (CS) 96.40 97.63 95.14 92.16 87.73 95.82 94.15 91.99 96.26
Fourier 94.25 95.25 93.23 89.05 84.48 92.84 89.50 89.90 89.12
for testing. We tuned all classifier and feature param-
eters using the training set. Table 1 shows the clas-
sification performance of our classifier on the testing
sets. We have measured the performance using statis-
tical measures: accuracy (acc), sensitivity (sen) and
specificity (spe).
According to Table 1, the rotation and scale invari-
ant Gabor features perform better in terms of classifi-
cation accuracy compared to the other methods. It is
due to the multi-resolution analysis at different scales
and directions, which is not available in other fea-
tures. The algorithm complexity of the Gabor feature
extraction is lower than the complexity of other fea-
tures. Therefore, we conclude that Gabor features are
suitable for real-time implementation in a further de-
velopment. Based on our experiment, the best classi-
fication accuracy for Gabor features is obtained using
P = 2 and Q = 8.
Since the Gabor features show the best perfor-
mance, we have tried to improve the classification by
combining them with other features. After perform-
ing a number of experiments, we conclude that the
best results are obtained by combining Gabor features
with the proposed color information, i.e. the sample
mean and sample variance. Figure 3 shows a compar-
ison between using Gabor features alone and a Gabor
extension with color features, where the latter clearly
improves the classification performance. This is in
line with our expectations, since early cancer is char-
acterized by differences in texture and color.
As an interesting visual result, Figure 4 illustrates
an original HD endoscopic image, the expert image
and an image where the tiles detected by the algo-
Figure 3: Accuracy measured of the test set: in blue
(darker color)-classification result for Gabor texture alone;
in green-classification for a combined feature vector (Gabor
and color information), for various tile sizes.
rithm are delineated. The expert image is created by
the expert gastroenterologist. Our detection result is
obtained by using the Gabor features with color infor-
mation on 50 × 50 tiles. From Figure 4, we can ob-
serve that our algorithm delivers a promising result,
which is very similar to the ground truth.
4 CONCLUSIONS
We have presented a novel benchmark for texture fea-
ture analysis applied to HD endoscopic images of the
esophagus for enhancing early-stage cancer detection.
This study is a step forward to a CAD system for the
real-time diagnosis based on HD endoscopic images.
We have studied several texture feature approaches
and concluded that Gabor multi-resolution analysis,
such as with Gabor features, provides better results
VISAPP2013-InternationalConferenceonComputerVisionTheoryandApplications
242
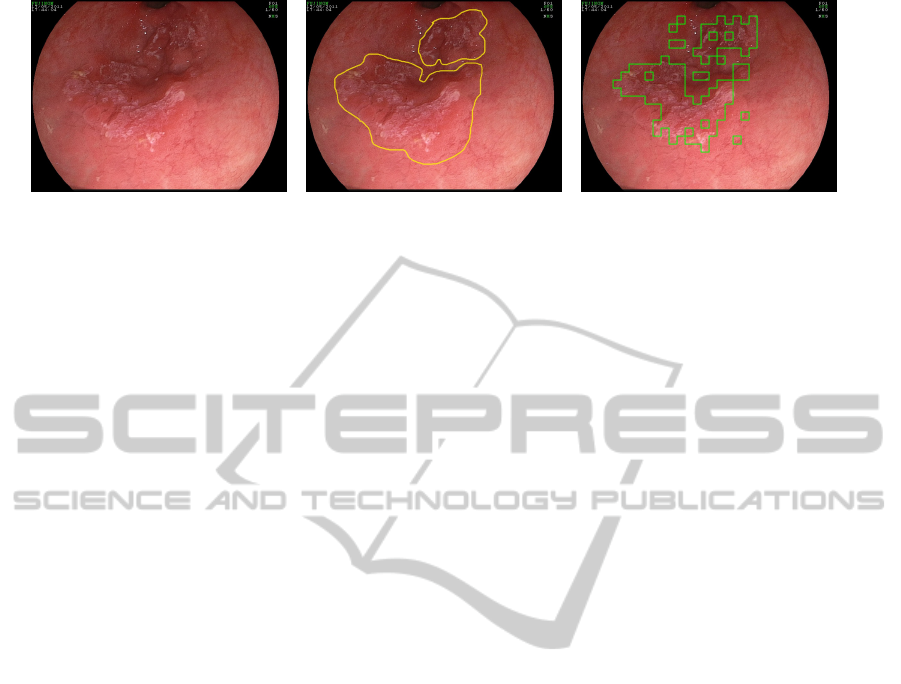
Figure 4: Original Image (left), Ground Truth Image (center), and Output Image (right).
than other features. It is suited to describe irregular
textures, associated with early cancer, containing var-
ious directions and scale. For further improving the
classification accuracy, we propose a combined fea-
ture vector based on incorporating color information
and the insertion of a specific HD preprocessing step.
In the latter step we remove for example specular re-
flections that normally confuse image analysis. For
efficient classification, PCA and SVM are employed
to reduce the dimensionality and to classify the fea-
ture vectors. Our proposed methodology achieves a
classification accuracy up to 96.48%.
Future work should focus on detecting more sub-
tle abnormalities (earlier stages of cancer) and more
advanced pre-processing for specular reflection re-
moval. Novel post-processing can also be imple-
mented to provide a better image visualization.
REFERENCES
Chang, C.-C. and Lin, C.-J. (2011). LIBSVM: A library
for support vector machines. ACM Transactions on
Intelligent Systems and Technology, 2:27:1–27:27.
Cortes, C. and Vapnik, V. (1995). Support-vector networks.
Machine Learning, 20:273–297.
Dalal, N. and Triggs, B. (2005). Histograms of oriented gra-
dients for human detection. In Computer Vision and
Pattern Recognition, 2005. CVPR 2005. IEEE Com-
puter Society Conference on, pages 886 –893 vol. 1.
Haralick, R. M., Shanmugam, K., and Dinstein, I. (1973).
Textural Features for Image Classification. Sys-
tems, Man and Cybernetics, IEEE Transactions on,
3(6):610 – 621.
Howlader, N., Noone, A., Krapcho, M., Neyman, N.,
Aminou, R., Altekruse, S., Kosary, C., Ruhl, J., Tat-
alovich, Z., Cho, H., Mariotto, A., Eisner, M., Lewis,
D., Chen, H., EJ, F., and Cronin, K. (2012). Seer can-
cer statistics review.
Kang, J. and Doraiswami, R. (2003). Real-time image
processing system for endoscopic applications. In
Electrical and Computer Engineering, 2003. IEEE
CCECE 2003. Canadian Conference on, volume 3.
Kara, M. A., Curvers, W. L., and Bergman, J. J. (2010). Ad-
vanced Endoscopic Imaging in Barrett’s Esophagus.
Techniques in Gastrointestinal Endoscopy, 12(2):82–
89.
Khellah, F. (2011). Texture classification using domi-
nant neighborhood structure. Image Processing, IEEE
Transactions on, 20(11):3270 –3279.
Lahajnar, F. and Kovacic, S. (2003). Rotation-invariant tex-
ture classification. Pattern Recognition Letters, 24.
Liedlgruber, M. and Uhl, A. (2011). Computer-aided deci-
sion support systems for endoscopy in the gastroin-
testinal tract: A review. Biomedical Engineering,
IEEE Reviews in, 4:73 –88.
Ng, C., Lu, G., and Zhang, D. (2005). Performance study
of gabor filters and rotation invariant gabor filters.
In Multimedia Modelling Conference, 2005. MMM
2005. Proceedings of the 11th International.
Ojala, T., Pietik
¨
ainen, M., and Maenpaa, T. (2002). Mul-
tiresolution Gray-Scale and Rotation Invariant Tex-
ture Classification with Local Binary Patterns. IEEE
Transactions on Pattern Analysis and Machine Intel-
ligence, 24(7):971–987.
Saint-Pierre, C.-A., Boisvert, J., Grimard, G., and Cheriet,
F. (2011). Detection and correction of specular re-
flections for automatic surgical tool segmentation in
thoracoscopic images. Mach. Vision Appl., 22(1).
Tchoulack, S., Pierre Langlois, J., and Cheriet, F. (2008).
A video stream processor for real-time detection and
correction of specular reflections in endoscopic im-
ages. In Circuits and Systems and TAISA Conference,
2008. NEWCAS-TAISA 2008. 2008 Joint 6th Interna-
tional IEEE Northeast Workshop on, pages 49 –52.
Unser, M. (1995). Texture classification and segmentation
using wavelet frames. Image Processing, IEEE Trans-
actions on, 4(11):1549 –1560.
Vecsei, A., Fuhrmann, T., and Uhl, A. (2008). Towards
automated diagnosis of celiac disease by computer-
assisted classification of duodenal imagery. In Ad-
vances in Medical, Signal and Information Process-
ing, 2008. 4th IET International Conference on.
Vilarino, F., Spyridonos, P., Pujol, O., Vitria, J., and Radeva,
P. (2006). Automatic Detection of Intestinal Juices in
Wireless Capsule Video Endoscopy. In Pattern Recog-
nition (ICPR’06), 18th International Conference on,
pages 719–722, Hong Kong. IEEE.
Wang, L. and He, D.-C. (1990). Texture Classification using
Texture Spectrum. Pattern Recognition, 23(8).
Zhang, G. and Ma, Z.-M. (2007). Texture feature extraction
and description using gabor wavelet in content-based
medical image retrieval. In Wavelet Analysis and Pat-
tern Recognition, 2007. International Conference on,
volume 1, pages 169 –173.
EvaluationandComparisonofTexturalFeatureRepresentationfortheDetectionofEarlyStageCancerinEndoscopy
243
