Situation Awareness-Oriented Alarm Visualizations: A next Step in
HSC Environments
Rosa Romero-Gómez, David Díez, Paloma Díaz and Ignacio Aedo
DEI-Interactive Systems Lab, Computer Science Department, Universidad Carlos III de Madrid, Leganés, Madrid, Spain
Keywords: Alarm Visualization, Situation Awareness, Human Supervisory Control.
Abstract: Due to their effective capability to fix the attention of control room operators to such conditions that require
some kind of response, alarm visualizations have become key control artifacts in Human Supervisory
Control environments. Nevertheless, the increasing complexity and interconnectivity of controlled processes
highlights the necessity of new control artifacts that support both identification and diagnosis tasks. In this
line of work, this paper posits the need of redesigning alarm visualizations in order to assist not only the
real-time detection of failures but also the achievement of Situation Awareness by control room operators.
Based on dynamic interaction and exploration capabilities, this new design perspective for alarm
visualizations may improve the operator’s ability to diagnose the causes of abnormal situations.
1 INTRODUCTION
Human Supervisory Control (HSC) is defined as
“the process by which a human operator
intermittently interacts with a computer, receiving
feedback from and providing commands to a
controlled process or task environment” (Sheridan,
1992, p. 1). Due to their capability to assist control
room operators, alarm visualizations have been
characterized as key control artifacts in HSC
environments (Sheridan, 1992; Endsley et al., 2003;
Ivergard and Hunt, 2009). Alarm visualizations refer
to “the method(s) by which alarm coding and
messages are presented to control room operators”
(ISA, 2009, p. 50).
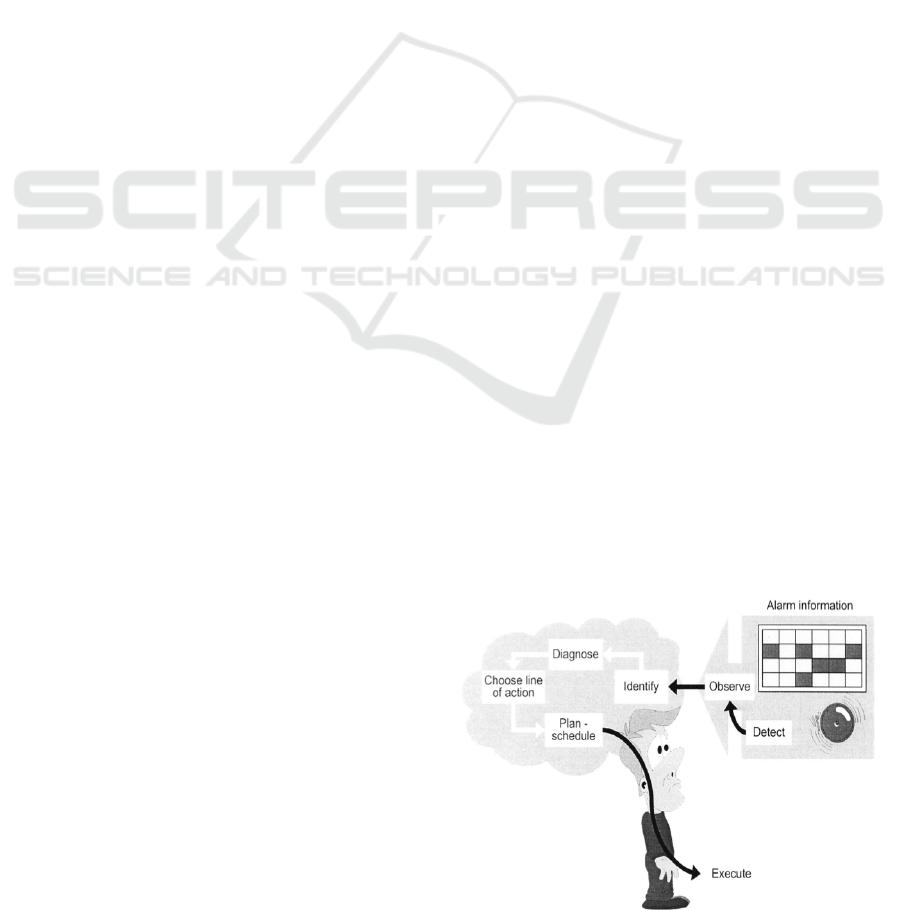
The primary objective of alarm visualization is to
warn the operator about a condition that develops
when the controlled process significantly deviates
from the normal acceptable mode of operation (see
Fig.1). However, effective alarm systems must be
conceived not only to support the identification of
failures but also to assist the diagnosis of the
situation (Niwa and Hollnagel, 2001); understanding
diagnosis as the act or process of deciding the nature
of the operating condition by examination
(Rasmussen, 1993). Accordingly, the next design
challenge of alarm visualization should be to assist
this thinking process.
The analyses of recent problems in HSC
environments shows that the ability of control room
operators for acquiring Situation Awareness (SA) is
a major factor in failures propagation (Endsley et al.,
2003; Greitzer et al., 2008). With increasing
complexity and interconnectivity of the controlled
processes, the scope and complexity of HSC
continues to grow, in particular, the amounts and
typologies of information that control room
operators must process in quasi-real time (Greitzer et
al., 2008), hampering the achievement of SA.
Figure 1: Alarm processing paradigm according to the
primary purpose of an alarm system (Niwa and Hollnagel,
2001).
483
Romero-Gómez R., Díez D., Díaz P. and Aedo I..
Situation Awareness-Oriented Alarm Visualizations: A next Step in HSC Environments.
DOI: 10.5220/0004208504830488
In Proceedings of the International Conference on Computer Graphics Theory and Applications and International Conference on Information
Visualization Theory and Applications (IVAPP-2013), pages 483-488
ISBN: 978-989-8565-46-4
Copyright
c
2013 SCITEPRESS (Science and Technology Publications, Lda.)

This paper posits the need of redesigning alarm
visualizations in order to assist not only the real-time
detection of failures but also the achievement of SA
by control room operators. Based on dynamic
interaction and exploration capabilities, such SA-
oriented alarm visualization may overcome human
information processing limitations and, therefore,
improve the ability of control room operators to
diagnose the causes of abnormal situations.
This position paper first gives an overview of the
SA and how visualization relates to it. In order to
identify design limitations in current alarm
visualizations, the next section reviews prior work
on alarm-visualization design research. Afterwards,
underpinned by design principles related to SA,
alarm management, and visualization, a set of design
considerations and conclusions are provided for
further discussion.
2 THEORETICAL
BACKGROUND
As aforementioned, it has been widely established
that SA is a contributing factor to many accidents
and incidents in a variety of HSC contexts.
However, defining exactly what constitutes SA has
been a challenging task because of the complexity
on characterizing the construct in terms of a set of
psychological processes (Greitzer et al., 2008).
Rousseau, Tremblay, and Breton (Rousseau et
al., 2004) performed a systematic classification of 26
SA definitions in the literature. These definitions can
be classified in two main classes corresponding to
what is now a generally accepted duality of SA as a
state or a process. On the one hand, Mica Endsley
has supplied the most highly recognized descriptive
model of SA. This definition refers to SA as “the
perception of elements in the environment within a
volume of time and space, the comprehension of
their meaning, and the projection of their status in
the near future” (Endsley et al., 2003, p. 13).
Accordingly, Endsley describes this concept as a
state of knowledge and the associated process as
situation assessment. On the other hand, Dekker and
Lutzhoft (Dekker and Lutzhoft, 2004) take issue
with the empiricist view of SA that consider SA as a
label for a range of cognitive processes or
processing activities. They describe SA as an
intrinsic feature of the functional relationship
between the environment and the person. This
approach is highly related to current ideas about
sensemaking as an active strategy for dealing with a
complex world. Sensemaking is the cyclical process
in which humans collect information, examine,
organize and categorize that information, isolate
dimensions of interest, and use the results to solve
problems, make decisions, take action, or
communicate findings (Klein et al., 2006).
This latter SA perspective is consistent with
current ideas about sensemaking as the research path
of visualization. According to Stuart Card (Card et
al., 1999), the era of pure visualization is over.
Leaving aside communication purposes, the goal of
visualization should be insight or, more particularly,
sensemaking. Visualization can enhance the
sensemaking cycle by reducing search; enhancing
the recognition of patterns; supporting the easy
perceptual inference of relationship; allowing for the
perceptual monitoring of a large number of potential
events; enabling the exploration of a space of
parameter values; and providing means for
evaluating various hypotheses (Card et al., 1999;
Thomas and Cook, 2005).
3 ALARM VISUALIZATIONS
DRAWBACKS
So far, alarm-visualization design research has
mainly been focused on developing presentation-
oriented alarm visualizations instead of reinforcing
the analytical strengths naturally gained by the
visualization itself. In particular, past research
performed by Mattiason (Mattiasson, 1999),
Tuszynski (Tuszynski et al., 2002), Bullemer
(Bullemer et al., 2011) and Mikkelsen (Mikkelsen et
al., 2011) highlights deficiencies related to: (1) the
lack of visual scalability - the capability of
visualization tools to display large datasets, in terms
of the number of individual elements and data
dimensions (Eick and Karr, 2002); (2) information
integration - the capability of visualization tools to
integrate heterogeneous information spaces into a
single analytic environment (Thomas and Cook,
2005); and (3) support for pattern extraction tasks -
the capability of visualization tools to organize data
by structural relationships such as space and time
(Thomas and Cook, 2005).
Regarding to visual scalability deficiencies,
alarm visualizations have the potential problem of
alarm flooding during large disturbances. Alarm
flood is a situation where the alarm activations occur
so rapidly that the operator is “flooded” by them
(Rothenberg, 2009) so the most important alarms are
difficult to locate by control room operators.
IVAPP2013-InternationalConferenceonInformationVisualizationTheoryandApplications
484
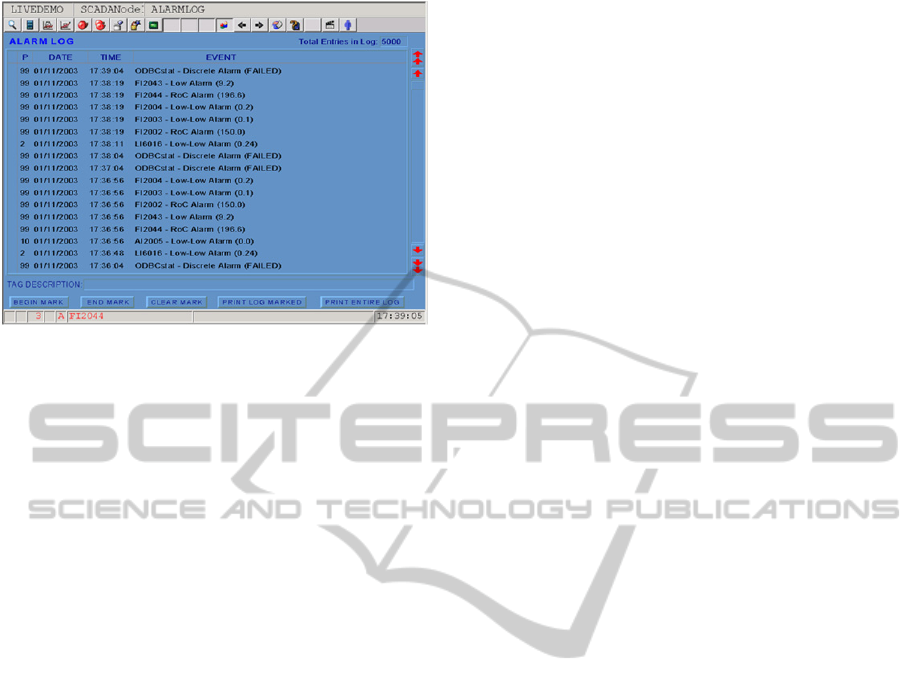
Figure 2: Alarm messages list from a typical SCADA
system interface (Broadwin Webaccess, 2012).
Concerning information integration, since current
alarm visualizations have different purposes of
information, operators have to navigate across them
in order to get a unified view of the controlled
process condition and, consequently, to establish
relationship between alarms. Unfortunately, such
limitation can cause that control room operators to
get trapped in a phenomenon called attentional
tunnelling (Endsley et al., 2003). When people
process information from multiple sources, they may
lock in on certain aspects that they are trying to
process, and will inadvertently drop their scanning
behaviour. Finally, regarding to the lack of support
for pattern extraction tasks, some alarm
visualizations such as alarm messages lists (see Fig.
2) tend to be too detailed with the presentation of
sequential information but less comprehensive with
the functional organization necessary to understand
the nature and progress of a disturbance.
In summary, existing alarm visualizations do not
properly assist operators in the process of deciding
the condition or situation that motivated the alarms,
which can cause operating inefficiencies or even
critical operating problems.
4 SA-ORIENTED ALARM
VISUALIZATION
Given the significance of SA as a key factor in HSC
environments, and considering the analytical
strengths provided by visualization itself, the
position of this paper is that the fundamental
purpose of alarm visualizations should be extended
to the assistance of the control room operator’s SA.
This new design perspective may reveal new
insights that overcome human information
processing limitations and, therefore, improve the
ability of diagnosis of control room operators.
Nevertheless, the achievement of this goal should
involve the appropriate design decisions.
To create effective alarm visualizations, it must
be addressed a number of design questions: How
should the alarms be presented to the operator?
How much information can be acquired in the
limited available time? How it accurately can be
acquired? What is the degree to which that
information is compatible with the operator’s SA
needs? What characterizes effective visualization
techniques? Towards this aim, in what follows, a set
of design principles related to alarm management,
SA-oriented design (SAOD), and visualization are
reviewed. Afterwards, a set of considerations for
designing SA-oriented alarm visualizations is
provided.
4.1 Principles for Alarm Visualizations
When an alarm is triggered, the first step for control
room operators is to identify its typology, severity,
and state. Aiming at assisting such detection phase,
it is necessary to take into account the following key
alarm presentation design guidelines proposed by
the two main standards for designing alarm systems,
International Society of Automation and the
Engineering Equipment [ISA] (2009) and Materials
User’s Association [EEMUA] (1999):
Main alarm visualization shall be provided. The
main alarm visualization should support the task
of monitoring and controlling the future
behaviour of the process by attracting the
operator’s attention towards process conditions
that require assessment or action.
Key alarms shall be shown in overview displays
that are permanently on view, with spatially
dedicated alarms. The purpose of key alarm
visualization is to improve the management of
alarm overloads. Key alarm visualizations ensure
both an information rate and a presentation form
that will remain manageable under all process
conditions.
Special visual annunciation should be used for
new alarms. Visual annunciation is used to
attract operator’s attention towards new alarms
and distinguish them from alarms that have been
accepted.
The priority of alarms should be coded using
colours and possibly other means. This is to
ensure that different priorities are visually
separated in a way that makes it very quick and
SituationAwareness-OrientedAlarmVisualizations:AnextStepinHSCEnvironments
485

easy to spot the most important alarms among
the less important ones.
4.2 Principles for Situation
Awareness-Oriented Design
The way in which information is presented to the
operator through the interface greatly influences SA
(Endsley et al., 2003; Rothenberg, 2009). The most
applied principles for creating SA-oriented designs
are the fifty design principles proposed by Endsley
(Endsley, 1995; Endsley et al., 2003). These
principles are based on a model of human cognition
involving dynamic switching between goal-driven
and data-driven processing and feature support for
limited operator resources. However, they underpin
not only SA design interface issues but also how to
design automated systems, dealing with complexity
or uncertainty. For this reason, the set of principles
to consider for designing effective alarm
visualizations should be reduced to those focused on
the interface design.
Goal-oriented information displays. Goal-
oriented information displays should be
provided, organized so that the information
needed for a particular goal is co-located and
directly answers the major decisions associated
with the goal.
Direct presentation of higher-level SA needs
rather than supplying only low-level data that
operators must integrate and interpret manually.
As attention and working memory are limited,
the degree to which displays provide information
that is processed and integrated in terms of
comprehension and projection will positively
impact SA.
Support for global SA. Providing an overview of
the situation across the operator’s goals at all
times and enabling efficient and timely goal
switching and projection.
Critical cues related to key features of schemata
need to be determined and made salient in the
interface design. In particular those cues that will
indicate the presence of prototypical situations
will be of prime importance and will facilitate
goal switching in critical conditions.
Support for parallel processing. Multi-modal
displays should be provided in data rich
environments.
Use information filtering carefully. Extraneous
information not related to SA needs should be
removed (while carefully ensuring that such
information is not needed for broader SA needs).
4.3 Visualization Design Principles
Visualization can be understood as “the process of
designing information to match the processing
characteristics of human visual system” (Zhang et
al., 2002). Consequently, a first step in developing
effective visualizations is to understand how they
enable perception and cognition. The achievement of
this purpose encompasses the application of the
following set of visualization design principles
(Mackinlay, 1986; Norman, 1993; Card et al., 1999;
Tversky et al., 2002).
Appropriateness principle. Visualizations should
provide neither more nor less information than
that needed for solving the problem.
Naturalness principle. Experiential cognition is
most effective when the properties of the visual
representation most closely match the
information being represented. This principle
supports the idea that new visual metaphors are
only useful for representing information when
they match the user’s cognitive model of the
information. Purely artificial visual metaphors
can actually hinder understanding.
Matching principle. Representations of
information are most effective when they match
the task to be performed by the user. Effective
visual representations should present affordances
suggestive of the appropriate action.
Principle of congruence. The structure and
content of a visualization should correspond to
the structure and content of the desired mental
representation. In other words, the visual
representation should represent the important
concepts in the domain of interest.
Principle of apprehension. The structure and
content of a visualization should be readily and
accurately perceived and comprehended.
Principle of expressiveness. The visualization
contains all the facts in the data set and only the
facts.
Principle of effectiveness. The visualization
conveys the information in an effective way.
4.4 Design Considerations
Through the use of cues generated by alarm
visualizations, SA in HSC environments involves to
effectively perceive, fuse and relate the relevant
alarm from large volumes of divergent multi-source,
multi-dimensional, and time-varying alarm streams
(Sheridan, 1992; Nachreiner et al., 2006). The body
of prior work related to SA, alarm management, and
IVAPP2013-InternationalConferenceonInformationVisualizationTheoryandApplications
486

visualization has led it to formulate desired
properties and future directions for the design of
alarm visualizations that assist the achievement of
the control room operator’s SA. As a result, dynamic
interaction and exploration capabilities are proposed
in this paper as crucial design considerations for the
effectiveness design of alarm visualizations in HSC
environments.
Overview alarm visualization for collecting
information: Data and visualization attributes. The
first stage of sensemaking cycle is related to
information foraging. With the purpose of assisting
this phase, displaying an overview of the current
condition of the controlled process at all times
should be essential. Building on pre-attentive visual
processing such as colour and position, overview
alarm visualization may provide a starting point for
recognizing and flagging events that require further
analysis. The most important attributes to include in
this visualization should be related to the alarm state,
alarm priority and alarm typology (EEMUA, 1999;
ISA, 2009). Alarm state is referred to both the
operator acknowledgment and the state in which the
controlled process is operating (ISA, 2009). Alarm
priority is defined as the importance assigned to an
alarm within the alarm system to indicate the
urgency of response (ISA, 2009). Finally, alarm
typology is described as a group of alarms with
common alarm management requirements (ISA,
2009). Since these attributes are well suited to
provide an overview of the condition of the
controlled process, the alarm may be provided in a
drill-drown detail view to support later analysis.
Multiple views and levels of data. The analysis
and diagnosis tasks of the current condition of the
controlled process require assistance for operator
exploration. The operator wishes to understand
trends, locate anomalies, isolate and re-organize
information, compare, and make clear any
differences or similarities between datasets in order
to develop a hypothesis (Rothenberg, 2009).
Therefore, the need of overview visualizations for
quickly identifying an alarm in collecting
information phase should be replaced by a need of
alarm visualizations that are linked and arranged and
can represent multidimensional data from multiple
sources.
Filtering and distortion methods. While
perception of important alarms require as little user
interaction as possible, supporting analysis tasks is a
much more interactive activity. Due to the large size
of the data sets, in particular, during large
disturbances, filtering should be a very important
function. Filtering could become in both a
transitional mechanism from detection to
comprehension phase and a mechanism for
increasing the visual scalability of alarm
visualizations. At the same time, as the data that is
not the focus of the task is still important in
providing vital contextual information (Endsley et
al., 2003), distortion methods (Eick and Karr, 2002)
should be applied to highlight relevant alarms
without necessarily removing from the alarm
visualization. Distortion methods allow users to
examine one or more local areas in detail, in the
context of a global view of the space (Andrienko et
al., 2003).
Pattern recognition. The analysis and diagnosis
of an abnormal situation cannot be accomplished
without also taking into account certain patterns of
alarm activations that can supply new sources of
information to control room operators. A pattern is
understood as an arrangement or form, a model or
plan. In HSC environments, to observe that certain
patterns of alarm activations not only announce a set
of individual problems but, when taken as a group,
can also suggest more complex problems with
clarity (Rothenberg, 2009). Therefore, effective
alarm visualizations that support pattern recognition
tasks must fuse disparate data sources together
seamlessly, that can correlate all of the data together.
5 CONCLUSIONS
The use of alarm information in HSC environments
should go further than the purpose envisioned by
early alarm system designers. As related research on
alarm systems design has established, control room
operators should use alarm visualizations as a
support for diagnosing and making decisions about
the condition of the controlled process. On the
contrary, current alarm visualizations have several
design limitations for assisting this decision-making
process. Making the shift to this design perspective
may enable control room operators to improve their
ability to diagnose the causes of abnormal situations
and, therefore, the overall effectiveness of HSC
tasks.
REFERENCES
Andrienko, N., Andrienko, G. & Gatalsky, P., 2003.
Exploratory spatio-temporal visualization: an
analytical review. Journal of Visual Languages and
Computing, 14, pp.503-41.
Broadwin Webaccess – browser-based HMI and Scada.
SituationAwareness-OrientedAlarmVisualizations:AnextStepinHSCEnvironments
487

Engineering Manual. Retrieved December 14, 2012,
from Broadwin Technology, Inc.: http://broadwin
.com/Manual/EngMAN/EngMAN.htm#7.6_Alarm_Lo
g_Display.htm
Bullemer, P.T., Tolsma, M., Reising, D.V.C. & Laberge,
J.C., 2011. Towards Improving Operator Alarm Flood
responses:alternative alarm presentation techniques. In
2011, I., ed. ISA automation week., 2011.
Card, S., Mackinlay, J. & Shneiderman, B., 1999.
Readings in Information Visualization. San Francisco:
Morgan Kaufmann.
EEMUA, 1999. No.191 Alarm Systems: a guide to design,
management, and procurement engineering.
Engineering and Materials users association.
Eick, S. & Karr, A.F., 2002. Visual Scalability. Journal of
computational and graphical statistics, 11, pp.22-43.
Endsley, M.R., 1995. Toward a theory of situation
awareness in dynamic systems. Human Factors, 37(1),
pp.32-64.
Endsley, M., Bolté, B. & Jones, D.G., 2003. Designing for
Situational Awareness: An Approach to User-Centered
Design. CRC Press.
Dekker, S. & Lutzhoft, M., 2004. Correspondence,
cognition and sensemaking: A radical empiricist view
of situation awareness. In A cognitive approach to
situation awareness: theory and application. S.
Banbury and S. Tremblay. pp.22-41.
Greitzer, F.L., Schur, A., Paget, M. & Guttromson, R.T.,
2008. A sensemaking perspective on situation
awareness in power grid operations. In IEEE Power
and Energy Society General Meeting Conversion and
Delivery of Electrical Energy in the 21st Century.,
2008.
Ivergard, T. & Hunt, B., 2009. Handbook of Control
Room Design and Ergonomics. CRC Press.
ISA, 2009. ANSI/ISA-18.2-2009 Management of alarm
systems for the process industries. Technical Report.
International Society of Automation.
Klein, G., Moon, B. & Hoffman, R.F., 2006. Making
sense of sensemaking I: alternative perspectives. IEEE
Intelligent Systems, 21(4), pp.70-73.
Nachreiner, F., Nickel, P. & Meyer, I., 2006. Human
Factors in process control systems: the design of
human-machine interfaces. Safety Science, 44(1),
pp.5-26.
Niwa, Y. & Hollnagel, E., 2001. Enhancing Operator
control by adaptive alarm presentation. International
Journal of Cognitive ergonomics, 5, pp.367-84.
Norman, D., 1993. Things that make us smart: defending
human attributes in the age of the machine. New York:
Perseus books.
Mackinlay, J., 1986. Automating the design of graphical
presentations of relational information. ACM
transactions on graphics, 5(2).
Mattiasson, C., 1999. The alarm system from the
operator's perspective. In Human interfaces in control
rooms, cockpits, and command centres international
conference., 1999.
Mikkelsen, C., Johansson, J., and Rissanen, M., 2011.
Interactive Visualization for Sensemaking in Power
Grid Supervisory Systems. In 15
th
International
Conference on Information Visualization, 2011.
London.
Rasmussen, J., 1993. Diagnostic reasoning in action. IEEE
Transactions on systems man and cybernetics, 23,
pp.981-92.
Rousseau, R., Tremblay, S. & Breton, R., 2004. Defining
and modeling situation awareness: a critical review. In
A cognitive approach to situation awareness: theory
and application. S.Banbury and S. Tremblay. pp.3-21.
Rothenberg, D., 2009. Alarm Management for Process
Control. New Jersey: Monumentum Press.
Sheridan, T.b., 1992. Telerobotics, Automation, and
Human Supervisory Control. Cambridge: MIT Press.
Stanton, N.A., Stammers, R.B., 1992. Alarms in Human
Supervisory Control: A Human Factors Perspective.
International. Journal of Computer Integrated
Manufacturing. 5, pp. 81-93
Tversky, B., Morrison, J.B. & Betrancourt, M., 2002.
Animation: can it facilitate? International Journal of
Human-Computer Studies, 57(4).
Tuszynski, J. et al., 2002. A pilot projection on alarm
reduction and presentation based on multilevel flow
models. In Enlarged halden programme group
meeting,HPR-358., 2002.
Thunberg, A. & Osvalder, A.L., 2007. Human Factors
Issues in complex system performance.
Thomas, J. & Cook, K., 2005. Illuminating the path: the
research and development agenda for visual analytics.
Los Alamitos, CA: IEEE Computer Society.
Zhang, J., Johnson, K.A. & Malin, J.T., 2002. Human-
centered information visualization. In International
Workshop on dynamic visualization and learning.
Tubigen, 2002.
IVAPP2013-InternationalConferenceonInformationVisualizationTheoryandApplications
488
