
Blood Vessel Characterization in Colonoscopy Images to Improve Polyp
Localization
Joan M. N´u˜nez, Jorge Bernal, Javier S´anchez and Fernando Vilari˜no
Dept. of Comp. Science, Comp. Vision Center, Edifici O - UAB, 08193 Bellaterra, Spain
Keywords:
Colonoscopy, Blood Vessel, Linear Features, Valley Detection.
Abstract:
This paper presents an approach to mitigate the contribution of blood vessels to the energy image used at differ-
ent tasks of automatic colonoscopy image analysis. This goal is achieved by introducing a characterization of
endoluminal scene objects which allows us to differentiate between the trace of 2-dimensional visual objects,
such as vessels, and shades from 3-dimensional visual objects, such as folds. The proposed characterization is
based on the influence that the object shape has in the resulting visual feature, and it leads to the development
of a blood vessel attenuation algorithm. A database consisting of manually labelled masks was built in order
to test the performance of our method, which shows an encouraging success in blood vessel mitigation while
keeping other structures intact. Moreover, by extending our method to the only available polyp localization
algorithm tested on a public database, blood vessel mitigation proved to have a positive influence on the overall
performance.
1 INTRODUCTION
Colorectal cancer ranks in the third place in incidence
and it is the fourth most common cause of cancer
death worldwide (Segnan et al., 2011), with about
143.460 new cases expected in 2012 by the most re-
cent estimates of the American Cancer Society for the
number of colorectal cancer cases in the United States
only (American Cancer Society, 2012) Based on de-
mographic trends, the annual incidence is expected to
increase by nearly 80% to 2.2 million cases over the
next two decades and most of this increase will oc-
cur in the less developed regions of the world. For-
tunately, experience in Europe -where colorectal can-
cer is the second leading cause of cancer deaths with
approximately 435.000 new cases diagnosed yearly-
has shown that systematic early detection and treat-
ment has the potential to improve control of the dis-
ease (Segnan et al., 2011).
Colon cancer’s survival rate depends on the stage
it is detected on, decreasing from rates higher than
95% in the first stages to rates lower than 35% in
stages IV and V (Tresca, A., 2010); hence the im-
portance of detecting it on its early stages by us-
ing screening techniques, such as colonoscopy (Has-
singer et al., 2010). Colonoscopy is a procedure used
to see inside the colon and rectum, which has become
the gold standard to also detect and treat inflamed tis-
sue, ulcers, and abnormal growths among others.
During the last decades there is a trend to de-
velop intelligent systems that can provide additional
information to medical procedures. Those systems
aim to decrease the number of missdetections by pro-
viding intelligent support to clinical staff. Some ex-
amples include KARDIO (Bratko et al., 1990), (de-
veloped to interpret electrocardiograms) or systems
that aid on breast cancer detection (Wei et al., 2011)
or colonoscopy (Bernal et al., 2011). As depicted
on the last reference cited there are several possible
domains of application of an intelligent system for
colonoscopy, whether it is used as a tool to assist
in the diagnosis or as a way to measure objectively
the quality of the intervention. Nearly all the exist-
ing methods need of an identification of the elements
that appear on the endoluminal scene: lumen, wrin-
kles and folds, blood vessels, polyps, fecal content
and specular highlights (see Figure 1).
In this paper we will introduce a method for
colonoscopy images which will allow us to separate
information referring to blood vessels from scene ob-
jects related to the shape of the intestinal wall. By
means of our approach we are able to make a differ-
ence between 2-dimensional objects, like blood ves-
sels, and 3-dimensional objects, such as folds and
polyps. We follow the lines depicted in (Bernal et al.,
2012) which pointed out the use of energy images,
162
M. Núñez J., Bernal J., Sánchez J. and Vilariño F..
Blood Vessel Characterization in Colonoscopy Images to Improve Polyp Localization.
DOI: 10.5220/0004211601620171
In Proceedings of the International Conference on Computer Vision Theory and Applications (VISAPP-2013), pages 162-171
ISBN: 978-989-8565-47-1
Copyright
c
2013 SCITEPRESS (Science and Technology Publications, Lda.)
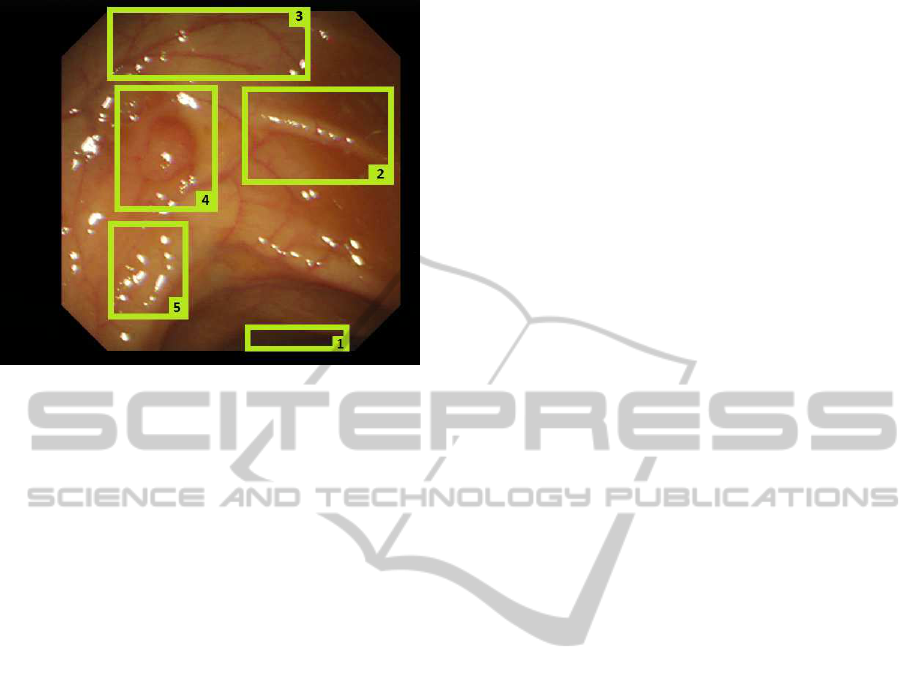
Figure 1: Graphical example of a typical endoluminal scene
from a colonoscopy video: 1) Lumen; 2) Wrinkles and
folds; 3) Blood vessels; 4) A polyp; 5) Specular highlights.
particularly the output of a valley detector, to make a
first approach to endoluminalscene object boundaries
detection. We provide a solution to mitigate the effect
of blood vessels on an energy image, which shows to
be useful to provide a more complete scene descrip-
tion and helps to improve the performance of current
polyp localization algorithms.
The structure of the paper is as follows: in Section
2 we present some ideas from other papers that have
inspired our work. In Section 3 we present our blood
vessels mitigation algorithm. In Section 4 we present
our experimental setup and show results of applying
our blood vessels mitigation method in colonoscopy
images. Finally in Section 5 we show the main con-
clusions that we extract from our work and present
some future research lines.
2 RELATED WORK
As mentioned in Section 1, there are several biblio-
graphic references devoted to the description of ele-
ments of the endoluminal scene. Regarding the scope
of this paper, we can divide the published works into
two different areas, namely: 1) Image enhancement
and preprocessing; and 2) Polyp localization.
There are several types of artifacts that are associ-
ated to colonoscopy video, which fundamentally con-
sists of color phantoms and specular highlights. Color
phantoms are caused by a temporal misalignment of
the color channels implied by the use of monochrome
CCD cameras in colonoscopy, which means that RGB
components are taken at different times and causes
a worsening on the quality that must be improved
(Arnold et al., 2011; Dahyot et al., 2008). Specular
highlights appear on the intestinal surface as an ef-
fect of frontal illumination, causing the apparition of
highly saturated regions in the image. There are sev-
eral approaches to detect and restore the surface be-
low the specular highlights (Arnold et al., 2010; Imai
et al., 2011).
Polyp localization concentrates the great major-
ity of the bibliography devoted to intelligent systems
for colonoscopy, which could be divided into shape-
based polyp localization (Bernal et al., 2012; Zhu
and Liang, 2010) and texture-based polyp localiza-
tion (Ameling et al., 2009; Tjoa and Krishnan, 2003),
only to mention a few. One relevant issue, which has
not received enough attention, relates to the impact of
the different elements of the endoluminal scene -such
as folds, wrinkles and vessels- in the overall perfor-
mance of thepolyp localization methods. Particularly,
up to our knowledge,thereis no existing work that has
paid attention to the role of blood vessels in polyp lo-
calization, and therefore, there is no concrete bibliog-
raphy about vessel detection in colonoscopy videos.
However, many different methods have been used
to provide a segmentation of blood vessels in two-
dimensional images. Most of them have been
tested in retinal or angiography images. Despite
the wide variability of enhancement steps and seg-
mentation methods they are usually separated in two
big groups: pixel-based methods and tracking-based
methods (Mendonca and Campilho, 2006).
• Pixel-based methods include different approaches
such as kernel-based methods, model-based tech-
niques, classifier-based methods or morphology-
based strategies. Kernel-based methods make use
of a convolution operator with a particular ker-
nel designed according to a model. The aim of
the convolution is usually to extract vessel bor-
ders or centerlines. A matched filter approach
based on Gaussian kernels is used in some meth-
ods to model the cross-section of a blood ves-
sel (Chaudhuri et al., 1989; Hoover et al., 2000).
These methods use Gaussian-shaped templates in
different orientations and scales to identify vessel
profiles. An example of model-based technique
(Jiang et al., 2003) proposed a knowledge-guided
adaptive thresholding framework where binariza-
tion is used to generate object hypotheses. Those
hypotheses are only accepted if they pass a ver-
ification procedure. Classifier-based methods in-
tend to assign each pixel in the image to the ves-
sel or non-vessel class. In this group we find what
the authors called a primitive-based method (Staal
et al., 2004). In this method a ridge detection is
performed as a first step to achieve a segmenta-
BloodVesselCharacterizationinColonoscopyImagestoImprovePolypLocalization
163

tion of the image. Afterwards, that information is
considered to classify regions and pixels. In some
examples a bayesian classifier is used after com-
puting feature vectors obtained by Wavelet Gabor
responses (Soareset al., 2006) or a neural network
is used after computing a feature vector based on
moment invariants-based features (Mar´ın et al.,
2011). Morphology-based techniques use mor-
phological operators to take advantage of shape
characteristics of blood vessels. Morphological
operators are usually combined with other tech-
niques. Other authors used the extraction of ves-
sel centerlines combined with local information
as the vessel length is followed by an iterative
vessel filling phase based on morphological fil-
ters (Mendonca and Campilho, 2006). Mathe-
matical morphology can also be combined with
curvature evaluation to differentiate vessels from
other structures (Zana and Klein, 2001).
• Tracking-based methods aim to obtain the vascu-
lature structure using local information to follow
vessel centerlines. Tracking techniques trace ves-
sels from selected starting points which usually
correspond to well known anatomical structures.
At each point a neighborhood is evaluated to de-
cide whether they are vessel candidate pixels re-
garding some kind of local information. The pro-
cess finishes when the pixels evaluated are con-
sidered to be end points. Other approaches that
can be included in this category are based on de-
formable or snake models. This techniques place
an active contour model near the aimed contour
and evolve it iteratively to fit the desired object
(Espona et al., 2007).
Many methods using techniques in different cat-
egories can also be found. For instance, some ap-
proaches combine a classification based on support
vector machine followed by a tracking stage based on
the Hessian matrix (Xu and Luo, 2010).
In our case the novelty of our approach lies in
the consideration of the presence of blood vessels
in polyp localization. Our proposal is based on the
only available method of automatic polyp localization
tested on a public database (Bernal et al., 2012). That
work only assesses the influence of specular reflec-
tions in the endoluminal scene in polyp localization
performance. We intend to improve that approach by
considering also the influence of blood vessels.
3 METHODOLOGY
Blood vessels appear in 2-dimensional images as
piecewise linear connected components. Unlike other
image types, such as retinal images, the vascular
structure in colonoscopy images is not connected in
a fully tree-like way nor a single-root tree. The con-
sequence of this is that spatial heuristics such as those
mentioned above are not helpful in this case. There-
fore, considering the previous definition, intensity
valleys in a monochromatic image are a good start-
ing point to detect the vascular structure, as confirmed
by the existing related works. However, it becomes an
overlybroad model in the case of colonoscopy images
since the endoluminal scene is made up of several ob-
jects of different nature. The problem with this simple
blood vessel model is that it also matches other visual
components of the endoluminal scene like boundaries
of specular highlights, shades, bubble edges, colon
wall folds or polyp contours.
In order to separate vessel information from the
remaining anatomical structures we propose the fol-
lowing scheming consisting of three different stages,
namely: 1) Image preprocessing; 2) Valley detection
and 3) Vessel mitigation.
3.1 Pre-processing
Our image preprocessing consists of two different
stages: obtaining images from interlaced video and
specular highlights detection and inpainting.
Interlaced video frame consists of two sub-fields
taken in sequence, each sequentially scanned at odd
and even lines of the image sensor (De Haan and
Bellers, 1998). In order to digitalize interlaced video
the two frames must be combined into a single frame
which leads to various undesired visual defects. To
avoid that problem we just select the odd frame from
each pair of frames and resize it to match the original
image proportions.
The method we use for specular highlights de-
tection and inpainting has already been presented
(Arnold et al., 2010), which has two different mod-
ules: the first one uses color balance adaptative
thresholds to determine the parts of specular high-
lights that present too high intensity to be part of non-
specular image content, that is, the saturated pixels
on the image. The second module refines the previ-
ous specular highlight detection by including pixels
nearby to saturated regions of the image that appear
to be either shadows of the original artifacts or cor-
respond to the less intense parts of the specular high-
lights in the image. The specular highlights inpaint-
ing is performed on two levels. In the first level the
image is modified by replacing all detected specular
highlights by the centroid colour of the pixels within
a certain distance range of the outline. In the second
level a weighted mask is used to combine the modi-
VISAPP2013-InternationalConferenceonComputerVisionTheoryandApplications
164

(a) (b) (c)
Figure 2: (a) Original image. (b) Specular highlights mask. (c) Output image.
fied image with the original one in a way such pixels
inside the specular highlight receive their value from
the modified image and pixels far from the highlight
have their original value unaltered.
An example of specular highlight detection and
inpainting can be seen in Figure 2.
3.2 Valley Detection
Our basic blood vessel model states that blood ves-
sels appear as valleys in monochromatic images.
Observation of colonoscopy images in RGB color
space shows that the green component is the one
that provides greater contrast between vessels and
background, which agrees with the generalized idea
regarding retinal images (Mendonca and Campilho,
2006). Therefore, the valley detection stage will have
as input the preprocessed green component. Since
vessels are described as piecewise linear connected
components, different linear feature detectors appear
as suitable candidates (Papari and Petkov, 2011).
Among those detectors, we selected to use matched
filters. It does not imply it to be the only possible so-
lution, considering that designing a valley detector is
not the aim of this preliminary study.
Blood vessels appear as darker line segments due
to its lower reflectance with respect to colon walls. It
prompted us to design our filter templates based on
second derivatives of anisotropic Gaussian kernels.
The kernel values are defined by the oriented Gaus-
sian function described by:
G
(σ
x
,σ
y
),θ
=
1
(2π)σ
x
σ
y
e
−
˜x
2
2σ
2
x
+
˜y
2
2σ
2
y
(1)
where (σ
x
, σ
y
) are the scales in the correspondingaxis
and θ is the rotation angle of the filter. ˜x and ˜y are the
coordinates given by the rotation angle. Hence they
are defined as:
˜x = xcosθ + ysinθ
˜y = xsinθ− ycosθ
(2)
As we use anisotropic Gaussians with σ = σ
x
=
2σ
y
the Gaussian function results in:
G
σ,θ
=
1
(2π)2σ
2
e
−
˜x
2
2(2σ)
2
+
˜y
2
2σ
2
(3)
Therefore, since we are modelling blood vessel
profiles with second derivatives of anisotropic Gaus-
sian kernels, the kernel will be defined as:
∂
2
˜y
G
σ,θ
=
˜y
2
− 1
σ
4
G
σ,θ
(4)
We apply a normalization so that the geometry of
the valleys is priorized:
G
N
σ,θ
:=
k∂
2
˜y
G
σ,θ
∗ Ik
k∂
2
˜y
G
σ,θ
kkIk
(5)
where k · k stands for the L
2
integral norm and ∗ de-
noting the convolution operator.
The kernels are applied for 8 equally distributed
orientations and scales σ = [2, 4, 6], which cover all
vessels width in our test dataset. It all means we have
24 output images, each of them corresponding to a
determined orientation and scale. Hence, the output
I
valleys
must be a combination of all of them, defined
as follows:
I
valleys
= max
i, j
G
N
σ
i
,θ
j
(6)
Prior to the valley detection method described
above, structure preserving diffusion (Gil et al., 2009)
is applied in order to remove image surface irregular-
ities while preserving image structure. The output of
this stage, I
valleys
, is a gray level image in which the
higher the value of a pixel, the higher the chances of
that pixel to be part of a valley. See Figures 3(a), 3(b)
and 3(c) for an example of the process described so
far.
BloodVesselCharacterizationinColonoscopyImagestoImprovePolypLocalization
165
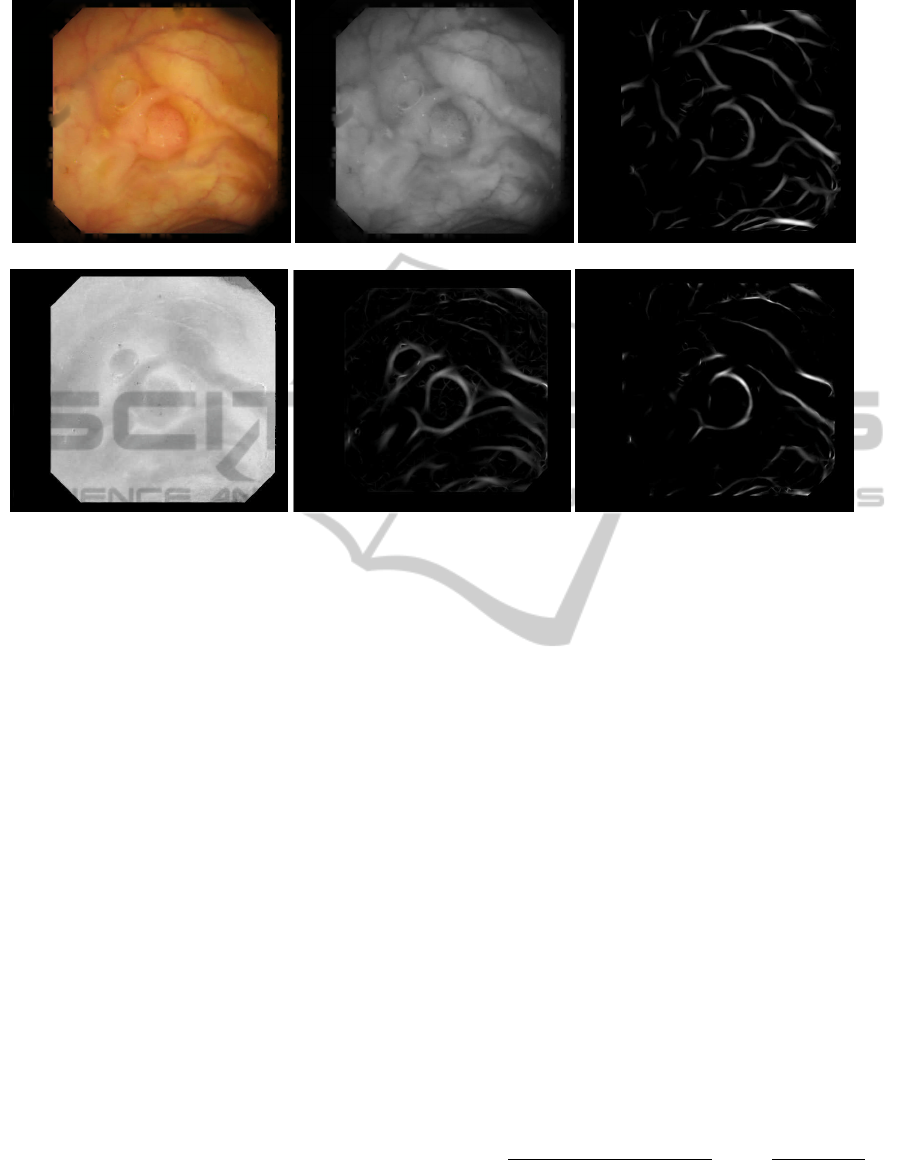
(a) (b) (c)
(d) (e) (f)
Figure 3: (a) Image after highlight removal. (b) Green component. (c) Valley energy image. (d) Saturation (HSV space). (e)
Shadings energy image. (f) Final output energy image.
3.3 Vessel Mitigation
With regard to intensity values, both blood vessels
and shadings from folds and wrinkles appear as elon-
gated regions which are darker than intestinal walls in
the background. Previous work showed that shadings
from all the endoluminal structures can be approxi-
mated by the Phong’s model (Bernal et al., 2012),
which includes ambient, diffused and specular com-
ponents. Specular reflections have a spectral distri-
bution nearly the same as the incident light but the
diffuse component depends also on the object proper-
ties (Shafer, 1985). The ambient component is a non-
directional source that groups environmental inter-
reflections (Blinn, 1977). The resulting color of a
given region in the endoluminal scene will depend on
the orientation of the light source, which is coupled
to the camera with its same orientation. In that sense,
the dark areas created by folds are never oriented to
the light source, and thus the nature of their color is
conditioned by this orientation. Local variations of
surface orientation in folds affect to the components
in a different way. Specular reflection contribution
decreases more quickly than the diffuse component
in regions not oriented to the camera. Besides, since
the diffuse component depends on the surface reflec-
tive properties and the surface orientations, regions
which are not oriented to the camera, such as parts
of folds and wrinkles, will appear as more saturated
in color. In these regions the contribution of the spec-
ular component is lower, and the diffuse component
will contribute to a higher saturation in color. Con-
versely, blood vessels are flat visual features that can
be found in regions with any kind of orientation so
that the nature of their color is not affected differently
than the surrounding areas.
These considerations about the nature of the ob-
jects in the endoluminal scene based on its illumi-
nation led us to explore HSV color space (Joblove
and Greenberg, 1978), since it decouples the inten-
sity of the image -which conveys no discriminative
power between vessels and shadings- from its chro-
matic components. In HSV space H, S and V stand
for hue, saturation and value, respectively. Hue is as-
sociated with the dominant wavelength in the color
spectrum. Saturation refers to the amount of white
light mixed with that dominant wavelength and it is
defined as:
S =
max(r, g, b) − min(r, g, b)
max(r, g, b)
= 1−
min(r, g, b)
max(r, g, b)
(7)
Assuming that colon wall properties remain un-
changed at folds and wrinkles, the different color they
VISAPP2013-InternationalConferenceonComputerVisionTheoryandApplications
166
show is to be related exclusivelyto changes in the illu-
minant contribution. Therefore, fold/wrinkle regions
will have higher levels of saturation than the neigh-
bouring colon wall regions. An exhaustive test on
our test dataset confirmed that color-saturation levels
in vessel regions appear to be systematically closer
to the levels of the adjoining background intestinal
walls (see an example in Figure 3(d)). Consequently,
fold/wrinkle regions can be described as piecewise
linear connected regions in the saturation component
image. An energy image describing the presence of
folds and wrinkles in the scene, I
shadings
, can be com-
puted using the techniques exposedin Section 3.2 tak-
ing the complementary of saturation as input. Figure
3(e) shows an example of this result. The final output
image,I
out
, (see Figure 3(f)) will be computed as:
I
out
(x, y) = I
valleys
(x, y)I
shadings
(x, y) (8)
This resulting image is expected to enhance shad-
ings from folds, wrinkles and polyps while mitigating
blood vessels.
4 EXPERIMENTAL RESULTS
4.1 Experimental Setup
One of the problems when testing the performance
of an algorithm is that validation should be done on
a consistent database. Sadly it is very difficult to
find any online database with data from colonoscopy
video, as they are usually confidential. Neverthe-
less, a public dataset from colonoscopy video has
been made available recently (Machine Vision Group,
CVC, 2012). This dataset consists of 380 imagesfrom
15 different colonoscopy videos. Each frame con-
tains a polyp but the authors have focus on showing as
many different polyp appearances as possible. From
now on, we will referred to this dataset as the CVC-
ColonDB.
As we are interested on blood vessels mitigation
we selected and annotated a subdataset of 29 images
following as a criterion the presence of blood vessels.
Blood vessels have been labelled manually by experts
in order to create blood vessels masks. This dataset
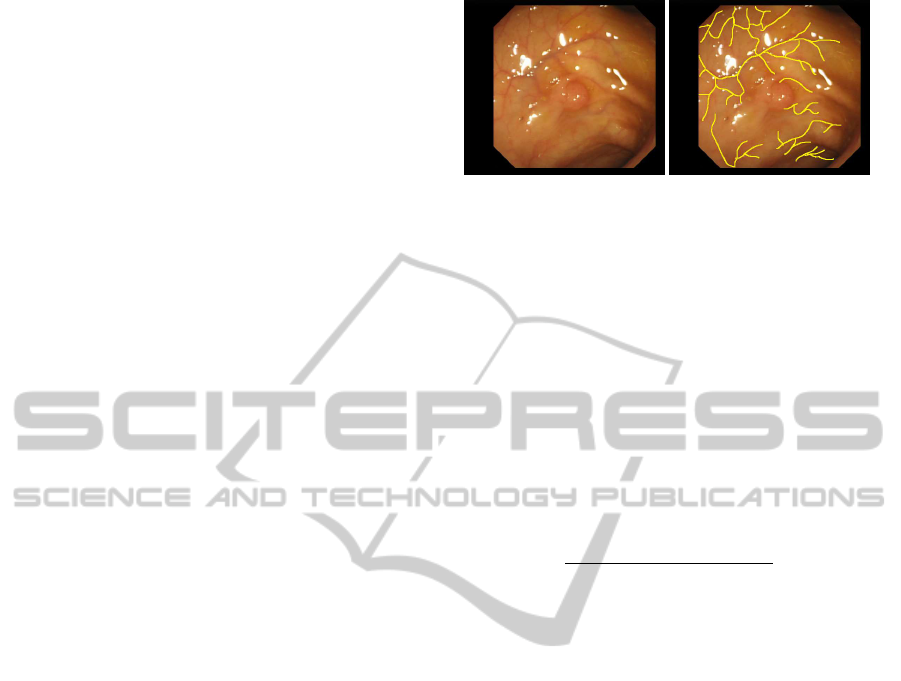
will be referred as the Vessel Dataset. An example of
our Vessel Dataset can be seen in Figure 4.
Several experiments were developed to assess
quantitatively the performance of our method on mit-
igating blood vessels. More specifically, we want to
compare the energy corresponding to blood vessels in
both the valley energy image and the valley energy
image after blood vessel mitigation.
(a) (b)
Figure 4: Example of Vessel Dataset: (a) Original image.
(b) Blood vessels mask superimposed on the original image.
As our vessel masks have been created only as de-
scriptors of its trace without any width information,
we dilated the masks of blood vessels using morpho-
logical operators to provide us with a region of blood
vessel influence. It allows us to separate the energy
in blood vessel regions from the energy in non-vessel
regions. Given L
v
as the vessel mask and ⊕ as the
dilation operator, vessel energy, E
v
, in the considered
energy image I is defined in 9.
E
v
=
∑
(x,y)∈I
I(x, y)(L
v
⊕ S
r
)(x, y)
∑
(x,y)∈I
I(x, y)
∗ 100 (9)
Consequently, the total energy in an image, E
total
,
will satisfy:
E
total
= E
v
+ E
nv
= 100; (10)
which describes the balancing of energy between ves-
sels and non-vessels as a percentage of contribution.
4.2 Vessel Mitigation
The proposed metrics have been computed for both
the valley energy images and the valley energy im-
ages after vessel energy removal. Figure 5(a) shows
E
v
performance metric for each image in the whole
Vessel Dataset already introduced. The figure allows
us to verify the decrease of energy in areas previously
identified as blood vessels as well as the variability of
that decrease. The decrease of energy referred to ves-
sels depends on the content of visual objects on the
image. Images which had a high degree of vascular
content prior to our processing and no folds interfer-
ing with them suffer an important decrease. Never-
theless, images whose vascular content was low or its
trace is close or strongly crossed by folds do not show
remarkable differences in terms of vessel energy, as
expected. An example of both situations can be seen
in Figure 6. First row in the figure shows an example
where the input image has a large amount of vascular
BloodVesselCharacterizationinColonoscopyImagestoImprovePolypLocalization
167
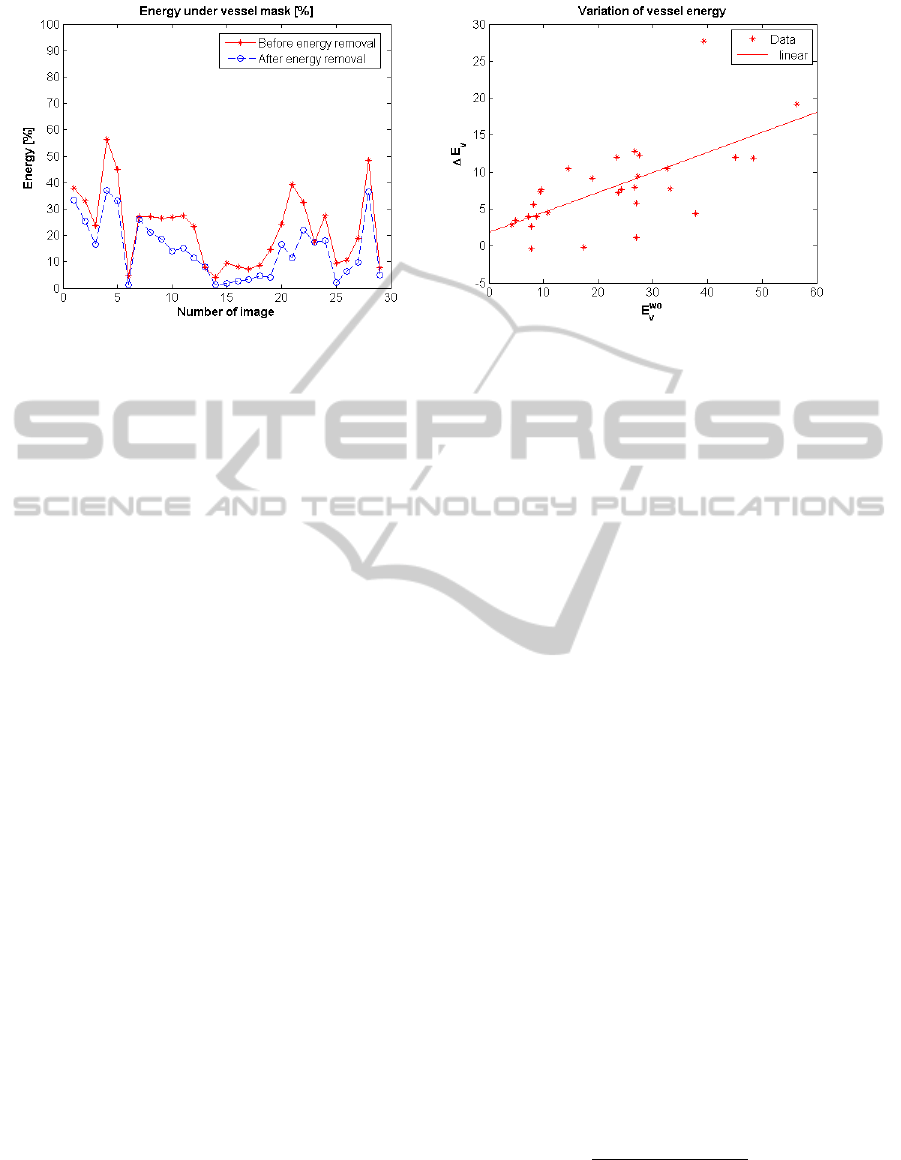
(a) (b)
Figure 5: (a) Energy under vessel mask for each image. (b) Variation of vessel energy regarding vessel energy at input.
content in a clear surface not interfered with shades
or folds. The example in the second row contains few
vascular content and many clear folds. For this rea-
son, folds and shades keep most of the image energy
after vessel detection and vessel energy removal has
less impact. Figure 5(b) plots the variation of energy
under vessel masks regarding the energy under ves-
sel mask prior to our removal step. The increase of
energy, ∆E
v
, is defined so that a positive value corre-
sponds to vessel energy decrease:
∆E
v
= E
wo
v
− E
w
v
(11)
where E
wo
v
is the energy image without vessel mitiga-
tion and E
w
v
is the energy image with vessel mitiga-
tion. We can see that the energy decrease is related
to the energy at the beginning of the process (Pear-
son correlation coeficient of 0.65). The results re-
garding energy in non-vessel regions are the comple-
mentary of the ones presented in Figure 5(a) as stated
in Equation 10. Therefore, we can also affirm that
regions which has been manually identified as non-
vessels does not suffer substantial energy decrease.
4.3 Application to Polyp Localization
As mentioned in Section 1, our objective is to pro-
vide a first approximation of a blood vessels charac-
terization. This characterization could be useful to
provide a better scene description, but it also shows
to provide relevant information for some other appli-
cations such as helping in polyp localization. There
are several approaches to polyp localization and some
of them have been introduced in Section 2. In this
section we will measure how the characterization of
blood vessels could be useful to improve the only cur-
rent available results on polyp localization that are
obtained in a public database, already introduced as
CVC-ColonDB database (Bernal et al., 2012). In our
case, we will use the output of our processing scheme
as the depth of valleys image, and we will measure
the accumulation of energy by using the SA-DOVA
descriptor. SA-DOVA descriptor defines an accumu-
lation image by using data from the depth of valleys
image. The value for each pixel is calculated in the
following way: a series of sectors centered on each
pixel accumulate, for each direction, the maxima of
the depth of valleys image. Therefore, the accumula-
tion value is computed as:
Acc(x) =
Z
α=2π
α=0
max
r∈[R
min
,R
max
]
E
radii
(α)dα (12)
where E
radii
is equal to:
E
radii
(α) = E(x+ r ∗ (cos(α),sin(α))) (13)
where R
min
and R
max
are the minimum and maximum
radii of the sectors used to generate the accumulation
image and E the energy image. Our hypothesis is that
by identifying which parts of the energy image corre-
spond to blood vessels information we could be able
to mitigate their effect and check if the energy inside
and outside the polyp changes. The metric that we
will use in this experiments is:
E
p
=
∑
(x,y)∈I
I(x, y)L
p
(x, y)
∑
(x,y)∈I
I(x, y)
∗ 100 (14)
where L
p
is the polyp mask from the Polyp Dataset.
We measure the percentage of energy inside the polyp
VISAPP2013-InternationalConferenceonComputerVisionTheoryandApplications
168
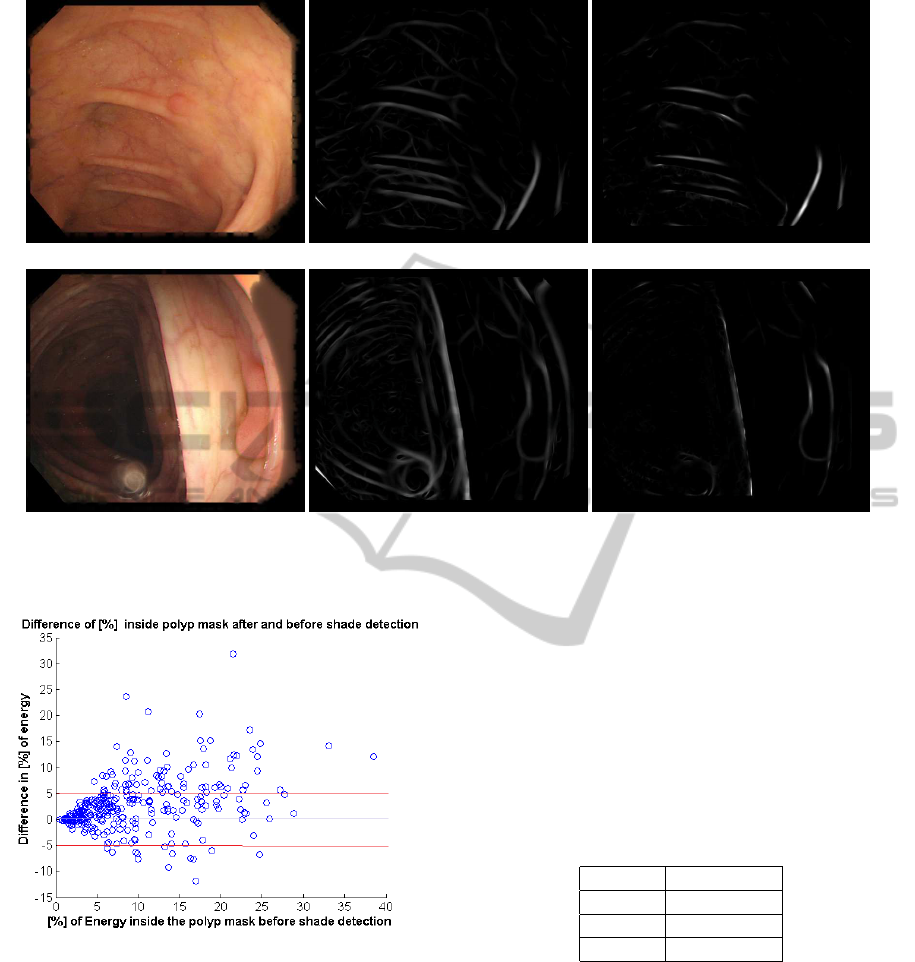
(a) (b) (c)
(d) (e) (f)
Figure 6: Example 1: (a) Input image. (b) Valley energy image. (c) Energy image after energy removal). Example 2: (d)
Input image. (e) Valley energy image. (f) Energy image after energy removal.
Figure 7: Difference of percentage of energy under polyp
mask before and after blood vessel energy mitigation.
mask whereas the energy outside the polyp will be the
complementary. We expect that a polyp localization
decision scheme based on the amount of energy con-
centrated on some area of the image will benefit from
a blood vessel mitigation system which reduces the
presence of vessel energy. We measure the increment
of energy inside the polyp mask as:
∆E
p
= E
w
p
− E
wo
p
(15)
where E
wo
p
stands for the energy image without vessel
mitigation and E
w
p
stands for the energy image with
vessel mitigation. That difference of energy, ∆E
p
, re-
ferrer to E
wo
p
is plotted in Figure 7. Table 1 shows
that we improvethe amount of energy inside the polyp
mask in a large majority of images (217). This is true
even considering that an increase or decrease lower
than a 5% can be assumed as not significant (74 im-
proved images).
Table 1: Difference of percentage of energy under polyp
mask with and without blood vessel mitigation.
∆E
p
# of images
> 0 217
> 5% 74
< −5% 13
To conclude with this section, we will show the di-
rect impact that blood vessels mitigation has on polyp
localization. In this case we will use the same polyp
localization criteria than the one depicted in (Bernal
et al., 2012), that is, measuring if the maxima of the
accumulation image is placed inside the polyp mask.
We can see a comparison between the results before
and after applying our blood vessel energy mitigation
in Table 2.
As we can see fromTable 2, by applyingour blood
vessel mitigation algorithm the maxima of the accu-
mulation image is placed inside the polyp mask in 47
BloodVesselCharacterizationinColonoscopyImagestoImprovePolypLocalization
169
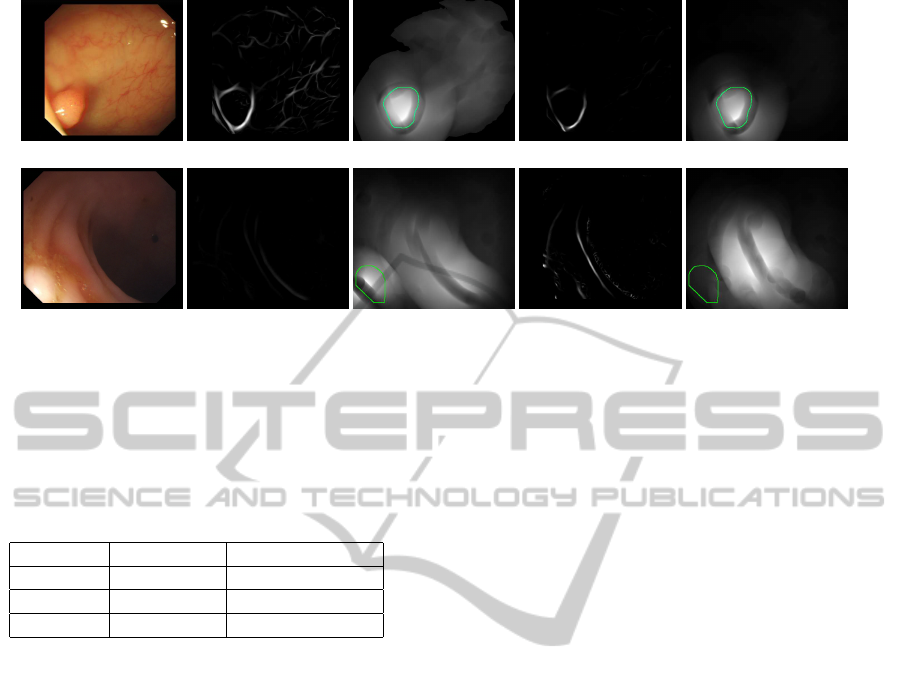
(a) (b) (c) (d) (e)
(f) (g) (h) (i) (j)
Figure 8: Example 1: (a) Original images. (b) Energy image before shade detection. (c) Accumulation image before shade
detection. (d) Energy image after shade detection. (e) Accumulation image after shade detection (polyp region marked in
green). Example 2: (f) Original images. (g) Energy image before shade detection. (h) Accumulation image before shade
detection. (i) Energy image after shade detection. (j) Accumulation image after shade detection (polyp region marked in
green).
Table 2: Polyp localization results (placing accumulation
maxima inside polyp mask): comparing results using vessel
mitigation with no vessel mitigation.
# of images Polyp Dataset %
improved 47 15.67%
worse 8 2.67%
same 245 81.67%
more images (15.67%), the results were worse for 8
(2.67%), and no modification took place for 245 im-
ages (81.67%). This preliminary study shows that
blood vessel mitigation can be a key part in the im-
provement of a polyp localization scheme, as it does
have an impact on direct polyp localization results.
Finally we show in Figure 8 some qualitative results
of the comparison of the accumulation images before
and after applying our processing scheme. The first
row shows a positive example, where the percentage
of energy inside the polyp grows after applying vessel
mitigation whereas the second row shows a negative
example.
5 CONCLUSIONS
In this paper we introduced a characterization for
blood vessels which allowed us to model them differ-
ently than other objects in a endoluminal scene, more
specifically folds and wrinkles. We presented a pro-
cedure for mitigating blood vessels which consists of
three stages: 1) Image preprocessing, to correct arti-
facts from the original image such as specular high-
lights; 2) Valley detection, to provide a first charac-
terization of the objects in the image, and 3) Valley
mitigation as a novel method which aims to discrim-
inate between objects that have shades from objects
that do not have them, such as blood vessels.
Our experiments show an encouraging trend, in-
dicating that there is a decrease of energy on blood
vessel areas. Quantitative results suggest that our
method is able to achieve vessel mitigation success-
fully and that mitigation is more important on im-
ages with more blood vessel content. Our procedure
was used to improve the only existing polyp localiza-
tion method that has been tested in a public database.
As expected, the polyp localization decision scheme
-based on the amount of energy concentrated on some
area- benefited from a blood vessel mitigation system
which reduces the presence of vessel energy. This is
the first time that the impact of blood vessels in polyp
localization has been measured quantitatively, prov-
ing that their presence makes it harder to identify 3-
dimensional objects such as polyps.
Regarding future work, vessel characterization
should be validated on a bigger manually labelled
dataset. It should also involve the consideration of
the superposition of blood vessels and other elements
in the endoluminal scene. The appearance of vessels
in folds must prompt us to add more information to
the improved characterization presented in this work.
ACKNOWLEDGEMENTS
This work was supported in part by the Spanish
Gov. grants TIN2012-33116, MICINN TIN2009-
VISAPP2013-InternationalConferenceonComputerVisionTheoryandApplications
170

10435 and Consolider 2010 MIPRCV (CSD2007-
00018), and the UAB grants 471-01-2/2010 and 471-
01-3/2008.
REFERENCES
Ameling, S. et al. (2009). Texture-based polyp detection in
colonoscopy. Bildverarbeitung f¨ur die Medizin 2009,
pages 346–350.
American Cancer Society (2012). What are the key statis-
tics about colorectal cancer? [Online; accessed 7-
September-2012].
Arnold, M. et al. (2010). Automatic segmentation and in-
painting of specular highlights for endoscopic imag-
ing. Journal on Image and Video Processing, 2010:9.
Arnold, M. et al. (2011). Quality Improvement of En-
doscopy Videos. In Proceedings of the 8th IASTED
International Conference on Biomedical Engineering,
Insbruck, Austria.
Bernal, J. et al. (2011). Colonoscopy Book 1: Towards In-
telligent Systems for Colonoscopy. In-Tech.
Bernal, J. et al. (2012). Towards automatic polyp detection
with a polyp appearance model. Pattern Recognition,
45(9):3166 – 3182.
Blinn, J. (1977). Models of light reflection for computer
synthesized pictures. In ACM SIGGRAPH Computer
Graphics, volume 11, pages 192–198. ACM.
Bratko, I. et al. (1990). KARDIO: a study in deep and qual-
itative knowledge for expert systems. MIT Press.
Chaudhuri, S. et al. (1989). Detection of blood vessels in
retinal images using two-dimensional matched filters.
IEEE Transactions on medical imaging, 8(3):263–
269.
Dahyot, R., Vilari˜no, F., and Lacey, G. (2008). Improving
the quality of color colonoscopy videos. Journal on
Image and Video Processing, 2008:1–7.
De Haan, G. and Bellers, E. (1998). Deinterlacing-an
overview. Proceedings of the IEEE, 86(9):1839–1857.
Espona, L. et al. (2007). A snake for retinal vessel segmen-
tation. Pattern Recognition and Image Analysis, pages
178–185.
Gil, D. et al. (2009). Structure-preserving smoothing of
biomedical images. In Computer Analysis of Images
and Patterns, pages 427–434. Springer.
Hassinger, J. et al. (2010). Effectiveness of a Multimedia-
Based Educational Intervention for Improving Colon
Cancer Literacy in Screening Colonoscopy Patients.
Diseases of the Colon & Rectum, 53(9):1301.
Hoover, A. et al. (2000). Locating blood vessels in retinal
images by piecewise threshold probing of a matched
filter response. Medical Imaging, IEEE Transactions
on, 19(3):203–210.
Imai, Y. et al. (2011). Estimation of multiple illuminants
based on specular highlight detection. Computational
Color Imaging, pages 85–98.
Jiang, X. et al. (2003). Adaptive local thresholding by
verification-based multithreshold probing with appli-
cation to vessel detection in retinal images. Pattern
Analysis and Machine Intelligence, IEEE Transac-
tions on, 25(1):131–137.
Joblove, G. and Greenberg, D. (1978). Color spaces
for computer graphics. ACM SIGGRAPH Computer
Graphics, 12(3):20–25.
Machine Vision Group, CVC (2012). Cvc-colondb: A
database for assessment of polyp detection. [Online;
accessed 24-July-2012].
Mar´ın, D. et al. (2011). A new supervised method for blood
vessel segmentation in retinal images by using gray-
level and moment invariants-based features. Medical
Imaging, IEEE Transactions on, 30(1):146–158.
Mendonca, A. and Campilho, A. (2006). Segmentation of
retinal blood vessels by combining the detection of
centerlines and morphological reconstruction. Med-
ical Imaging, IEEE Transactions on, 25(9):1200–
1213.
Papari, G. and Petkov, N. (2011). Edge and line oriented
contour detection: State of the art. Image and Vision
Computing, 29(2-3):79–103.
Segnan, N. et al. (2011). European guidelines for quality
assurance in colorectal cancer screening and diagno-
sis. Luxembourg: Publications Office of the European
Union.
Shafer, S. (1985). Using color to separate reflection compo-
nents. Color Research & Application, 10(4):210–218.
Soares, J. et al. (2006). Retinal vessel segmentation using
the 2-d gabor wavelet and supervised classification.
Medical Imaging, IEEE Transactions on, 25(9):1214–
1222.
Staal, J. et al. (2004). Ridge-based vessel segmentation in
color images of the retina. Medical Imaging, IEEE
Transactions on, 23(4):501–509.
Tjoa, M. and Krishnan, S. (2003). Feature extraction for the
analysis of colon status from the endoscopic images.
BioMedical Engineering OnLine, 2(9):1–17.
Tresca, A. (2010). The Stages of Colon and Rectal Cancer.
New York Times (About.com), page 1.
Wei, J. et al. (2011). Computer-aided detection of breast
masses: Four-view strategy for screening mammogra-
phy. Medical Physics, 38:1867.
Xu, L. and Luo, S. (2010). A novel method for blood vessel
detection from retinal images. BioMedical Engineer-
ing OnLine, 9(1):14.
Zana, F. and Klein, J. (2001). Segmentation of vessel-like
patterns using mathematical morphology and curva-
ture evaluation. Image Processing, IEEE Transactions
on, 10(7):1010–1019.
Zhu, H. and Liang, Z. (2010). Improved Curvature Estima-
tion for Shape Analysis in Computer-Aided Detection
of Colonic Polyps. Beijing, China, page 19.
BloodVesselCharacterizationinColonoscopyImagestoImprovePolypLocalization
171
