
A Study on the Role of Similarity Measures in Visual Text Analytics
F. San Roman S.
1
, R. D. de Pinho
2
, R. Minghim
1
and M. C. F. de Oliveira
1
1
Instituto de Ci
ˆ
encias Matem
´
aticas e de Computac¸
˜
ao, Universidade de S
˜
ao Paulo, S
˜
ao Carlos, Brazil
2
Minist
´
erio da Ci
ˆ
encia, Tecnologia e Inovac¸
˜
ao, Bras
´
ılia, Brazil
Keywords:
Visual Text Analytics, Visual Text Mining, Vector Space Model, High-dimensional Data Visualization and
Multidimensional Projections.
Abstract:
Text Analytics is essential for a large number of applications and good approaches to obtain visual mappings
of text are paramount. Many visualization techniques, such as similarity based point placement layouts, have
proved useful to support visual analysis of documents. However, they are sensitive to data quality, which, in
turn, relies on a critical preprocessing step that involves text cleaning and in some cases term detecting and
weighting, as well as the definition of a similarity function. Not much has been discussed on the effect of
these important similarity calculations in the quality of visual representations. This paper presents a study on
the role of different text similarity measurements on the generation of visual text mappings. We focus mainly
on two types of distance functions, those based on the well-known text vector representation and on direct
string comparison measurements, comparing their effect on visual mappings obtained with point placement
techniques. We find that both have their value but, in many circumstances, the vector space model (VSM)
is the best solution when discrimination is important. However, the VSM is not incremental, that is, new
additions to a collection force a recalculation of the whole feature space and similarities. In this work we also
propose a new incremental model based on the VSM, which is shown to present the best visualization results
in many configurations tested. We show the evaluation results and offer recommendations on the application
of different text similarity measurements for Visual Text Analytics tasks.
1 INTRODUCTION
Producing visualizations from textual documents re-
quires a pre-processing step in which similarity evalu-
ation plays a fundamental role. Often, a Vector Space
Model (VSM) (Salton et al., 1975) that considers the
frequency of relevant words is created, over which co-
sine distance approximates text dissimilarity. Little is
known about how this pre-processing affects the out-
come of text visualization techniques.
The VSM poses many limitations for visualiza-
tion purposes, as it fails to capture semantics im-
plicit in the relationships among words and terms.
Moreover, in building a meaningful VSM several pre-
processing operations require parameter settings that
may affect the outcome considerably. Resulting mod-
els are typically described by very high-dimensional
feature spaces, which suffer from drawbacks globally
referred to as ‘the curse of dimensionality’ (Huang
et al., 2005) that result in low discrimination power
by most techniques.
VSM models may be avoided altogether by us-
ing direct string comparison functions (Telles et al.,
2007). Adding documents to a collection does not
impact the underlying model, since it suffices to com-
pare the new document with the existing ones. Many
such measures have been defined, for different pur-
poses and applications. Again, there is little record on
how their choice affects text analytics, visual or other-
wise, and the question remains on how they compare
with cosine distances calculated over the VSM.
We are concerned with assessing how the choice
of a (dis)similarity function affects the output of
content-based visualization techniques. We consider
visualizations that lay out documents as points on
a plane based on their similarity, to verify how the
choice of a similarity function affects their quality
in terms of discriminating groups of text files with
highly related content. We also address the additional
limitation that computing a VSM requires the com-
plete collection to be available a priori, rendering
it incapable of handling streaming text. This paper
investigates these issues, reporting on the following
questions:
1. are string distance measures suitable for text
visualizations based on similarity? which
429
San Roman S. F., D. de Pinho R., Minghim R. and C. F. de Oliveira M..
A Study on the Role of Similarity Measures in Visual Text Analytics.
DOI: 10.5220/0004214004290438
In Proceedings of the International Conference on Computer Graphics Theory and Applications and International Conference on Information
Visualization Theory and Applications (IVAPP-2013), pages 429-438
ISBN: 978-989-8565-46-4
Copyright
c
2013 SCITEPRESS (Science and Technology Publications, Lda.)

measures may be considered and how their
choice affects the visualizations?
2. how do string distances compare with the tra-
ditional cosine distance computed over the
VSM regarding visualization quality?
3. is it possible to represent a dynamic collec-
tion, updating a vector model as documents
are added? how visualizations built from such
a model compare to those obtained with the
conventional VSM and with string distances?
2 RELATED WORK
The VSM with tf-idf measure of terms deemed rel-
evant is the typical input representation to most text
visualization and text clustering techniques. Visu-
alizations may be derived directly from such repre-
sentations, e.g. as in various Multidimensional Scal-
ing (MDS) approaches (Wise et al., 1995; Paulovich
et al., 2008; Paulovich and Minghim, 2008). Hier-
archical similarity-based layouts have also been pro-
posed and illustrated for visualizing textual docu-
ments, e.g. the Neighbor-Joining tree (Cuadros et al.,
2007).
The Incremental Board - incBoard (Pinho et al.,
2009) and the Incremental Space (Pinho et al., 2010)
also derive text collection visualizations. They are, by
design, more suited for handling dynamic collections
in which documents are added gradually. These tech-
niques inspired the Incremental Vector Space Model
(iVSM) introduced in Section 4.
Alternatively, vector models may be derived with
topic extraction techniques such as Latent Semantic
Analysis (Landauer et al., 2007) and Latent Direchlet
Allocation (LDA) (Blei et al., 2003), usually produc-
ing lower-dimensional feature spaces. Topics are also
often extracted to annotate similarity-based visualiza-
tions, based, for instance, on LDA (Wei et al., 2010)
or on association rule mining (Lopes et al., 2007) to
derive topic-oriented views.
Streamit shows real-time views of streaming doc-
uments (Alsakran et al., 2012) built from a dynamic
2D similarity layout computed with a fast imple-
mentation of a force-based projection. Handling
streams poses additional challenges to text visualiza-
tions based on content similarity. In this solution text
documents are described by dynamic keyword vec-
tors, and in computing the cosine similarity a param-
eter I
k
is introduced to account for the importance of
a keyword k at a particular time. Importance may be
determined automatically based on various parame-
ters and it may be modified by users based on their
perception. LDA is employed to reduce feature space
dimensionality. Each topic is associated with a set of
keywords, and documents are represented by a vector
of the probable weights of their topics. Besides reduc-
ing dimensionality, the topics are at a higher semantic
level than terms and likely to produce more meaning-
ful document clusters. However, the topic model is
extracted from an existing similar collection, as the
collection displayed is not available initially.
We are unaware of previous studies on how the
choice of the similarity function affects the outcome
of text visualizations. There are, however, studies
that report comparisons of string distance functions
in other application domains. (Cohen et al., 2003)
compare the performance of several distance metrics
for the tasks of matching and clustering lists of entity
names. SecondString is an open-source Java toolkit
that incorporates several string metrics for matching
names and records, including some novel hybrids of
well-known methods. Authors computed three eval-
uation measures, the non-interpolated average preci-
sion, the maximum F1 score and the interpolated pre-
cision at eleven recall levels. In general, the best
results were obtained with the hybrid distances pro-
posed by them.
(Kempken et al., 2006) compare the performance
of selected distances to support retrieval of historical
spelling variants in historical text documents. Ex-
periments were conducted on a dataset of historical
spellings manually collected from historical German
documents, containing a list of word pairs. Distances
were evaluated with the precision and recall mea-
sures, and the best performance was obtained with a
stochastic distance.
3 STRING SIMILARITY
MEASURES
String distance functions map a pair of strings X and
Y to a real number r, where higher values of r indicate
greater dissimilarity between X and Y. String similar-
ity functions, on the other hand, return higher values
for r as X and Y are more similar, and distances may
be generated taking the value 1 −r. In this section we
briefly present string distance and similarity functions
employed in this study.
One important class of string distance functions
are the so-called edit distances, which return the min-
imum number of editing operations required to trans-
form a string into the other. Typical editing oper-
ations are character insertion, deletion and substitu-
tion, and each one is assigned a cost. Two strings X
and Y may also be considered as multisets of words
(substrings or tokens), and several token-based mea-
IVAPP2013-InternationalConferenceonInformationVisualizationTheoryandApplications
430

Table 1: Token-based measures. Function Q(·) returns the
number of tokens in the input string, P(·) returns the num-
ber of characters, qG(·) returns the number of substrings of
length q, XY stands for a concatenation of X and Y, and C(·)
returns the size, in bytes, of the compressed input string.
Name Similarity
Dice’s Coefficient
2 ∗ Q(X
0
∩Y
0
)
Q(X
0
) + Q(Y
0
)
(1)
Cosine
Q(X
0
∩Y
0
)
p
Q(X
0
) ∗ Q(Y
0
)
(2)
Matching Coefficient
Q(X
0
∩Y
0
)
max
{
Q(X
0
), Q(Y
0
)
}
(3)
Overlap Coefficient
P(X
0
∩Y
0
)
min
{
P(X
0
), P(Y
0
)
}
(4)
Q-gram
2 ∗ qG(X
0
∩Y
0
)
qG(X
0
) + qG(Y
0
)
(5)
NCD
C(XY ) − min
{
C(X ),C(Y)
}
max
{
C(X ),C(Y)
}
(6)
NCDs
NCD(X , Y ) +
NCD(X , X) + NCD(Y, Y )
2
(7)
sures are defined. Given two token sets X
0
and Y
0
de-
rived from X and Y several similarity functions may
be defined, as described in Table 1. In Section 6 we
compare these and other distance measures in gener-
ating (dis)similarity-based visualizations of text col-
lections.
4 iVSM: A DYNAMIC VECTOR
SPACE MODEL
The Incremental Vector Space Model (iVSM) has been
proposed to represent text documents of an incremen-
tal collection (Pinho et al., 2010). As in the orig-
inal VSM, each dimension represents the tf-idf fre-
quency of a relevant term. As not all documents are
known a priori, an initial representation of the un-
known collection is approximated from the VSM con-
structed for a similar known collection (e.g., news, or
scientific papers). This approximate initial represen-
tation is called a ‘language model’, and provides an
initial set of relevant terms, their frequency (T F) and
the number of documents in which they occur (DF).
The iVSM is constructed by continuously updating
the language model (the TF and DF term countings)
as new documents are added to the collection (or ex-
isting documents are removed).
The process is illustrated with a hypothetical col-
lection with N documents and M terms, for which a
VSM has been created, as shown in Table 2, where
α
i j
stands for the frequency count of term t
j
in docu-
ment d
i
. A so-called language model for this collec-
tion is defined as shown in Table 3. DF
j
is the number
documents that include the term j, and T F
j
is the fre-
quency of term j, as computed by Eq. 8.
Table 2: Vector space model (VSM) representation of a col-
lection with N documents. Rows refer to documents and
columns to terms that occur in the documents: α
i j
denotes
the frequency of term t
j
in document d
i
.
t
1
t
2
. . . t
M
d
1
α
11
α
12
. . . α
1M
d
2
α
21
α
22
. . . α
2M
.
.
.
.
.
.
.
.
.
.
.
.
.
.
.
d
N
α
N1
α
N2
. . . α
NM
Table 3: Language model of the collection: each row rep-
resents a VSM term, as shown in Table 2. Column T F in-
forms overall term frequencies and column DF informs how
many documents include the corresponding term.
Term TF DF
t
1
T F
1
DF
1
t
2
T F
2
DF
2
.
.
.
.
.
.
.
.
.
t
M
T F
M
DF
M
T F −IDF
j
=
∑
N
i=1
α
i j
log
N
DF
j
(8)
The language model in Table 3 provides the de-
parting point to build the iVSM for a dynamic col-
lection. This is done by incrementally updating the
initial language model whenever a new document ar-
rives. The underlying rationale is very simple: if a
term t present in the incoming document also occurs
in the language model, its corresponding T F and DF
values are incremented accordingly (DF only once
for each document). Otherwise, the new term is in-
troduced in the language model, and its T F
t
and DF
t
values are initialized, i.e., DF ← 1, T F ← 1.
If terms are continuously added, the dimension-
ality of the vector space keeps increasing, which is
not desirable. In order to keep dimensionality under
control, the set of relevant terms is updated by setting
appropriate Luhn Cut thresholds, according to Eqs. 9
and 10, where N
0
stands for the maximum value of
DF in the current language model. Finally, the iVSM
for a particular document is computed considering the
tf-idf count of each term t
j
currently in the language
model, as presented in Eq. 11, where t f
i j
stands for
the number of occurrences of term t
j
in document D
i
.
LC
lower
=
3, if LC
lower
< 3
llc% of N
0
, if LC
lower
> 5% of N
0
or LC
lower
< 1% of N
0
(9)
LC
upper
=
luc% of N
0
, if LC
upper
< 90% of N
0
or LC
upper
> N
0
(10)
AStudyontheRoleofSimilarityMeasuresinVisualTextAnalytics
431

iV SM
i j
=
t f
i j
∗ log
N
0
DF
j
, if DF
j
≥ LC
lower
or DF
j
≤ LC
upper
zero, otherwise
(11)
with llc and luc standing for the chosen lower
and upper cut Luhn’s thresholds, respectively. In the
studies reported in Section 6 these were set to 2%
and 95%, respectively. When applying this model to
streaming text similarity measures may be updated as
needed by the underlying layout technique. Its usage
in tandem with incremental algorithms, e.g., incBoard
and incSpace, was envisioned to require only partial
recalculation of similarity measures as the collection
changes over time, as required by those algorithms.
5 STUDY SET-UP
Our goal is to investigate how the choice of repre-
sentation model and dissimilarity function affect the
quality of layouts output by point-placement tech-
niques applied to textual collections. Assessing qual-
ity of point-placement layouts is a difficult issue, as
analysis depends on the tasks the layout is meant to
support. We believe important tasks are related with
the layout’s capability of preserving meaningful text
clusters, i.e., to which extent it favors data grouping
and group segregation; alternatively analysts may de-
sire layouts capable of preserving as much as possible
the original distances, or dissimilarity relations.
Some objective quality measures may be applied
to compare different layouts in this context. We con-
sider the Silhouette Coefficient (Tan et al., 2005), that
attempts to quantify the quality of clusters identifiable
in the feature space or in a layout derived from it, and
the Neighborhood Hit curve (Paulovich et al., 2008),
which attempts to quantify to which extent a layout
preserves known classes.
The silhouette coefficient SC of a cluster is com-
puted as the average of the silhouette coefficient com-
puted for its individual points. The silhouette of a
particular data point p
i
, belonging to a cluster C
i
is
computed according to Equation (12):
SC
p
i
=
(b
i
− a
i
)
max(a
i
, b
i
)
(12)
where a
i
is the average distance from p
i
to all the
other data points in C
i
and b
i
is the minimum aver-
age distance from p
i
to the other clusters, obtained
after computing the average distance from p
i
to all
the data points in a cluster C
j
, for all j 6= i. SC takes
values in the range [−1, 1]. Negative values indicate
that a
i
> b
i
, whereas the opposite is desirable. Notice
that SC assumes its maximum value when a
i
= 0.
The Neighborhood Hit (NH) is a curve that con-
veys the layout’s capability of preserving class struc-
ture. The NH value for an individual data point is
computed by counting number of its neighbors on the
projected layout that belong to its same label or class.
The curve is obtained by averaging the NH measure
computed for all individual data points, for a varying
number of neighbors to the point, from 1 to a maxi-
mum.
We compared layouts obtained with two rep-
resentative point-placement techniques. The Least
Square Projection (LSP) (Paulovich et al., 2008) is
a multidimensional projection technique, whereas the
Neighbor-Joining Tree (Cuadros et al., 2007) gener-
ates a hierarchy from a given dissimilarity matrix.
LSP attempts to generate a layout that preserves
neighborhood groupings in the feature space. It first
obtains a subsample of the data points, called con-
trol points, that is hopefully representative of its over-
all spatial distribution, and then computes neighbor-
hoods for this sample points. The control points are
projected first with a precise technique, and their pro-
jected coordinates, plus the neighborhoods, provide
information to build a linear system model that is
solved to obtain the projected coordinates of all data
points. LSP takes as input parameters a pairwise dis-
tance matrix computed for the collection, the number
of control points, and the number of neighbors to con-
sider in defining neighborhoods.
The Neighbor-Joining (NJ) tree is inspired on al-
gorithms for building phylogenetic trees in Biology.
It builds a tree that describes ancestrality relations be-
tween species, given a matrix of pairwise distances
between them. Then, a tree layout algorithm is em-
ployed to display the resulting hierarchy. NJ takes
as input a pairwise distance matrix of the collection
and requires no additional parameters. Whereas LSP
shows a global view that attempts to convey mean-
ingful groups of texts that have similar content, the
branches and sub-branches in the tree view allow a
user to infer levels or degrees of similarity between
the texts.
Studies were conducted on textual datasets
1 2
of
scientific papers and news articles, summarized in Ta-
ble 4.
We computed 15 distinct pairwise dissimilarity
matrices for the datasets, using the following string
distance or similarity functions
3
: Block, Jaccard,
Cosine, Euclidean, JaroWrinkler, Dice Coefficient,
1
http://infoserver.lcad.icmc.usp.br/infovis2/DataSets
2
http://www.daviddlewis.com/resources/testcollections/reuters21578
3
http://sourceforge.net/projects/simmetrics
IVAPP2013-InternationalConferenceonInformationVisualizationTheoryandApplications
432

Table 4: Text datasets.
Name Description General # #
Content docs classes
CBR-ILP-IR case based reasoning, scientific 574 3
inductive logic programming papers
and information retrieval
news2011 RSS news feeds (AP, CNN, news 1,771 23
Reuters and BBC)
ReutersNews subset from Reuters21578 news 3,988 7
collection (newswire
articles)
Levenshtein, Matching Coefficient, SmityWaterman,
Jaro, QGram, Soundex, NeedlemanWunch, Monge
and Overlap Coefficient. Their choice was based on a
survey of existing alternatives for string comparison.
After inputting the distance matrices to LSP (con-
sidering two distinct configurations for the number
of control points and neighborhood size) and to the
NJ-tree, resulting layouts were compared to identify
the functions with the best results on the CBR-ILP-IR
data, by conducting a subjective evaluation of their
visual quality and also comparing their correspond-
ing NH curves. This preliminary analysis identified
five best performing string measures for further in-
vestigation, namely Cosine Similarity, Dice’s Coeffi-
cient, Matching Coefficient, Overlapping Coefficient
and QGram.
In all cases some text-preprocessing has been ap-
plied, which varied on different test cases, due to the
nature and goals of different functions. Luhn’s cut-
ting thresholds, stopwords removal and Porter stem-
ming were employed when appropriate, as detailed in
the Results section.
In a subsequent step, we compared the previous
five string measures, plus Normalized Compression
Distance (NCDs) (Telles et al., 2007), with the con-
ventional approach for generating similarity-based
layouts from text, namely the Cosine similarity ap-
plied over a VSM vector representation. Finally, we
included in the comparison the Cosine similarity ap-
plied over the iVSM model introduced in Section 4.
Precision results are shown in Section 6, processing
times are given in Table 5.
Table 5: Processing times (in seconds) for computing dis-
similarity matrices with the distinct string dissimilarity
functions.
Measure CBR-ILP-IR News2011 ReutersNews
Cosine Distance 750 41 2,331
Dice’s coefficient 715 41 2,344
Matching’s coefficient 1,588 73 4,761
Overlap’s coefficient 758 41 2,319
Qgram Distance 16,744 1,215 52,877
NCDs 1,350 10,038 63,109
6 RESULTS
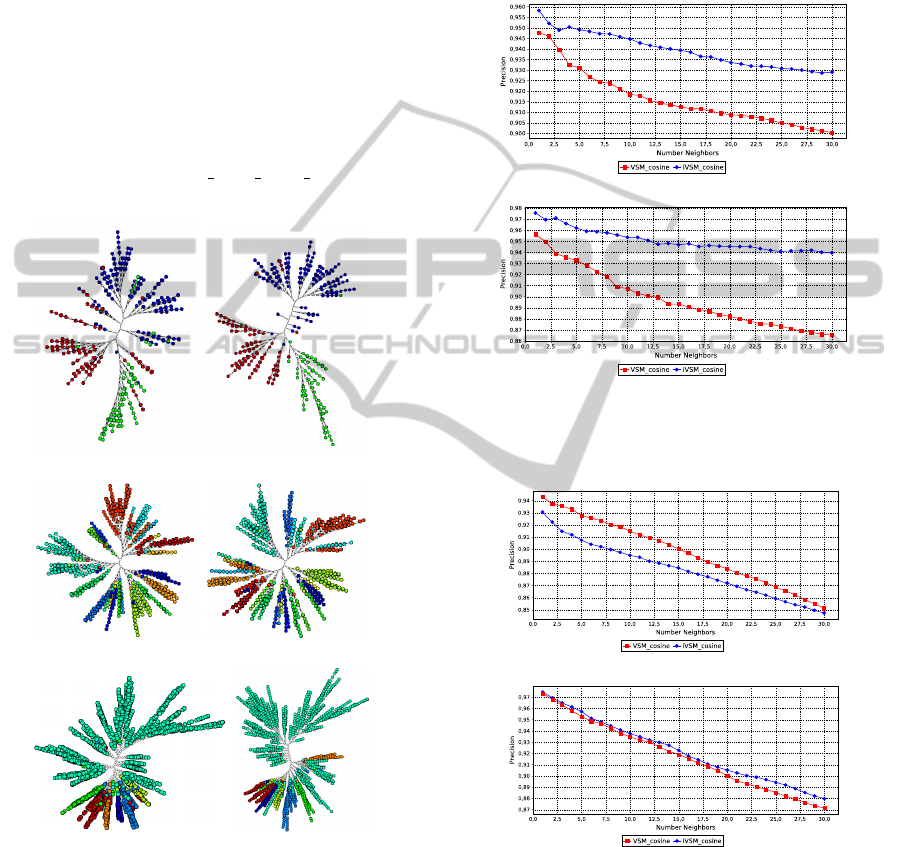
Figure 1 shows the layouts obtained with LSP and
with NJ using as input dissimilarity matrices com-
puted employing the cosine distance over the VSM
and iVSM representations, respectively, for the three
datasets considered. The LSP input parameters were
set to 57, 177 and 398 control points, respectively, for
CBR-ILP-IR, News2011 and ReutersNews, and to 15
nearest-neighbors in all cases. Figure 2 shows the cor-
responding NJ tree layouts, created with the NJ imple-
mentation by (Paiva et al., 2011), which is faster than
the original one (Cuadros et al., 2007)
4
. In the visual-
izations each circle represents a document and color
maps the document class. One may visually assess
the degree of class separation inspecting the spatial
distribution of colors in the LSP layouts, or the distri-
bution of colors in the branches and sub-branches of
the NJ-tree layouts.
(a) VSM (b) iVSM
(c) VSM (d) iVSM
(e) VSM (f) iVSM
Figure 1: LSP layouts generated for text datasets: CBR-
ILP-IR (top), News2011 (middle) and NewsReuters (bot-
tom), using the VSM and iVSM representations and the co-
sine distance. Circle color maps document class.
In order to generate the visualizations, textual data
was preprocessed with stopwords removal, Porter’s
stemming and definition of Luhn’s thresholds. We
removed the usual stopwords, such as articles and
4
http://infoserver.lcad.icmc.usp.br/infovis2/NeighborJoiningTree
AStudyontheRoleofSimilarityMeasuresinVisualTextAnalytics
433
prepositions, and also a few domain specific words
when handling scientific papers or news, e.g., for pa-
pers added stopwords included ‘press’, ‘proceedings’,
‘proc’, ‘vol’ and ‘year’. In generating the VSM mod-
els we set Luhn’s lower cut to 10, and applied no up-
per cut threshold. In generating the iVSM models,
Luhn’s thresholds were defined according to Equa-
tions 9 and 10. For the CBR-ILP-IR data the start-
ing language model was generated from an available
data set of 2,814 scientific papers (All.zip) from mul-
tiple conferences and journals on Visualization, avail-
able at the same site as the CBR-ILP-IR data set. For
News2011 and Reuters the starting language model
has been computed from an existing collection with
news from April 2006 (AP BBC CNN Reuters.zip),
again available at the same site.
(a) VSM (b) iVSM
(c) VSM (d) iVSM
(e) VSM (f) iVSM
Figure 2: NJ-tree layouts for text datasets: CBR-ILP-IR
(top), News2011(middle) and NewsReuters (bottom), using
the VSM and iVSM representations and the cosine distance.
Circle color maps document class.
Figures 3, 4 and 5 show the neighborhood preser-
vation curves of the layouts depicted in the previous
figures, for each dataset. One observes that for CBR-
ILP-IR the iVSM model does a considerably better
job as far as neighborhood preservation is concerned,
both for LSP and NJ layouts. This is not true for the
news collections: in News2011 LSP with VSM does
better, whereas both VSM and iVSM curves relative
to the NJ layouts are very similar, although iVSM
does slightly better. For NewsReuters NJ with iVSM
does better, whereas LSP with iVSM performs better
up to 7 neighbors, then VSM starts doing better.
(a) LSP
(b) NJ
Figure 3: NH graphs of LSP and NJ layouts of CBR-ILP-IR
built with the VSM and iVSM models and cosine similarity.
(a) LSP
(b) NJ
Figure 4: NH graphs of LSP and NJ layouts of News2011
built with the VSM and iVSM models and cosine similarity.
We also compared the neighborhood preservation
capability of layouts obtained using distance matri-
ces computed with distinct string similarity measures,
plus the cosine similarity computed over the VSM and
iVSM models, for the three datasets.
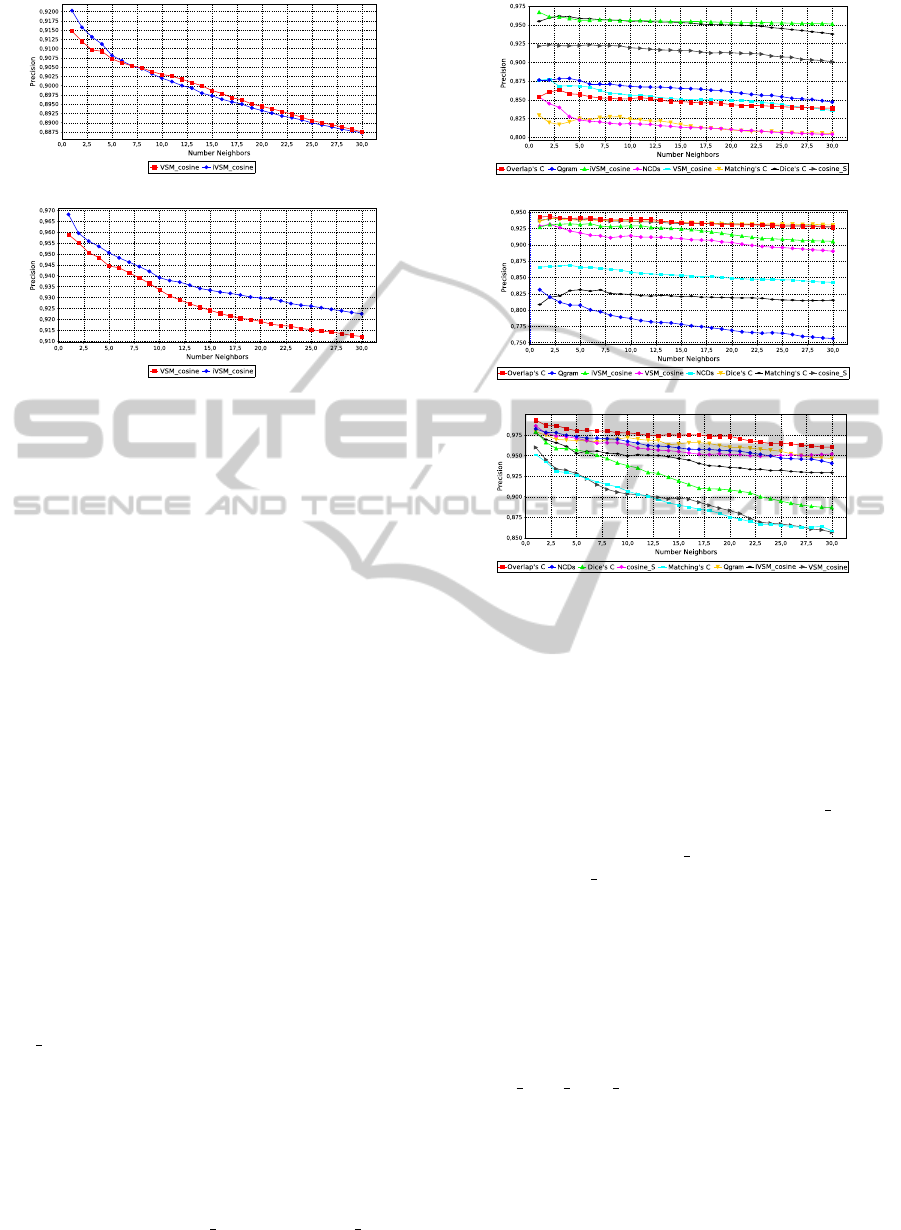
Results are shown in Figure 6 for the CBR-ILP-
IR data. We considered two configurations of LSP,
IVAPP2013-InternationalConferenceonInformationVisualizationTheoryandApplications
434
(a) LSP
(b) NJ
Figure 5: NH graphs of LSP and NJ layouts of NewReuters
built with the VSM and iVSM models and cosine similarity.
with 57 and 177 control points, both with 15 nearest-
neighbors. The text preprocessing applied varied de-
pending on the dissimilarity measure employed. In
generating the VSM and iVSM models we applied
general and domain specific stopword removal and
no stemming. For VSM a lower Luhn’s cut was set
to 10 and no upper cut was adopted; for iVSM the
thresholds were computed automatically as defined
in Equations 9 and 10, and the language model has
been computed from the same All.zip dataset. For the
string distance matrices, pre-processing procedures
also varied. General and specific stopwords were re-
moved from the input strings when using the string-
based Cosine distance, as well as Dice’s Coefficient,
Overlap Coefficient and Qgram. No stopword re-
moval was applied when using the Matching Coeffi-
cient and the NCDs measures. The choice of applying
(or not) stopwords removal has been made after veri-
fying which alternative produced the best NH curves.
In the first LSP configuration, shown in Fig-
ure 6(a), best results regarding class segregation
capability were obtained with the cosine distance
over the iVSM model (referred to in the figures as
iVSM cosine) and with string-based Dice’s Coeffi-
cient. The string-based Cosine also did well, the three
graphics show curves with values above 0.9. De-
spite their inferior performance as compared to the
previous ones, all the other distance measures pro-
duced curves with values above 0.8. The curves of
the second LSP configuration (Figure 6(b)) shows that
best results were achieved with string-based Overlap
Coefficient and with iVSM cosine and VSM cosine
– again all curves roughly remaining above the 0.9
(a) LSP (cp:57 - nn:15)
(b) LSP (cp:177 - nn:15)
(c) NJ
Figure 6: NH graphs of LSP and NJ layouts of CBR-ILP-
IR obtained with 8 distinct distance matrices: 6 string func-
tions plus the VSM and iVSM with cosine dissimilarity.
threshold. The worst results were given by string-
based Matching Coefficient and Qgram. For the NJ
layouts results are quite different: the best perform-
ing measures are string-based, namely Overlap Co-
efficient, Qgram, NCDs and Cosine. VSM cosine
and string-based Matching Coefficient displayed the
worst performances. iVSM cosine did considerably
better than VSM cosine, and although not top ranked
it comes close to the top ranked ones.
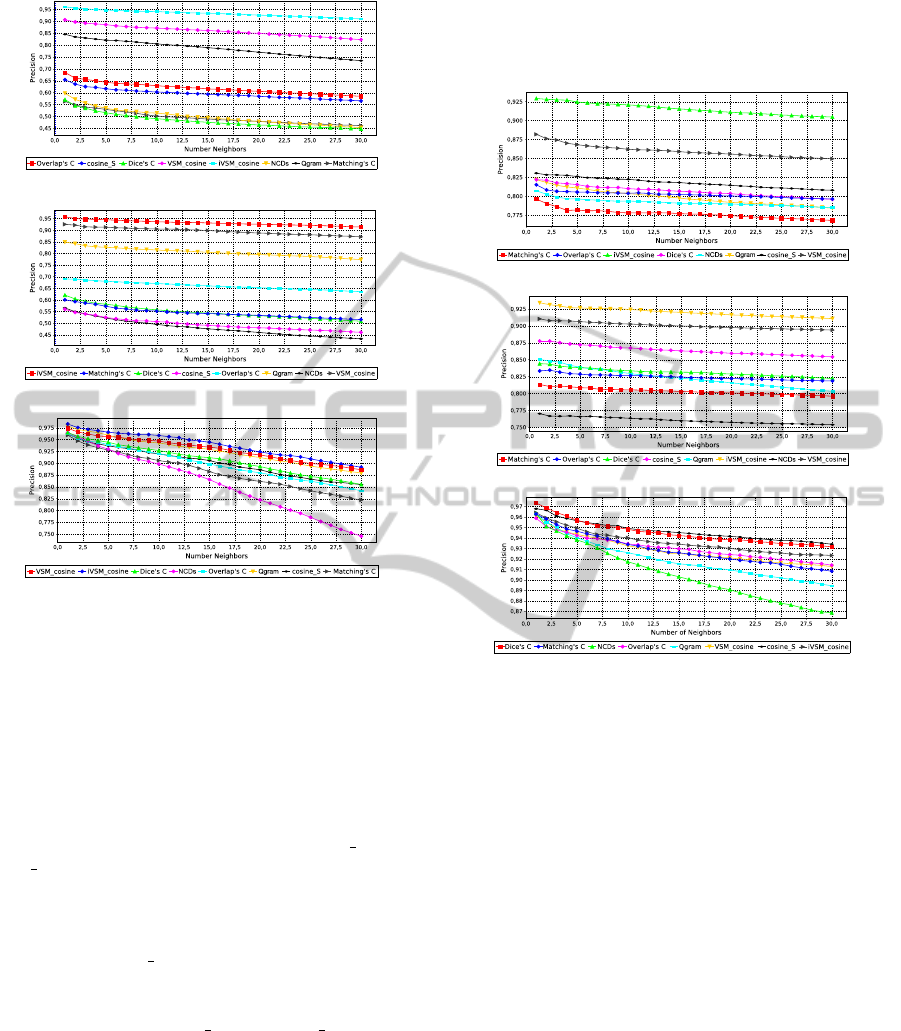
For the News2011 collection we employed LSP
with 177 control points and 15 nearest-neighbors,
and with 150 control points and 20 nearest-neighbors.
The resulting NH graphs, for the LSP (two versions)
and NJ layouts are shown in Figure 7. Preprocess-
ing steps were the same as for CBR-ILP-IR, and the
language model for iVSM has been computed from
the AP BBC CNN Reuters.zip dataset. As for the
string distances, general and specific stopwords re-
moval was employed for Dice’s Coefficient, Matching
Coefficient, Overlap Coefficient and Qgram. No stop-
word removal was applied to the string-based Cosine
and the NCDs distance.
For the first LSP configuration (Figure 7(a)) best
results were obtained with cosine distance over the
AStudyontheRoleofSimilarityMeasuresinVisualTextAnalytics
435
(a) LSP (cp:177 - nn:15)
(b) LSP (cp:150 - nn:20)
(c) NJ
Figure 7: NH graphs of LSP and NJ layouts of News2011
obtained with 8 distinct distance matrices: 6 string func-
tions plus the VSM and iVSM with cosine dissimilarity.
iVSM and VSM models and string-based Qgram,
which all show curves with values above 0.73. The
string-based Dice’s Coefficient, Matching Coefficient
and NCDs resulted in the worst performances (curves
staying bellow 0.6). In the second LSP configuration,
shown in Figure 7(b), one notices that iVSM cosine,
VSM cosine and Qgram kept the best performances.
Note that in this configuration NH curves outperform
slightly the ones in Figure 7(a). The worst results
were returned by string-based Cosine (identified in
the figures as cosine S) and NCDs. Moreover, all NH
curves produced by NJ (Figure 7(c)) achieve similar
precision values, above 0.75. Nonetheless, the best
results are again by iVSM cosine, VSM cosine and
Qgram.
For the NewsReuters collection we employed LSP
with 398 control points and 15 nearest-neighbors, and
with 200 control points and 20 nearest-neighbors.
The resulting LSP and NJ NH curves are in Figure
8. Pre-processing to generate the VSM and iVSM
models was applied as described for News2011. As
for the string distances, general and specific stopword
removal was employed for Cosine Distance, Overlap
Coefficient, Qgram and NCDs measures. No stop-
word removal was applied to the string-based Dice’s
Coefficient and Matching Coefficient distance.
(a) LSP (cp:398 - nn:15)
(b) LSP (cp:200 - nn:20)
(c) NJ
Figure 8: NH graphs of LSP and NJ layouts of NewsReuters
obtained with 8 distinct distance matrices: 6 string func-
tions plus the VSM and iVSM with cosine dissimilarity.
Figures 8(a) and 8(b) show the results for the two
LSP configurations. In both cases the iVSM produced
the highest precision values, followed by the VSM
and string-based Cosine, as the NH curves of the latter
two are the best in the second configuration (curves
stay above 0.85). The worst results were given by
string-based Matching Coefficient in the first config-
uration (Figure 8(a)) and by NCDs in the second (Fig-
ure 8(b)). The best NH curves for the NJ layouts were
obtained with string-based Cosine, Dice’s Coefficient
and the iVSM. String-based NCDs and Qgram dis-
played the worst performances. Despite their inferior
performance, these distance measures still produced
curves with values above 0.87.
Figure 9 shows the Silhouette Coefficients (SC)
computed for the datasets considering different dis-
tance functions, in the original (blue bars) and in the
NJ-tree visual space (red bars). Distances in the NJ-
tree are computed considering path lengths. As dis-
cussed in Section 5, SC values closer to 1.0 indicate
highly cohesive and well separated clusters, accord-
IVAPP2013-InternationalConferenceonInformationVisualizationTheoryandApplications
436
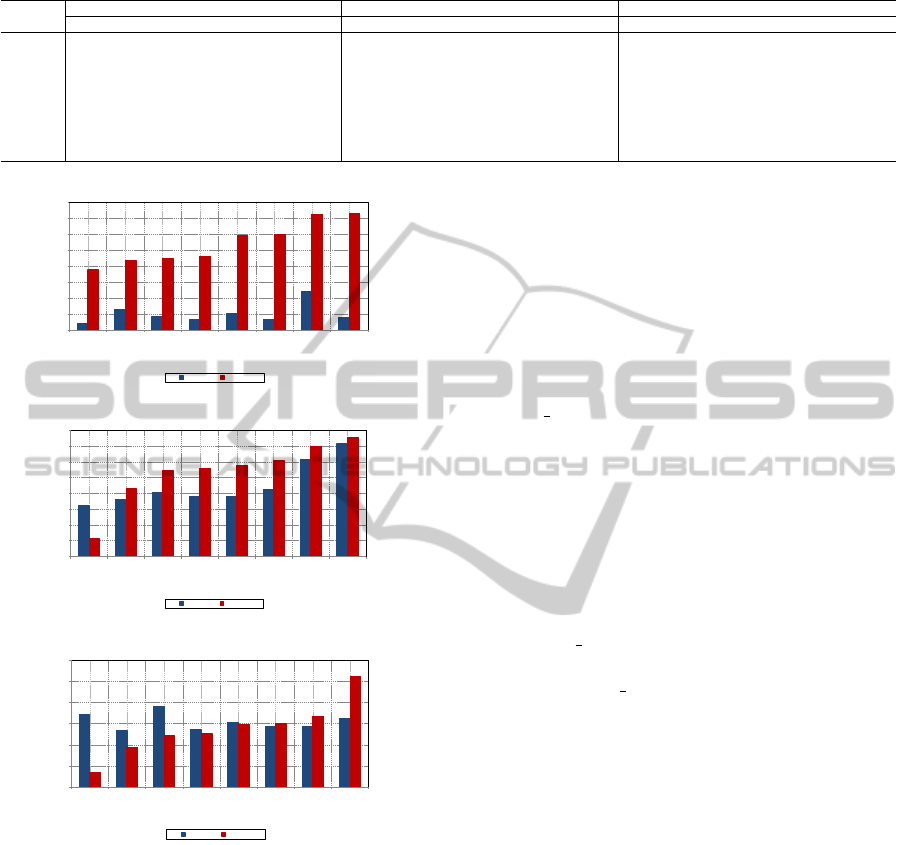
Table 6: Ranking of NH curves of layouts obtained with string-based metrics and with the cosine similarity computed over
VSM and iVSM on the three datasets.
CBR-ILP-IR News2011 NewsReuters
Ranking LSP (1) LSP (2) NJ LSP (1) LSP (2) NJ LSP (1) LSP (2) NJ
1
◦
iVSM Dice’s C Overlap’s C. iVSM iVSM iVSM iVSM iVSM Cosine
2
◦
Dice’s C Cosine Qgram VSM VSM VSM VSM VSM Dice’s C
3
◦
Cosine Overlap’s C. NCDs Qgram Qgram Qgram Cosine Cosine iVSM
4
◦
Qgram iVSM Cosine Overlap’s C. Overlap’s C. Dice’s C Dice’s C Dice’s C Overlap’s C
5
◦
VSM VSM iVSM Cosine Matching’s C Cosine Overlap’s C. Overlap’s C. VSM
6
◦
Overlap’s C. NCDs Dice’s C NCDs Dice’s C Overlap’s C. Qgram Qgram Matching’s C
7
◦
Matching’s C Matching’s C VSM Matching’s C Cosine Matching’s C NCDs Matching’s C Qgram
8
◦
NCDs Qgram Matching’s C Dice’s C NCDs NCDs Matching’s C NCDs NCDs
0,00
0,05
0,10
0,15
0,20
0,25
0,30
0,35
0,40
NCDs
VSM_cosine
Matching's C
Dice's C
Qgram
cosine_S
iVSM_cosine
Overlap's C
Original
Projected
(a) CBR-ILP-IR
-0,10
-0,05
0,00
0,05
0,10
0,15
0,20
0,25
0,30
NCDs
Matching's C
Overlap's C
cosine_S
Dice's C
Qgram
VSM_cosine
iVSM_cosine
Original
Projected
(b) News2011
-0,05
0,00
0,05
0,10
0,15
0,20
0,25
Matching's C
Qgram
iVSM_cosine
NCDs
VSM_cosine
cosine_S
Dice's C
Overlap's C
Original
Projected
(c) NewsReuters
Figure 9: Silhouette Coefficients of datasets, in the origi-
nal feature space and in the NJ-tree visual space (different
distance functions).
ing to the distance function considered. One observes
how the choice of the distance function affects the
grouping of elements based on similarity, in both the
original and the visual data spaces.
Ideally, a similarity-based layout should not de-
grade cluster quality, or even better it could actu-
ally improve it, favoring user perception of possibly
meaningful structures. Indeed, the figures show that
the NJ layout does improve cluster quality relative to
the feature space in some cases, in terms of cohesive-
ness and separation, as measured by the SC. Inspect-
ing the bar charts one notices that cluster quality in the
feature space may be poor, and some distance func-
tions are more effective than others in identifying bet-
ter quality clusters.
For the CBR-ILP-IR data, we notice that all dis-
tance functions actually contributed to a projected
layout with improved cluster quality. In fact, all
distances produced very low SC values in the fea-
ture space, always inferior to 0.1 with the exception
of iVSM cosine. SC value in the projected space
is better for all functions, with the Overlap Coeffi-
cient distance doing the best job in this matter. In
the News2011 data, again SC values in the feature
space are low and improve in the projected layouts,
with the exception of layout obtained with the NCDs.
The picture is quite different in the NewReuters data,
however: most distances produce worse SC values in
the projected space, with the exception of the string-
based Cosine, Dice’s Coefficient and Overlap Coef-
ficient. VSM cosine and NCDs roughly preserve the
cluster quality as in the original space. Unlike the
other cases iVSM cosine performed poorly in this
data.
It is worth noting that we did not consider the
Silhouette Coefficient on the LSP projection because
distance computation in 2D space tends to favor
round-shaped clusters, and as such it is not necessarily
a meaningful measure of cluster quality in the visual
space when cluster shapes vary largely.
7 CONCLUSIONS
In our experiments we observed that VSM and iVSM
generated visualizations with the best class segrega-
tion capability. Similarity-based layouts of text col-
lections obtained using both models were compared
using Neighborhood Hit curves, for which values
close to 1.0 reflect layouts with good class preser-
vation capability. A global ranking summarizing the
major findis is presented in Table 6. The iVSM out-
performed, or otherwise stayed close, to the VSM in
most cases. Given the observed results, we propose
iVSM as a new incremental model based on VSM.
AStudyontheRoleofSimilarityMeasuresinVisualTextAnalytics
437

Coupled with incremental MDS techniques, e.g., in-
cBoard and incSpace, it is well-suited for handling
text streams and time-stamped document collections,
with limited recalculations.
Some string-based metrics also performed well in
the comparisons, in particular Qgram, string based
Cosine and Overlapping Coefficient. Their major ad-
vantage is not requiring intermediate text representa-
tions such as the vector models, althoug distance cal-
culations are computationally expensive. A next step
is to evaluate iVSM and string measures in a truly in-
cremental setup, by applying them in displaying text
streams with, e.g., incBoard or incSpace.
The approaches considered disregard any kind of
semantic analysis of text. For instance, stemming in
preprocessing impacts semantics in a not very pre-
dictable manner. Although this type of processing
and dissimilarity calculation suffices for many appli-
cations, further investigation should be conducted on
semantic-based distances, as semantics cannot be ig-
nored in some text analytics applications. The impact
of the language model also needs further study.
ACKNOWLEDGEMENTS
The authors acknowledge the support of FAPESP and
CNPq. Ideas and opinions expressed are those of the
authors and do not necessarily reflect those of their
employers or host organizations.
REFERENCES
Alsakran, J., Chen, Y., Luo, D., Zhao, Y., Yang, J., Dou,
W., and Liu, S. (2012). Real-Time Visualization of
Streaming Text with a Force-Based Dynamic System.
IEEE Comp. Graph. and Applic., 32(1):34–45.
Blei, D. M., Ng, A. Y., and Jordan, M. I. (2003). Latent
dirichlet allocation. J. of Mach. Learn. Res., 3:993–
1022.
Cohen, W., Ravikumar, P., and Fienberg, S. (2003). A
Comparison of String Distance Metrics for Name-
Matching Tasks. In Proc. IJCAI-2003 Workshop on
Information Integration on the Web, pages 73–78.
Cuadros, A. M., Paulovich, F. V., Minghim, R., and Telles,
G. P. (2007). Point Placement by Phylogenetic Trees
and its Application to Visual Analysis of Document
Collections. In Proc. 2007 IEEE Symp. Vis. Analytics
Sci. and Techn., pages 99–106.
Huang, S., Ward, M., and Rundensteiner, E. (2005). Ex-
ploration of Dimensionality Reduction for Text Vi-
sualization. In Proc. Coord. and Mult. Views in Ex-
ploratory Vis., pages 63–74.
Kempken, S., Luther, W., and Pilz, T. (2006). Comparison
of distance measures for historical spelling variants.
In Artif. Intel. Theory and Prac., pages 295–304.
Landauer, T. K., McNamara, D. S., Dennis, S., and Kintsch,
W. (2007). Handbook of Latent Semantic Analysis.
Lawrence Erlbaum Assoc.
Lopes, A. A., Pinho, R., Paulovich, F. V., and Minghim,
R. (2007). Visual text mining using association rules.
Comp & Graph., 31(3):316–326.
Paiva, J. G. S., Florian, L., Pedrini, H., Telles, G. P., and
Minghim, R. (2011). Improved Similarity Trees and
their Application to Visual Data Classification. IEEE
Trans. on Vis. and Comp. Graph., 17(12):2459–2468.
Paulovich, F. V. and Minghim, R. (2008). HiPP: A Novel
Hierarchical Point Placement Strategy and its Appli-
cation to the Exploration of Document Collections.
IEEE Tran. Vis. and Comp. Graph., 14(6):1229–1236.
Paulovich, F. V., Nonato, L. G., Minghim, R., and Lev-
kowitz, H. (2008). Least Square Projection: A Fast
High-Precision Multidimensional Projection Tech-
nique and its Application to Document Mapping.
IEEE Trans. Vis. and Comp. Graph., 14(3):564–575.
Pinho, R., de Oliveira, M. C. F., and Lopes, A. A. (2009).
Incremental board: a grid-based space for visualizing
dynamic data sets. In Proc. .2009 ACM Symp. Appl.
Comp., pages 1757–1764.
Pinho, R., de Oliveira, M. C. F., and Lopes, A. A. (2010).
An incremental space to visualize dynamic data sets.
Multimedia Tools and Appl., 50(3):533–562.
Salton, G., Wong, A., and Yang, C. S. (1975). A Vec-
tor Space Model for Automatic Indexing. Commun.
ACM, 18(11):613–620.
Tan, P. N., Steinbach, M., and Kumar, V. (2005). Introduc-
tion to Data Mining. Addison-Wesley.
Telles, G. P., Minghim, R., and Paulovich, F. V. (2007). Nor-
malized compression distance for visual analysis of
document collections. Comp. & Graph., 31(3):327–
337.
Wei, F., Liu, S., Song, Y., Pan, S., Zhou, M. X., Qian, W.,
Shi, L., Tan, L., and Zhang, Q. (2010). TIARA: A
Visual Exploratory Text Analytic System. In Proc. .
16th ACM SIGKDD Int. Conf. on Knowl. Discovery
and Data Min., pages 153–162.
Wise, J. A., Thomas, J. J., Pennock, K., Lantrip, D., Pottier,
M., Schur, A., and Crow, V. (1995). Visualizing the
non-visual: spatial analysis and interaction with in-
formation from text documents. In Proc. .1995 IEEE
Symp. Inf. Vis., pages 51–58.
IVAPP2013-InternationalConferenceonInformationVisualizationTheoryandApplications
438
