
A New Interactive Information Visualization Framework based on the
Object-oriented Views of Querying and Visualizing Databases
Wei Shi and Yuzuru Tanaka
Meme Media Laboratory, Hokkaido University, West8. North13, Kita-ku Sapporo, Japan
Keywords:
Customized Information Visualization, Visual Representation and Interaction, Object-oriented Query.
Abstract:
In this paper, we propose a new visualization framework which can help users to create highly-customized and
interactive visualizations. This framework includes an Object-Oriented View Manipulation Model for query-
ing and manipulating data, as well as an Object-Oriented Visualization Implementation Model for creating
visualizations. The visualizations created using our framework allow users to directly manipulate them, which
indirectly modifies the tree structures of the two models. Such interactions enable users to visually define
an Object-Oriented view for querying the database, to visually create visualizations, and to modify existing
visualizations. Users can also interact with the visualization results to filter out their visual objects which do
not satisfy the user-specified conditions.
1 INTRODUCTION
Information Visualization is a widely-used technique
for representing data, using easily comprehensible vi-
sual properties(Spence, 2001)(Ware, 2004). A well-
designed visualization can reveal information rela-
tionships that are not immediately obvious from the
original data. To the same data set, we can create dif-
ferent visualizations to convey different information
aspects to viewers, because different visual properties
will lead to different images in visualization readers’
minds(Mackinlay, 1986). The design of how to rep-
resent data using graphical objects and their visual
properties is called the visualization scheme. Many
people are working on providing new visualization
schemes which may improve the user’s comprehen-
sion, reveal more information relationships, or em-
phasize the visualization creator’s intentions. Some
of these proposed visualization schemes may not be
implemented immediately. The visualization creators
can not directly use these schemes in an existing visu-
alization system except newly implementing them by
themselves.
Since the data set becomes more and more com-
plex, visualization creators frequently need to cre-
ate highly-customized visualizations by implement-
ing their own schemes. Only few visualization sys-
tems allow such custom design only through detailed
procedural schema definition. Even using these sys-
tems, the task of implementing the visual schemes de-
signed by others or even by themselves is not easy for
non-programmers. We believe that users need a uni-
fied visualization system for easily deploying a va-
riety of visualization schemes, and for easily creat-
ing the highly-customized visualizations. Now many
users are not satisfied with the static visualization be-
cause more information only can be obtained during
the process of manipulating the visualization(Spence,
2007). The interaction between users and visual-
izations is becoming more and more important. To
solve these problems, we will propose a new visu-
alization framework which supports users to create
highly-customized visualization by structure manip-
ulations.
2 RELATED RESEARCH
By using the preceding research results on informa-
tion visualization, many powerful visualization sys-
tems are developed to demonstrate the researchers’
theories and to improve users’ visualization expe-
riences. We list up six widely-used visualiza-
tion systems, and compare them from six differ-
ent view points (Table 1). In this table, ”Without-
Programming” denotes whether programming is nec-
essary for creating visualizations. “Chart Reuse” de-
notes whether a system supports to reuse an existing
chart as the component of another chart. This kind of
reuse is used to create embedded charts like the one
495
Shi W. and Tanaka Y..
A New Interactive Information Visualization Framework based on the Object-oriented Views of Querying and Visualizing Databases.
DOI: 10.5220/0004215904950504
In Proceedings of the International Conference on Computer Graphics Theory and Applications and International Conference on Information
Visualization Theory and Applications (IVAPP-2013), pages 495-504
ISBN: 978-989-8565-46-4
Copyright
c
2013 SCITEPRESS (Science and Technology Publications, Lda.)

Table 1: The evaluation and comparison of six representative systems and our system.
(1) (2) (3) (4) (5) (6)
Many Eyes(Viegas et al., 2007) , " " " , ,
Polaris(Stolte et al., 2002) , "
a
" , ,
InfoVis(Fekete, 2004) , " " " , ,
Protovis(Bostock and Heer, 2009)
a
" , , , ,
Mathemetica(Shaw and Tigg, 1993) "
a
, " " "
ggplot2(Wickham, 2009) "
a
, " " ,
":Not supported; ,:Well supported;
a
:Partly supported
(1)Without-Programming (2)Chart Reuse (3)Scheme Customization
(4)Appearance Customization (5)Interactive Chart (6)Large-Scale Database
in Section 5.2 or combining two charts together as the
one in Section 5.1. “Scheme Customization” denotes
whether it is possible to customize the visualization
scheme of a visualization. “Appearance Customiza-
tion” denotes whether it is possible to freely modify
the appearances of the coordinate system, the back-
ground and the legend of a chart. “Interactive Chart”
denotes whether a system supports the user interac-
tion. “Large-Scale Database” denotes whether a sys-
tem can visualize a large scale data set. Although this
feature is important, our research does not focus on
this. Too many visual objects in a chart will make our
system overloaded. Our framework can be extended
to support this by simplifying the graphical objects
used as visual objects to reduce the system load. But
we will not focus on this capability in this paper.
Most of these preceding researches realize the
visualization process by using the pre-defined data
model and/or pre-programmed code. Some re-
searches define new programming language or pack-
ages of visualization functions for creating visualiza-
tions. The scheme and appearance of a chart are pre-
defined in these researchers, the visualization results
can only be generated in a common style. Users are
not allowed or are restricted to apply their preference
on creating the visualizations. In some visualization
systems, they provide programming environments to
users for customizing the charts, but the programming
ability is requested. Most visualization systems treat
the visual objects and the charts as two different kinds
of objects. They always do not allow users to manip-
ulate charts freely. This means it is difficult to create
embedded chart or combine charts easily. Because of
these limitations, the final charts created by these sys-
tem always can not totally satisfy users needs.
In contrast to previous systems, our framework
allow users to create charts only through structure
manipulations. In our framework, we treat visual
objects, chart components (such as the coordinate-
system axis), or charts as general graphical objects
with several parameters. Users can customize visual-
ization schemes and the appearance of chart compo-
nents by modifying the parameters of corresponding
graphical objects. By manipulating the parameters of
charts and defining the relations between charts, our
framework can arrange charts freely to create com-
posite charts or embedded charts (Section 3.1).
User interactions are available in our framework
and most other visualization systems. The preceding
researches always try to implement some user inter-
actions to make their systems more powerful or easier
to use. They focus on proposing new user interac-
tions or improving the users interactions. But they
did not define the generic relationship among the user
interactions and both the change of database views
and the visualization results, and did not formalize
how to realize the user interactions (Yi et al., 2007).
Different from most of the previous visualization sys-
tems, our framework provides users direct manipula-
tions of the visualization results. These manipulations
are internally mapped to the operations on the logical
structures defined in our framework. Such mapping
between direct manipulations of visualization results
and the operations on our logical structures allows
users to use these direct manipulations not only to vi-
sually explore visualization results, but also to modify
the processes of the data retrieval and the visualiza-
tion definition.
3 A NEW VISUALIZATION
FRAMEWORK BASED ON THE
TREE STRUCTURES
In this section, we will introduce how to use our
framework to reate visualizations based on the object-
oriented design(Wilkinson and Wills, 2005). In our
framework, the visualization scheme of a chart is de-
termined by a kind of graphical object which is called
the visualization template. Our framework will copy
the visualization template and modify the parameters
of each copy using the data set from a database. We
refer to each template copy with it’s particular instan-
IVAPP2013-InternationalConferenceonInformationVisualizationTheoryandApplications
496
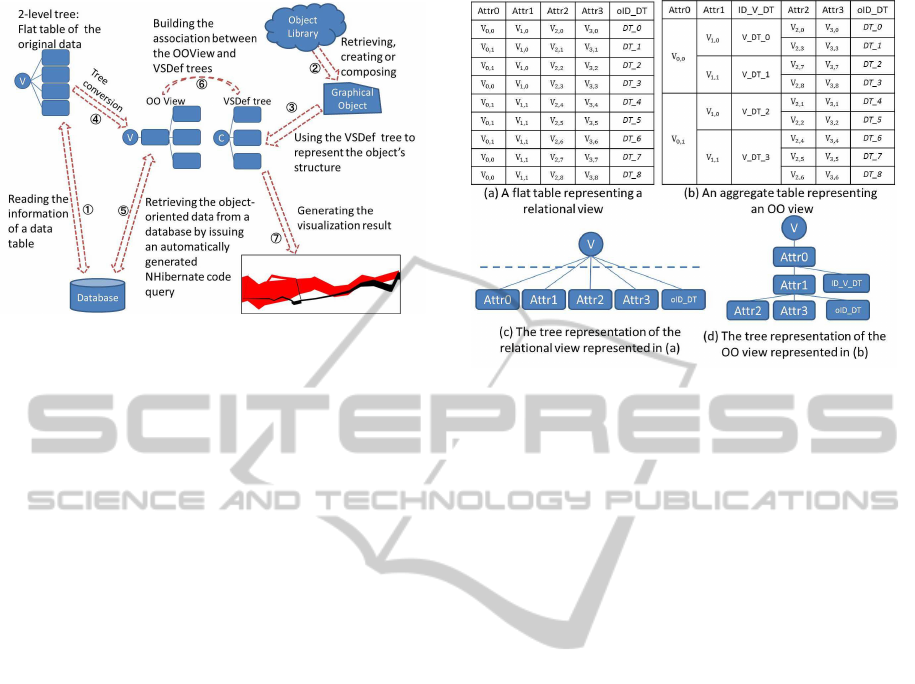
Figure 1: The visualization process of our framework.
tiation of parameter values as a visual object. The
copy of the template is called the visual object.
In our framework, we divide the visualization pro-
cess into two stages: (1) how to query and to organize
the original data set, and (2) how to visually represent
data. Corresponding to these two stages, we propose
two models. Figure 1 shows the visualization process.
Our framework uses a two-level tree to represent the
tabular structure of the data set which will be visual-
ized (Fig.1
1
). Next, users need to access the library
for retrieving the graphical objects that will be used as
the visualization template, the chart background, and
the chart legend (Fig.1
2
). Our framework provides a
tree structure called Visualization Definition (VSDef)
tree to define the chart structure and the parameters of
the each chart components (Fig.1
3
)(Section3.1.2).
According to the template subtree, users can convert
the 2-level tree in the first step to a hierarchical tree
to define an Object-Oriented View (OOView) (Fig.1
4
). This tree is named the OOView tree (Section
3.1.1). Our framework will use the defined OOView
tree to retrieve a data set from a database in the user-
defined data structure (Fig.1
5
). After users define
the bindings between the nodes of the OOView tree
and the nodes of the VSDef tree (Fig.1
6
) to spec-
ify the mapping relationships between the data set at-
tributes and the parameters of the template, the copies
of the template can be used to visually render the
data retrieved using the corresponding OOView to au-
tomatically generate the visualization result, without
any further conversionof the data structure (Fig.1
7
).
Our framework focuses on creating 2D visualizations.
In these visualizations, each visual object is an in-
stance of the visualization template, and it is limited
to use the data directly retrieved from the database
or computed from the retrieved data to instantiate its
parameters. Our framework aims to help users to cre-
ate the charts as they want. To enrich the library of
Figure 2: The relational view(a), the OOview(b), and their
tree definitions(c)(d).
the visualization template, we reuse a template com-
position method proposed in another paper (Shi and
Tanaka, 2010), which supports users to define a new
template by combining existing templates together.
3.1 Defining Visualizations by
Manipulating Two Tree Models
3.1.1 OOVM Model
Normally, the data set retrieved from a relational
database is represented as a table. Visualizing this
data set, we often need first to perform the structure
conversion. In some cases, we need to divide the set
of records into groups according to the value of one or
more arbitrarily selected attributes. Our system uses
the OOView tree to represent the data structure, and
users can manipulate the data set through this tree rep-
resentation, such as dividing the data set into groups,
or defining the derived attribute. Figure 2(a) shows
a flat-table defined as a relational view of a data set.
Figure 2(b) shows a hierarchical table defined as an
OOView of the same data set. We call a basic data
unit of a view a data object. A record is a data object
of a relational view, and a set of records having the
same value of one or more attributes is a data object of
a OOView. We use a two-level tree to represent a rela-
tional view (Figure 2(c)), and a tree with two or more
levels to represent an OOView (Figure 2(d)). Users
can define an OOView by directly manipulating the
original two-level tree-representation of a relational
view. The evaluation of an OOView provides a struc-
tured data set that is retrieved from a database and
organized in the user-defined structure. This structure
ANewInteractiveInformationVisualizationFrameworkbasedontheObject-orientedViewsofQueryingandVisualizing
Databases
497
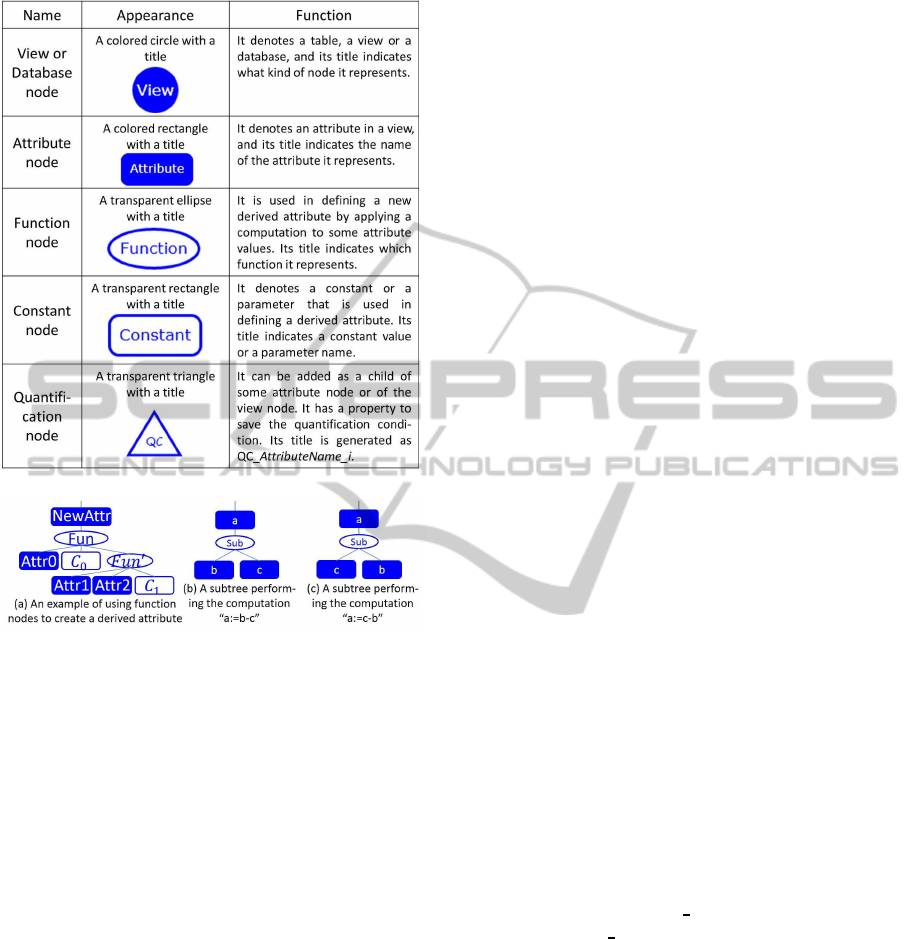
Table 2: Nodes of the OOView tree.
Figure 3: The examples for how to use the function node.
should match the data structure requested by a visual-
ization template.
Our OOVM model provides five kinds of tree
nodes for manipulating and defining trees. The five
kinds of nodes are explained in Table 2. Figure 3(a)
shows how to create a derived attribute using func-
tion nodes. Each function node has a single output
directed to its parent, and one or more inputs coming
from its children. The input of a function node may
be an attribute node or the output of another function
node. In the subtree for creating derived attributes,
the order of the child nodes of a function node deter-
mines the parameter order of the corresponding func-
tion. For example, the subtrees in Figure 3(b) and (c)
respectively denote “a:=b-c” and “a:=c-b”. Users can
manipulate the tree by the common tree operations,
such as adding a node or copying a sub-tree. We also
provide two special operations for users to define the
hierarchical relation between attributes. We use the
“group-by” operation to define the hierarchical struc-
ture of the OOView tree and to divide records into
several sets. It is different from the “group-by” state-
ment of SQL, which is always used together with an
aggregate function to obtain a single value. To con-
vert the tree in Figure 2(c) to the tree in Figure 2(d),
we can apply the “group-by” to the “Attr0” and the
“Attr1”. Its inverse operation is called ”Ungroup-by”.
We introduce an ID attribute which is used to gen-
erate an identification to each data object instance .
The ID node in the OOView tree represents the ID
attribute. The ID node is a protected attribute node.
Users can only ask the system to add an ID node to the
OOView tree to specify IDs to objects in the OOView,
but can not manipulate it further. The IDs of the ob-
jects in different OOViews are used to find the rela-
tion among these objects (Section 4). When users ini-
tially define a two-level tree to represent a data table,
the system first automatically adds an ID node as the
brother of all the attribute nodes (Figure 2 (c)). Then
the IDs will be specified to all the records (Figure 2
(a)). This automatically defined ID is called a system-
defined ID. After converting a two-level tree to a hi-
erarchical tree, users can ask the system to add a new
ID node as the brother of a selected attribute node to
specify the IDs to data object instances. Such a kind
of ID is called a user-defined ID. In Figure 2(d), the
ID node is added as the brother of Attr1. The ID of
each object instance is specified as shown in Figure
2(b).
3.1.2 OOVI Model
Every chart has four components: 1) a set of visual
objects, 2) its coordinate system, 3) its legend, and
4) its background. We can combine more than one
charts together by specifying their relative positions
to create a composite chart. We can also use a chart
as the visualization template of another one to create
a nested chart. This model allows users to use the
VSDef tree to flexibly define and customize these dif-
ferent kinds of charts. Figure 4 is a part of a VSDef
tree for defining a complex chart. Nodes used to de-
fine VSDef trees are listed in Table 3. In the VSDef
tree, we name each subtree with its root node name,
e.g., a subtree with “Chart 1” node as its root node is
named as “Chart 1” subtree.
To define a chart, we need to separately define
each component by manipulating the corresponding
subtree which starts from one of the chart component
nodes (Column 3, Row 2 in Table3). In the template
subtree and/or the background subtree, the parame-
ters of the graphical objects used as the visualization
template and/or the chart background are extracted by
the system and provided to users (Figure 4(B)). In
the coordinate-system subtree, users can customize
the coordinate-system by its property nodes (Figure
4(A)). We define two property sets for each coordi-
nate axis. They are separately used to define the ap-
IVAPP2013-InternationalConferenceonInformationVisualizationTheoryandApplications
498
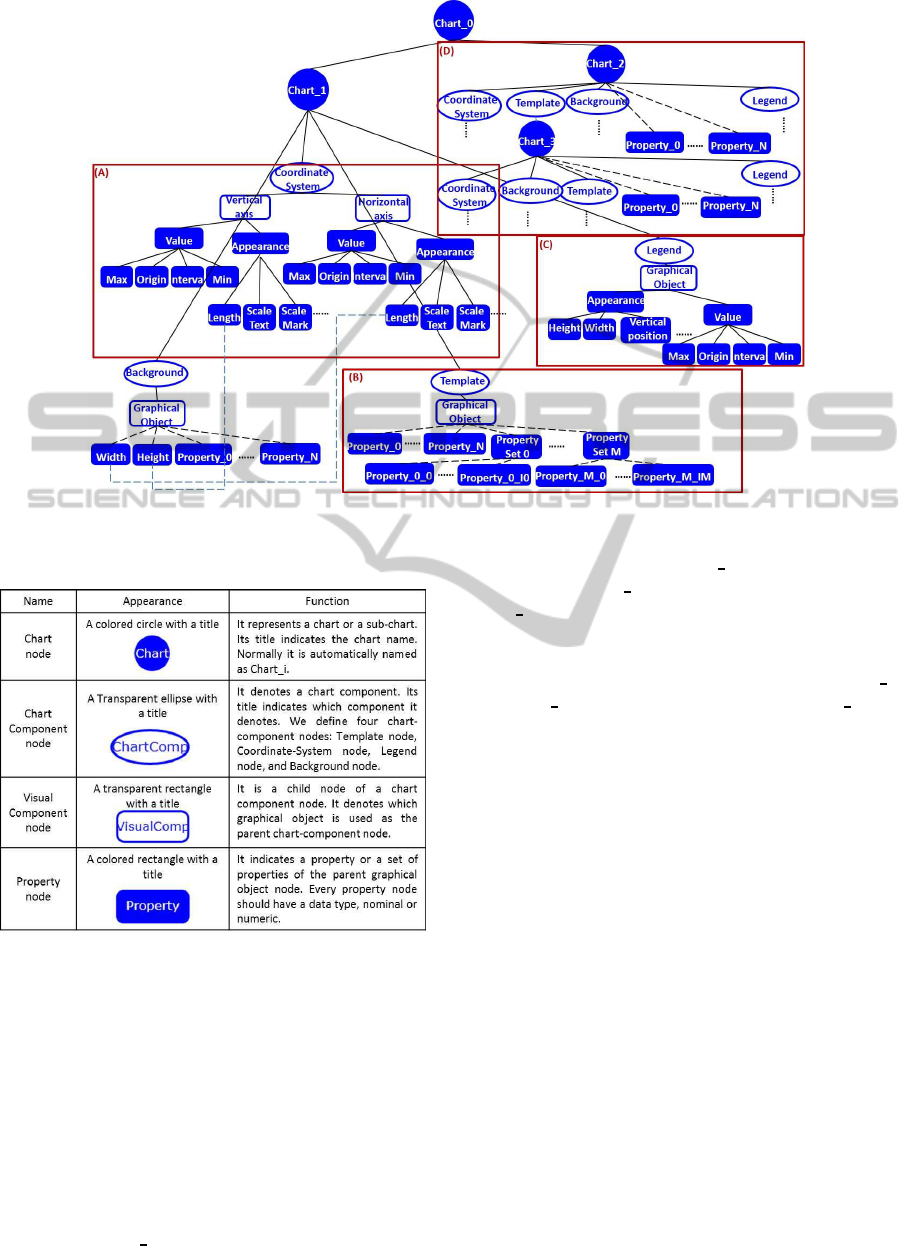
Figure 4: An example of a VSDef tree for defining a nested chart and a composite chart.
Table 3: Nodes of the OO VSDef trees.
pearance of the axis (the Appearance subtree), and
to define what information is indicated by the axis
(the Value subtree). In the legend subtree, users can
choose a graphical object to create a chart legend and
customize it. The generality of our frameworkimplies
that we can also treat every chart legend as a small vi-
sualization. As in the case of defining the coordinate-
system, we need to define both an appearance prop-
erty set and a value property set.
Users can easily define nested charts and/or com-
posite charts by manipulating the chart subtrees. Fig-
ure 4(D) shows the chart subtree of a nested chart.
We add the Chart 3 subtree as a child of the template
node whose parent is the Chart 2 node. The modified
copies of the Chart 3 will be the visual objects of the
Chart 2. Section 5.2 shows an example of defining
such a nested chart in details. For creating a compos-
ite chart, users need to add one or more chart subtrees
to another Chart node. In Figure 4, we use Chart 1
and Chart 2 to create a composite chart Chart 0. To
arrange these sub-charts, users need to specify the rel-
ative position and the size of each sub-chart by speci-
fying the values of the corresponding property nodes.
3.1.3 Defining the Binding between Tree Nodes
Users can define the binding (1) between some node
of the OOView tree and the corresponding property
node of the VSDef tree, or (2) between some two
nodes of the coordinate subtree, the legend subtree or
the background subtree of the VSDef tree. The for-
mer case of the binding definition is used to establish
the mapping from some attributes of the data set to
some properties of the visual objects. To build such
kind of bindings, users need to wire the nodes in the
OOView tree to the nodes in the VSDef tree using
dashed lines. After the user defines the bindings be-
tween the OOView tree and the template subtree in
the VSDef tree, the bindings from the nodes of the
OOView tree to the nodes of the corresponding leg-
end subtree, and to the nodes of the coordinate-system
subtree are automatically established. These bindings
between some attributes and either the legends or the
ANewInteractiveInformationVisualizationFrameworkbasedontheObject-orientedViewsofQueryingandVisualizing
Databases
499

axes of the coordinate-system of the visualization re-
sult can be manually added, edited or deleted. The
latter case of the binding definition is used to spec-
ify the value-equality between two chart component
properties. This value-equality means that, when the
property value of one chart component is changed,
the value of the corresponding property of the other
chart component will automatically change to take the
same value. Users need to wire two nodes of two dif-
ferent subtrees in the same VSDef tree to build such
a binding. In Figure 4, we define equality relation-
ships between the lengths of the two coordinate axes
and the size of the background image of the Chart 1.
The width and the height of the background image al-
ways be equal to the lengths of the two axes of the
coordinate-system.
3.2 Relating Visual Objects in Different
Visualizations of the Same Data Set
Users can create two different visualizations using
different OOViews of the same data set. The ob-
ject IDs in these OOViews can help users to find out
the correspondence between the visual objects in the
two different visualizations. In the view node of each
OOView tree, the system will generate a table named
the selection state table which uses the ID of each data
object instance to record its selection state and the hi-
erarchical structure between this data object instance
and its sub data object instances. For the OOView
in Figure 2 (d), its selection state table directly ex-
tracts two columns, ID V DT and oID DT, from the
table in Figure 2 (b). The default selection state of
each data object instance (or sub data object instance)
is ‘false’. In the chart, if a visual object is selected
(or released), the selection state of the corresponding
data object instance in the table will become ‘true’
(or ‘false’). On the other hand, if the selection state
of a data object instance becomes ‘true’ (or ‘false’),
the corresponding visual object in the chart will be
selected (or released). Suppose that the ID of a data
object instance is ”oID” and that this data object in-
stance has n sub data object instances with ”soID i”
(0 ≤ i < n) as their IDs. We define the selection prop-
agation rule as follow:
• Downward selection propagation:
if oID=True, then, for all i, soID i = True.
• Upward selection propagation:
– Any-to-One:
if there exists i such that soID i =True,
then oID=True;
– All-to-One:
if, for any i, soID i =True, then oID=True.
In the downward selection propagation, when an ob-
ject is selected. all of its subobjects will be selected.
In the upward selection propagation, there are two
modes. In the All-to-One mode, when all the sub-
objects of an object are selected, the object will be
selected. In the Any-to-One mode, if a subobject of
an object is selected, the object will be selected. If the
selection state of any system-defined ID is changed
in an OOView tree, the system will propagate this
change to all the OOView trees created from the same
two-level tree. All the selection states of the same
system-defined ID in different tables should be the
same. By updating the selection states of correspond-
ing visual objects in different visualizations, the sys-
tem will realize the brush-and-linking between these
visual objects in different visualizations.
4 DIRECT MANIPULATION OF
VISUALIZATIONS
Instead of directly manipulating the OOView tree and
the VSDef tree to define the OO query and the vi-
sualization, our framework also allows users to indi-
rectly manipulate these two trees by directly manip-
ulating the visualization results. Users can (1) de-
fine the binding between some attribute of the data
set and some visual property of the visualization tem-
plate by directly filling in an input form on a win-
dow called the binding editor which can be opened by
right-clicking one of the visual objects in the visual-
ization result, (2) define a binding between two prop-
erties of two chart components to define the value-
equality between them by filling in an input form in
the same binding editor in (1), (3) merge or divide vi-
sual objects (4) use the legend or a visualization as
a filter , or (5) embed a graphical object or a visu-
alization to another existing visualization as its new
visualization template.
For performing the operations (1) and (2), we use
the object called the binding editor. For the opera-
tion (1), the user can select a property of the visual
object, a data table, and an attribute of the selected
data table in the editor (Figure 5 (a)). Similarly, for
the operation (2) the user can select a property of the
selected chart component, another chart component
and a property of the second chart component in the
binding editor (Figure 5 (b)). According to the user
operations on the binding editor, the system will auto-
matically bind a node of the OOView tree and a node
of the VSDef tree, or bind two nodes of the VSDef
tree.
For the operation (3), users can select a visual ob-
ject or a set of visual objects and use the menu to per-
IVAPP2013-InternationalConferenceonInformationVisualizationTheoryandApplications
500
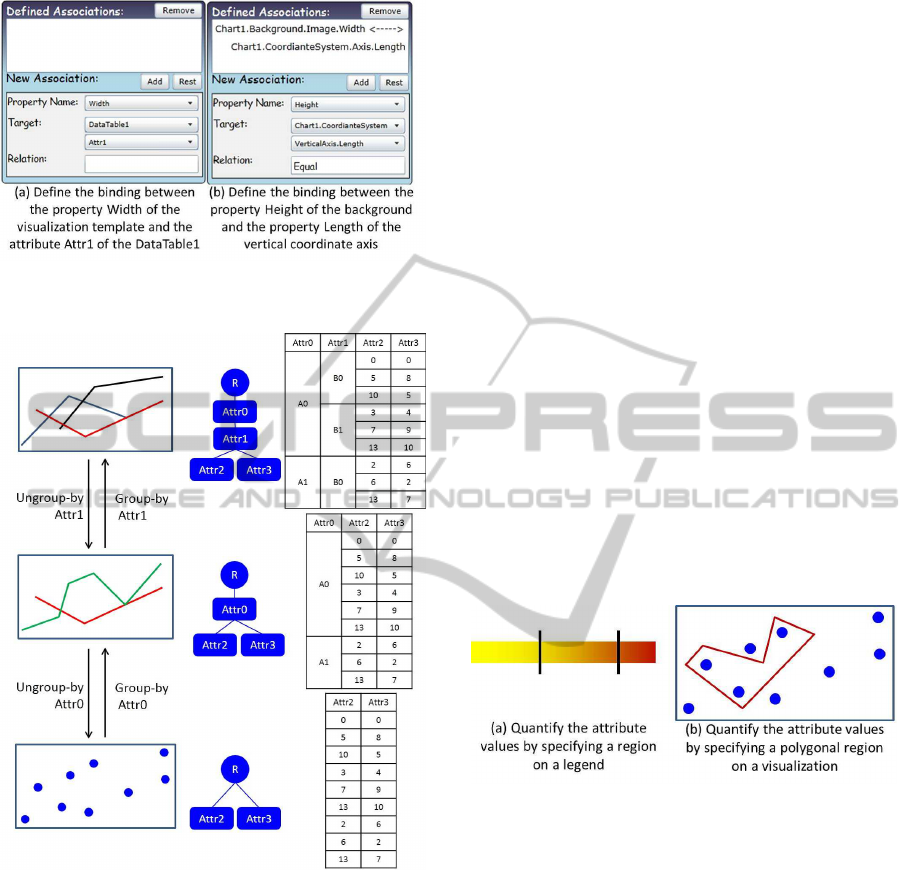
Figure 5: The binding editors for defining two kinds of
bindings.
Figure 6: Two situations for performing group-by or
ungroup-by operation on the chart.
form the merging or dividing operations. The system
will ask which attribute(s) should be used to perform
this operation. Figure 6 is an example for explaining
these two operations. In this example, the visualiza-
tion result, the OOView tree and the tabular represen-
tation of the retrieved data are shown.
Our framework allows users to quantify the values
of the attributes by specifying a region on the legend
or on the visualization (Figure 7). According to the
specified region on the legend, the system will calcu-
late the corresponding value range of the attribute as-
sociated with this legend. Then a quantification node
will be added to the OOView tree as the child of the
node representing the bounded attribute, and set the
obtained value range as the quantification condition.
Users can also specify a polygonal region on the vi-
sualization to select all the visual objects in this re-
gion. The system can filter out the visual objects that
are not selected in the visualization. The system will
add the quantification nodes to the OOView tree as
the child of its view node, and set the object IDs of
the selected visual objects as the quantification con-
dition. If users set the visualization VS1 as the filter
of the visualization VS2, and select the visual objects
in VS1, the system will find out the corresponding vi-
sual objects in VS2 using the mechanism introduced
in Section 3.2, and filter out the other visual objects.
For realizing the operation (5), users first need to load
a graphical object ”gObject” from the library or load
an existing chart ”newChart”. Then users can drag
it on an exiting visualization ”existChart” and drop it
there. Then the embedded object will become a new
visualization template of the ”existChart”. Our fram-
work will insert a copy of the corresponding sub-tree
whose root node represents ”gObject” or ”newChart”
into the VSDef tree of the ”existChart” as the child
of the template node. Section 5.2 shows an example
of creating a nested chart by adding a pie chart as the
new template to a line chart.
Figure 7: Quantify the attribute value or visual objects by
specifying a region on a legend or on a chart.
5 EXAMPLES
5.1 The Chart of Napoleon’s Russian
Campaign
In this section, we will show how to recreate Minard’s
famous 1869 chart of Napoleon’s Russia campaign by
using two data tables. One has five attributes, i.e.,
longitude, latitude, group, direction and survivors. It
shows the number of the survivors in each army group
at each different key location in one of the two di-
rections during the campaign. We will create a path
chart to represent the data in this table. The other table
has two attributes, i.e., longitude and temperature. It
shows the temperature change during the retreat, and
ANewInteractiveInformationVisualizationFrameworkbasedontheObject-orientedViewsofQueryingandVisualizing
Databases
501
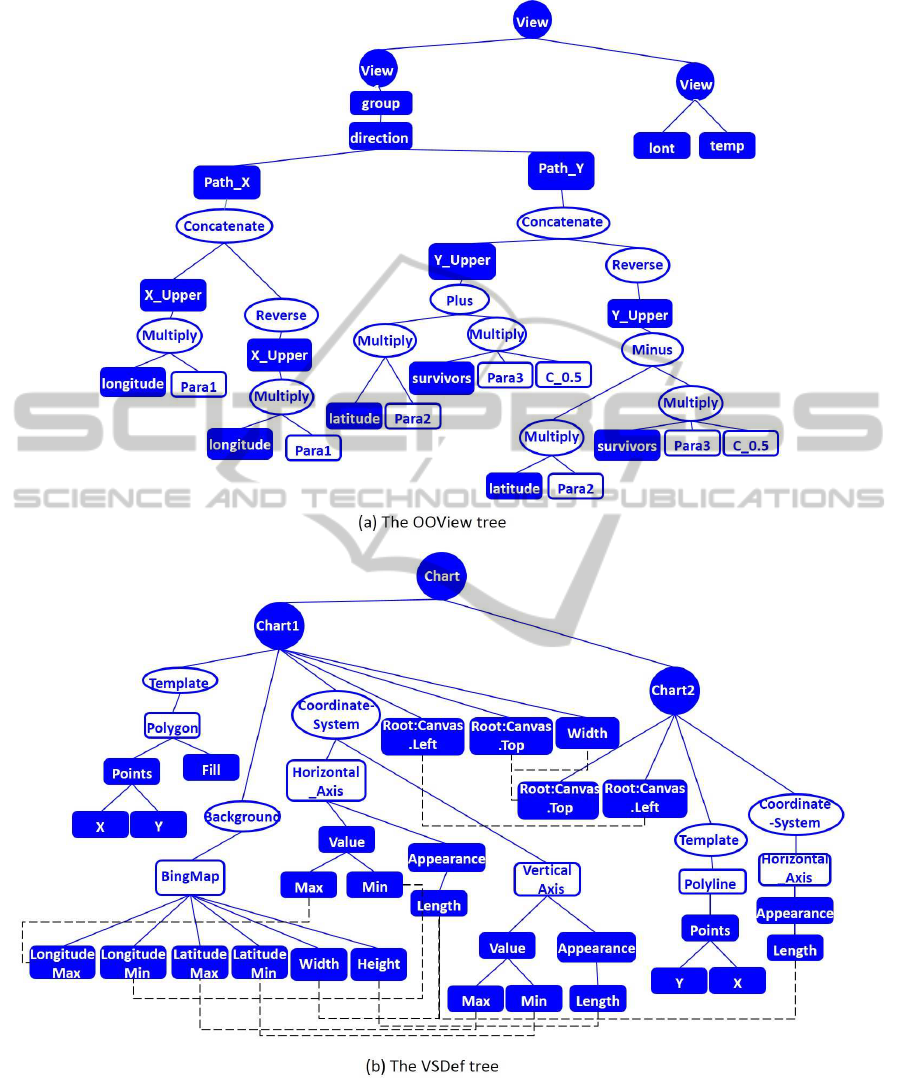
Figure 9: The OOView tree and the visualization tree for creating the chart in Fig.8.
will be represented by a line chart. Finally, we will
combine the two charts together to create a composite
chart as our desired chart (Fig.8).
For creating the path chart, we use a simple poly-
gon Webble as the template and use a Microsoft Bing
map showing the geographical region as the back-
ground. The visual objects in the path chart are used
to represent the campaign paths of Napoleon’s armies.
The vertical width of each path represents the number
of survivors of each army at each key location. For
IVAPP2013-InternationalConferenceonInformationVisualizationTheoryandApplications
502

Figure 8: The chart of Napoleon’s Russia campaign.
creating this chart, we first apply the “group-by” op-
erations to the attributes “group” and “direction”. The
records in the first data table are then divided into six
sets, because the attribute “group” has three different
values and the attribute “direction” has two different
values. Each set corresponds to one path. We use
the three attributes, “longitude”, “latitude” and “sur-
vivors”, to generate four new attributes “X Upper”,
“Y Upper”, “X Lower” and “Y Lower”. The values
of these four attributes, respectively, represent the X
and Y coordinates of the vertices in the upper and
lower edges of each polygon from left to right. We
need to arrange all the vertices of each polygon in a
clock-wise order, so we reverse the order of the ver-
tices in the lower edge by using the “reverse” func-
tion node as the parent node of the “X Lower” node
and “Y Lower” node. We then separately concate-
nate “X Upper” and “X Lower”, and “Y Upper” and
“Y Lower” to define two new attributes “Path X” and
“Path Y”. The computation among attributes will be
performed in each set. Each set in these two attributes
includes the X or Y coordinates of the vertices of each
polygon in the proper order.
Fig.9(a) shows the OOView tree for creating this
chart. Note that we define the visualization tree
(Fig.9(b)) with two subtrees for defining our desired
chart. In this tree, we specify the relative position be-
tween the path chart and the line chart of the tempera-
ture. After we build the linkages among the OOView
tree and the visualization tree (the linkages among the
nodes in the tree of Fig.9(a) and the tree of Fig.9(b)
are omitted), and the coordinate among nodes in the
visualization tree (the dashed lines in the Fig.9(b)),
the system will generate the composite chart.
In Mathematica, some users provides a func-
tion called ”NapoleonicMarchOnMoscowAndBack-
AgainPlot[]” (about 90 lines of code) to realize this
chart as well. In this function, it includes the details
of how to convert data, and how to draw the chart us-
ing the converted data. Such kind of function can be
easily used but it request the Mathematica program-
mer to write all the codes to define this function for
each new case.
5.2 An Example Chart Showing
Production Sales
In this example, we first create a line chart to visual-
ize the change in total sales of three products during
half a year. The OOView tree and the VSDef tree are
shown in Figure 10 (a) and (c). Now, in the resultant
line chart, we want to add a small pie chart at each
vertex of the polyline (Figure 10 (d)). Each pie chart
visualizes the sale proportions of the three products
in each month. To create it, we can first load a pre-
defined pie chart from a library of charts, and drag
and drop it onto the line chart. This will makes the
system automatically add the VSDef tree used to de-
fine the pie chart as the child of the template node of
the VSDef tree used to define the line chart (Part I of
Figure 10 (b)). Next, we can open the binding editor
of the pie chart and define two bindings, i.e., one be-
tween the horizontal position of the pie chart and the
attribute Month of OOView, and the other between the
vertical position of the pie chart and MonthSale (a de-
rived attribute) of the OOView. These operations will
make the system automatically copy the pie chart five
times and put them at the five vertices of the polyline
in the line chart . Next, users can use the Attribute
window and Attribute Details window to define the
two attributes, Occupancy and IntervalSum, using the
subtrees in Part II of Figure 10 (b)). We click some
sector of an arbitrary pie chart to open the binding ed-
itor to define two newbindings, one between the prop-
erty SectorAngle and the attribute Occupancy, and the
other between the property InnerRotationAngle and
the attribute IntervalSum. This will make the system
automatically generate the final visualization result as
shown in Figure 10 (d).
6 CONCLUSIONS
We have introduced a new visualization framework
which separates the visualization process into two dif-
ferent but related processes: the data querying and
manipulating process and the visualization definition
process. The Object-Oriented View Manipulation
Model and the Object-Oriented Visualization Imple-
mentation Model are proposed corresponding to these
two processes. Using the OOVM model, users can re-
trieve data from a database, guided by a user specified
structure which matches the data structure of the visu-
alization templates. The OOVI Model allows users to
visually customize the chart components. After defin-
ing the bindings between the nodes of the two trees,
the system can automatically generate the chart us-
ing the retrieved data according to the defined VS-
ANewInteractiveInformationVisualizationFrameworkbasedontheObject-orientedViewsofQueryingandVisualizing
Databases
503
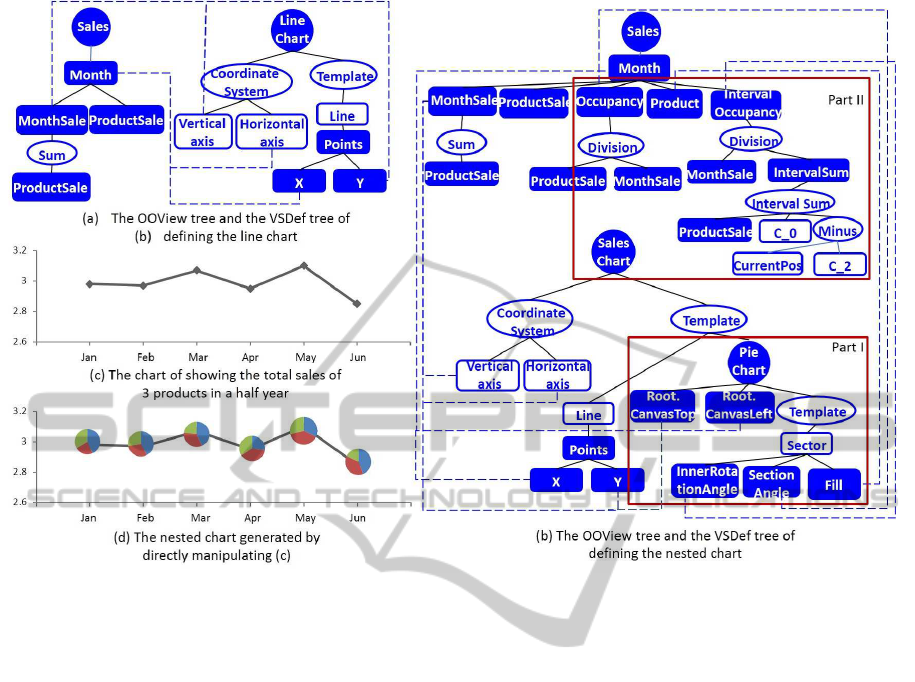
Figure 10: The Sales Chart in Section 5.2.
Def tree. Because both the OOVM model and the
OOVI model use the same type of tree structures, the
binding relations between the data side and the visual-
ization side can be defined without explicit program-
ming. Our framework allows users to directly ma-
nipulate the visualization results. These visualization
operations directly correspond to the tree operations
in the OOVM model and the OOVI model. Users
can create arbitrary visualizations supported by our
framework only through direct manipulation of exist-
ing visualizations.
REFERENCES
Bostock, M. and Heer, J. (2009). Protovis: A graphical
toolkit for visualization. IEEE Transactions on Visu-
alization and Computer Graphics, 15:1121–1128.
Fekete, J.-D. (2004). The infovis toolkit. In Proceedings
of the IEEE Symposium on Information Visualization,
pages 167–174. IEEE Computer Society.
Mackinlay, J. (1986). Automating the design of graphical
presentations of relational information. ACM Trans.
Graph., 5(2):110–141.
Shaw, W. T. and Tigg, J. (1993). Applied Mathematica:
Getting Started, Getting It Done. Addison-Wesley
Longman Publishing Co., Inc.
Shi, W. and Tanaka, Y. (2010). Object-oriented graphical-
template composition framework for information vi-
sualization. In Frontier Computing. Theory, Technolo-
gies and Applications, 2010 IET International Confer-
ence on, pages 378 –383.
Spence, R. (2001). Information visualization. ACM Press
books. Addison-Wesley.
Spence, R. (2007). Information Visualization: Design for
Interaction (2nd Edition). Prentice Hall.
Stolte, C., Tang, D., and Hanrahan, P. (2002). Polaris: A
system for query, analysis, and visualization of multi-
dimensional relational databases. IEEE Transactions
on Visualization and Computer Graphics, 8:52–65.
Viegas, A. B., Wattenberg, M., Ham, F. V., Kriss, J., and
Mckeon, M. (2007). Many eyes: A site for visualiza-
tion at internet scale. In Proceedings of Infovis.
Ware, C. (2004). Information Visualization: Perception for
Design. Morgan Kaufmann Publishers Inc.
Wickham, H. (2009). ggplot2: Elegant Graphics for Data
Analysis (Use R). Springer, 2nd printing. edition.
Wilkinson, L. and Wills, G. (2005). The grammar of graph-
ics. Springer.
Yi, J. S., Kang, Y. a., Stasko, J., and Jacko, J. (2007). To-
ward a deeper understanding of the role of interaction
in information visualization. IEEE Transactions on
Visualization and Computer Graphics, 13(6):1224–
1231.
IVAPP2013-InternationalConferenceonInformationVisualizationTheoryandApplications
504
