
QUASI: A Pipeline for the Quality Assessment and Statistical
Inference on Next Generation Sequencing Data from Pooled shRNA
Library Screens
Mark Onyango
1
, Carsten Ade
2
, Franz Cemič
1
and Jürgen Hemberger
1
1
Institute of Biochemical Engineering and Analytics, University of Applied Sciences Giessen,
Wiesenstrasse 14, Giessen, Germany
2
Theodor-Boveri Institute, University of Würzburg, Am Hubland, Würzburg, Germany
Keywords: DGE, RNA-Seq, Pipeline, Differential Expression, Quality Assessment, Tag-Seq, shRNA.
Abstract: With the development of next generation high-throughput sequencing solutions to expression profiling, the
efficient and effortless handling of such profiling data became a key challenge for bioinformaticians and
biologists alike. We therefore present a "fire and forget" style pipeline implemented in C and R, named
QUASI. It is capable of quality assessments, sequence alignments, shRNA quantification and statistically
inferring significant differential sequence abundance from datasets presented to it. Through blackboxing the
often complex and laborious steps, QUASI presents itself as a user-friendly and time-efficient solution to
handle pooled shRNA library screening data.
1 INTRODUCTION
The discovery of RNA interference (RNAi) in
Caenorhabditis elegans (Fire et al., 1998) introduced
new possibilities for the analysis of genes and the
identification of their biological functions in cellular
pathways. Introduction of double stranded RNA into
its cells led to the degradation of complementary
mRNA, thus silencing the corresponding gene. It
was later shown that these so-called loss-of-function
screens could also be applied to mammalian
organisms (Elbashir et al., 2001).
Such synthetic small interfering RNAs (siRNA)
were successfully employed, but the fast and
transient-only gene silencing in addition to the
inability to transfect otherwise hard-to-transfect cells
make them inferior to small hairpin RNAs (shRNA).
To overcome these downsides, new RNAi
approaches were developed, using viral-vector based
shRNA/shRNAmir (henceforth abbreviated shRNA)
based libraries (Fewell and Schmitt, 2006) avoiding
the shortcomings of siRNAs as a silencing agent,
mentioned by Fewell and Schmitt.
With the development of next generation
sequencing (NGS) technologies and the commercial
availability of whole genome shRNA libraries, large
scale RNAi screens, using barcode sequencing
protocols, have become more feasible. Features such
as the high dynamic range and the vast output of
DNA reads make it ideally suited for large genome-
wide screenings.
One conceivable application is the search for
new cancer therapeutics. The uncontrolled
proliferation of many tumors results from mutations
of one or several genes causing the over-expression
of oncogenes or the loss of tumor suppressors. In
addition, tumor cells often develop a dependency on
the activity of further genes and their products.
These dependencies can be exploited by suppressing
the expression of these genes via shRNA mediated
knockdown of the corresponding mRNA, inducing
synthetic lethality. Genes whose knockdown is
synthetic lethal selectively only for treated cells
(with for example an induced over-expression of an
oncogene) but not for untreated control cells may be
promising targets for tumor therapy. Comparing
untreated to treated tumor cells, significant
differences in the abundance of individual shRNAs
due to increased apoptosis or cell division may be
observed. The genes targeted by those shRNAs can
then be subjected to further validation experiments
and the positive hits may then be screened for
potential druggability.
Next generation sequencing technology is
increasingly used to enable the analysis of pooled
288
Onyango M., Ade C., Cemi
ˇ
c F. and Hemberger J..
QUASI: A Pipeline for the Quality Assessment and Statistical Inference on Next Generation Sequencing Data from Pooled shRNA Library Screens.
DOI: 10.5220/0004220702880291
In Proceedings of the International Conference on Bioinformatics Models, Methods and Algorithms (BIOINFORMATICS-2013), pages 288-291
ISBN: 978-989-8565-35-8
Copyright
c
2013 SCITEPRESS (Science and Technology Publications, Lda.)
RNAi screens in a high-throughput format. As a
consequence, new methodologies had to be
developed to analyze both RNA-Seq and shRNA
sequencing (shRNA-Seq) data.
As our contribution to the topic, we developed
QUASI, a pipeline supporting the handling of
shRNA-Seq data by performing quality assessments,
alignments and the analysis of differential shRNA
abundances in cell populations infected with the
same pooled lentiviral shRNA libraries.
2 IMPLEMENTATION
The pipeline consists of three tools, handling the
quality assessment, quantification and alignment.
Each tool can be called individually from the
command-line.
2.1 Quality Assessment
The quality assessment tool takes as input a standard
FASTQ file, and reads out the information contained
in every read block.
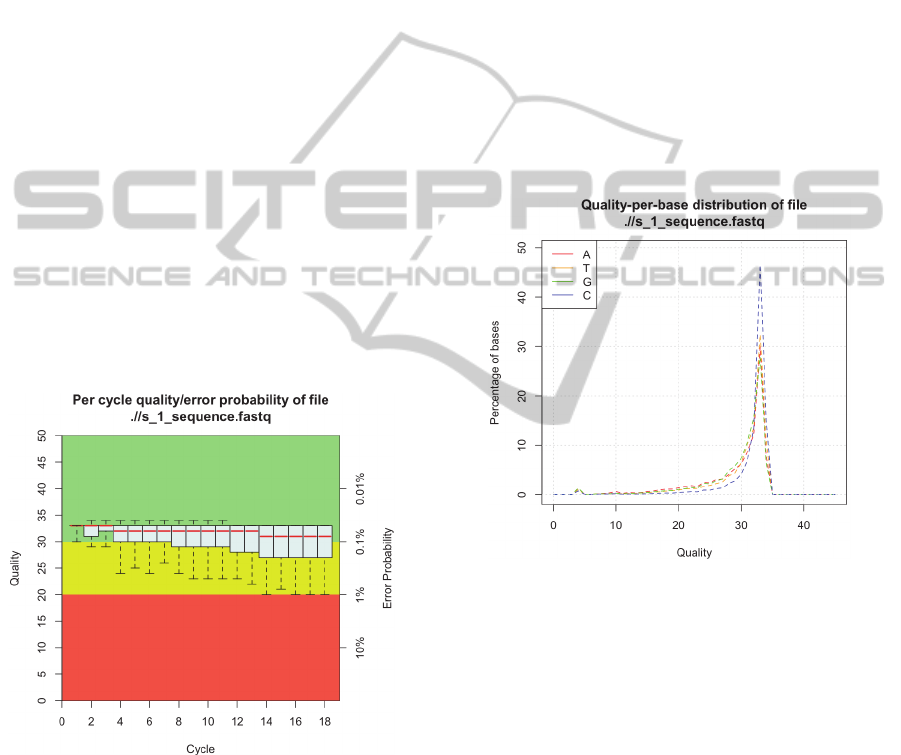
Figure 1: Box-and-Whiskers plot displaying the quality
score (Phred score) distribution per cycle.
The Phred quality scores (Ewing et al., 1998) are
processed to be visualized in a "Box-and-Whiskers
Plot" (Figure 1), providing a powerful display of the
overall quality at a single glance.
The plot presents the distributions' five-number
summary in a convenient and intelligible way. The
upper and lower whiskers represent the 90th and
10th percentile, respectively. The upper and lower
edge of the box represent the 75th and 25th
percentile whereas the median, i.e. 50th percentile, is
shown as a red line located somewhere inside the
box.
The frequently observed deterioration of the read
quality towards the 3' end is caused by an effect
called "phasing" (Kircher et al., 2009). As the
sequencing errors begin to accumulate, the
distribution of quality scores, assigned to the
incorporated nucleotides, broadens, thus making the
boxes and whiskers longer.
Another measure of quality is the quality-per-
base distribution (Figure 2). The quality scores for
each incorporated base are individually saved for
Adenine, Thymine, Cytosine and Guanine,
respectively. Presenting the plot in this manner
provides more insight, as base-specific sequencing
errors or bias can be visualized.
Figure 2: Distribution of quality scores for each base.
The tool saves all the relevant information,
discussed above, in plain text files which are then
later processed by an R script.
2.1.1 Benchmark
We tested our quality assessment tool and compared
the results and consumption of computational
resources to the freely available tools fastx (Hannon,
2012) and the well known tool FastQC (Andrews,
2010).
In Table 1 FastQC is shown to have the longest
run time but at the same time also offers the most
detailed quality report. In omitting analysis modules,
which are not relevant for shRNA-Seq (that is k-mer
analysis), we are able to focus on the relevant details
and save valuable time.
FastX seems to be slightly faster than quasi-qa,
QUASI:APipelinefortheQualityAssessmentandStatisticalInferenceonNextGenerationSequencingDatafromPooled
shRNALibraryScreens
289
but this originates from the difference in analyses
performed. FastX only saves information concerning
the nucleotidic composition and the quality
distribution per cycle, whereas quasi-qa also
analyzes the read length distribution, nucleotidic
composition, quality distribution per cycle and the
quality distribution per base.
Table 1: Performance benchmark of the quality
assessment. All calculations were performed on an Apple
MacBook Pro (late 2011) equipped with 8 GB of RAM,
2.3 GHz Intel Core i5 and a SSD harddrive. The
measurements were derived from the GNU time command
which is available on all Unix systems. It should be noted
that the tools do not possess the same range of functions.
Filesize Tool Wall time (hh:mm:ss) Total RAM
1.1 GB
fastqc 0.10 00:01:05 568 MB
fastx 0.0.13 00:00:09 21 MB
quasi-qa 00:00:10 2 MB
2.2 Alignment
The proper alignment tool must be chosen according
to the nature of the experiment. If total mRNA was
used for sequencing (i.e. RNA-Seq), TopHat,
SOAPsplice or other slice-junction-aware aligners
need to be chosen over splice-junction-unaware
aligners, as the latter are only able to align intra-
exonic reads back to the reference. Using splice-
junction-unaware aligners would result in the
incorrect dropping of all junction spanning reads as
unmappable and therefore loosing many counts.
If specific tags are sequenced, as is the case in
shRNA-Seq, splice-junction-unaware aligners such
as Bowtie (Langmead et al., 2009), BWA (Li and
Durbin, 2009) or SOAP3 (Liu et al., 2012), are more
than sufficient.
The alignment script adheres to common
standards, thus only accepting FASTQ formatted
files as input and writing alignments in the well
known SAM format
The reads of a sample-specific FASTQ file are
aligned to a predefined reference data set containing
the relevant sequences of all shRNAs used in the
RNAi screening experiment.
Multiple cores in a CPU are automatically
detected and are assumed to be available. Using
multiple cores during the alignment, drastically
reduces the total runtime on a near linear scale.
A pre-defined set of parameters has been chosen
for the alignment tools. However, the set of
parameters can be adjusted by the user if necessary.
2.3 Quantification
The tool quasi-count must be presented with one or
multiple SAM files, which will be analyzed
sequentially. This tool counts the number of
allocated reads to each reference sequence during
the alignment step. The resulting counts will be
saved in a matrix style textfile, which will later be
used for the inference of statistically significant
changes in shRNA frequencies.
The only other requirement, when using quasi-
count, is that the header section of the SAM file is
intact as the tool uses the information given therein
to identify the sequenced shRNAs.
2.4 Statistical Inference
This part of the pipeline is implemented in the
programming language R. The R script contains
functions to read in the quality assessment data and
print them out in a single PDF file, read in the count
matrix textfile to start differential abundance
analysis or visualize the Pearson correlation between
samples.
Differential abundance analysis is done by the
freely available R packages DESeq (Anders and
Huber, 2010), edgeR (Robinson et al., 2010) or
baySeq (Hardcastle and Kelly, 2010). The statistical
assumptions, made in all three packages, are based
on a negative-binomial rather than a Poisson
distribution of the counts. The assumption of a
Poisson distribution is not applicable in this case,
due to the additional sources of variance
(overdispersion), when including biological replicate
samples, that cannot be accounted for as has been
shown by Lu et al., (2005). This underestimation of
the variance leads to an increased number of type-I
errors, that is false positive discoveries of
differential abundance.
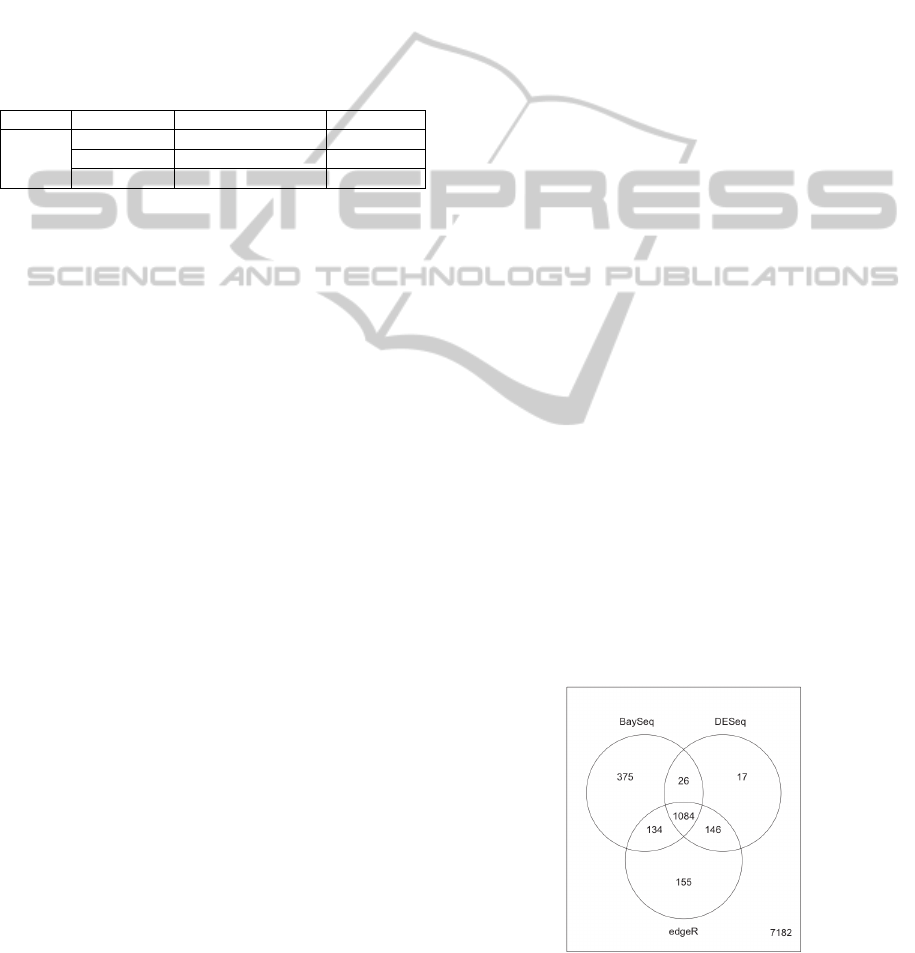
Figure 3: Example Venn diagram of significantly
differentially abundant shRNAs inferred by baySeq,
edgeR and DESeq.
BIOINFORMATICS2013-InternationalConferenceonBioinformaticsModels,MethodsandAlgorithms
290

After completing the differential abundance
analysis, the shRNAs that have shown statistically
significant changes in frequencies between analyzed
samples are saved in a plain text file for possible
further downstream analysis (e.g. GSEA, GO term
enrichment, etc.).
We recommend executing all three packages to
create a list containing only the overlap of shRNAs,
presumed to be differentially abundant (Figure 3).
This list is the most conservative estimate of
relevant shRNAs.
3 CONCLUSIONS
QUASI presents itself as a user-friendly and time-
efficient pipeline. Streamlining the analysis of
pooled shRNA library screens was achieved through
blackboxing the complex configurations, thus
decreasing the time span from raw to evaluated data.
4 AVAILABILITY
The software is freely available under the GPL
license from http://sourceforge.net/projects/quade.
Also, a detailed tutorial can be found at the URL
mentioned above, presenting the user a step-by-step
guide.
REFERENCES
Anders, S. & Huber, W., 2010. Differential expression
analysis for sequence count data. Genome biology,
11(10), p.R106.
Andrews, S., 2010. FastQC: A quality control tool for high
throughput sequence data. Available at:
http://www.bioinformatics.bbsrc.ac.uk/projects/fastqc/
Elbashir, S. M. et al., 2001. Duplexes of 21-nucleotide
RNAs mediate RNA interference in cultured
mammalian cells. Nature, 411(6836), pp.494–8.
Ewing, B. et al., 1998. Base-calling of automated
sequencer traces usingPhred. I. Accuracy assessment.
Genome research, pp.175–185.
Fewell, G. D. & Schmitt, K., 2006. Vector-based RNAi
approaches for stable, inducible and genome-wide
screens. Drug discovery today, 11(21-22), pp.975–82.
Fire, A. et al., 1998. Potent and specific genetic
interference by double-stranded RNA in
Caenorhabditis elegans. Nature, 391(6669), pp.806–
11.
Hannon, G., 2012. The FASTX-toolkit. Available at:
http://hannonlab.cshl.edu/fastx_toolkit/.
Hardcastle, T. J. & Kelly, K. A., 2010. baySeq: empirical
Bayesian methods for identifying differential
expression in sequence count data. BMC
bioinformatics, 11(1), p.422.
Kircher, M., Stenzel, U. & Kelso, J., 2009. Improved base
calling for the Illumina Genome Analyzer using
machine learning strategies. Genome biology, 10(8),
p.R83.
Langmead, B. et al., 2009. Ultrafast and memory-efficient
alignment of short DNA sequences to the human
genome. Genome biology, 10(3), p.R25.
Li, H. & Durbin, R., 2009. Fast and accurate short read
alignment with Burrows-Wheeler transform.
Bioinformatics (Oxford, England), 25(14), pp.1754–
60.
Liu, C.-M. et al., 2012. SOAP3: Ultra-fast GPU-based
parallel alignment tool for short reads. Bioinformatics
(Oxford, England), pp.24–25.
Lu, J., Tomfohr, J. K. & Kepler, T. B., 2005. Identifying
differential expression in multiple SAGE libraries: an
overdispersed log-linear model approach. BMC
bioinformatics, 6, p.165.
Robinson, M. D., McCarthy, D. J. & Smyth, G. K., 2010.
edgeR: a Bioconductor package for differential
expression analysis of digital gene expression data.
Bioinformatics (Oxford, England), 26(1), pp.139–40.
QUASI:APipelinefortheQualityAssessmentandStatisticalInferenceonNextGenerationSequencingDatafromPooled
shRNALibraryScreens
291
