
Inclusion of Data from the Domestic Domain in the Process of
Clinical Decision Making using the Example of a Comprehensive
Ambient Energy Expenditure Determination for COPD Patients
Axel Helmer, Frerk Müller, Okko Lohmann, Andreas Thiel, Marco Eichelberg and Andreas Hein
R&D Division Health, OFFIS Institute for Information Technology, Escherweg 2, D-26121 Oldenburg, Germany
Keywords: Telemedicine, Physiological Modelling, Knowledge Management, Electronic Health Records.
Abstract: Patients suffering from COPD benefit from the performance of any kind of physical activity. The 3D layer
context (3DLC) model characterizes data from different domains in relation to their relevance for the
clinical decision making process. We have used this model to show how data from an ambient activity
system in the domestic environment can be used to provide better diagnoses and prognoses for COPD
patients. As a proof of concept an experiment has been conducted to provide an individual intensity relation
between household activities and telerehabilitation training on a bicycle ergometer. We have extracted
features from the power data of the activities ironing and vacuuming to calculate the energy expenditure for
the performance of these activities.
1 INTRODUCTION
1.1 Background
Chronic Obstructive Pulmonary Disease (COPD) is
a collective term for different diseases affecting the
respiratory system. The World Health Organization
estimates that COPD affects 210 million people
worldwide (Bousquet and Khaltaev, 2007). The
illness is the third leading cause of death in the
United States, where the yearly direct / indirect costs
are estimated with 29.9 / 49.5 billion USD.
National and international clinical guidelines,
which summarize large randomized controlled trials
(RCT), show that the performance of rehabilitation
training with relative high intensity provides many
benefits for COPD patients e.g. an improved
exercise tolerance, less exacerbations and an
improvement in the quality of life (Abholz et al.,
2010), (Rodriguez-Roisin and Vestbo, 2011).
Typically, a patient will begin the rehabilitation after
he/she had an exacerbation, which often leads to a
stationary hospital stay. After the patient has been
stabilized, a number of clinical assessments such as
a physical exercise tolerance test will be performed
to determine the individual functional capacity. This
data is the basis for the medical staff to create a
training schedule, which is then used to perform a
supervised ambulatory or inpatient training in a
rehabilitation clinic.
The current versions of the relevant clinical
guidelines emphasize that the training has to be
continued at home to preserve the positive effects of
the clinical rehabilitation. Several systems were
developed to implement a supervised or
automatically controlled COPD related
telerehabilitation training at home (Busch et al.,
2009); (Lipprandt et al., 2009).
The goal of the clinical or home-based
rehabilitation training is that the patient performs a
specific amount of physical activity over time. This
amount is defined by frequency, duration, and
intensity of performed activities and can be
measured as energy expenditure. However, the
rehabilitation training with its high intensity is only
one specific activity of many that a patient will
perform in his/her everyday life. Studies show that
also activities with moderate intensity like walking
or household activities are able to preserve the
benefits that were reached during the clinical
rehabilitation (Grams et al., 2011). This data could
also be relevant for follow-up examinations. For
example, a trend that shows a reduction in the
performance of physical activity could indicate that
the health state of a patient becomes worse. This
could be a hint towards an upcoming exacerbation or
42
Helmer A., Müller F., Lohmann O., Thiel A., Eichelberg M. and Hein A..
Inclusion of Data from the Domestic Domain in the Process of Clinical Decision Making using the Example of a Comprehensive Ambient Energy
Expenditure Determination for COPD Patients.
DOI: 10.5220/0004223800420051
In Proceedings of the International Conference on Health Informatics (HEALTHINF-2013), pages 42-51
ISBN: 978-989-8565-37-2
Copyright
c
2013 SCITEPRESS (Science and Technology Publications, Lda.)
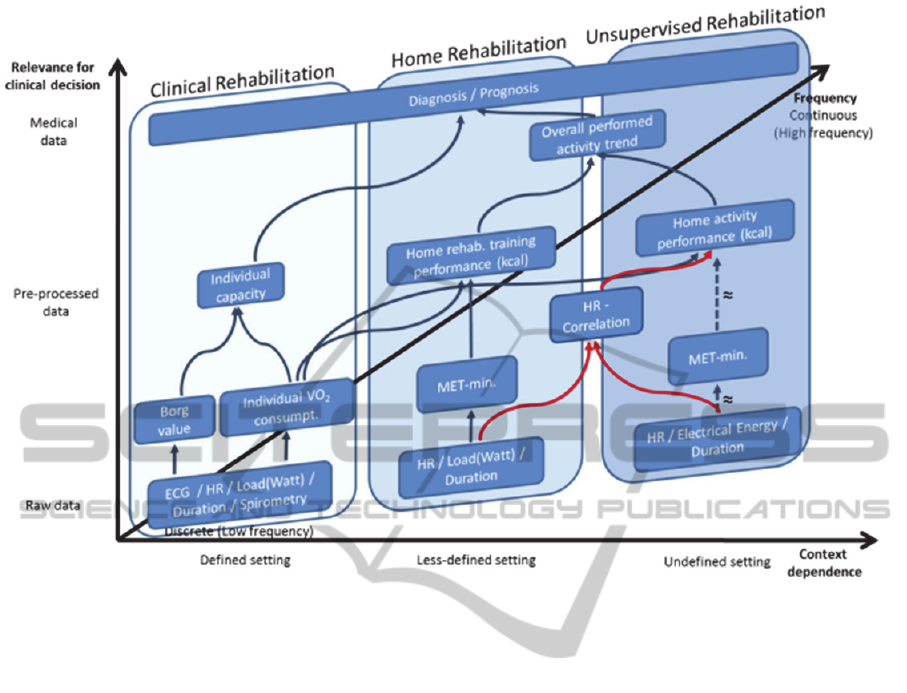
Figure 1: The three dimensional layer context (3DLC) model.
indicate the need of a medication change.
The detection of household activities for COPD
patients is a good example that shows how data from
the domestic domain can be used by clinicians to
derive more informed and potentially better
diagnoses or prognoses. One general problem that
prevents the usage of this information is the
difficulty to decide which of this collectable
information is of real relevance to the clinical
decision making process.
The currently increasing number of assistive
systems at home and approaches to connect user-
centered IT systems like Personal Health Records
(PHRs) with professional Electronic Health Records
(EHRs) reinforces the need for a structured approach
to clarify this question.
1.2 Related Work
The professional and the domestic domain have been
strictly separated in the past when it comes to data
sharing. Little research has been done concerning
the combination of data from both domains. Most of
the work concentrates on the clinical decision
making process and data quality in the professional
environment e. g. for clinical trials, but does not
regard measurements that were obtained by the
patient him/herself (Pauker and Kassirer, 1980);
(Kuperman et al., 2007),; (Williams, 2006); (Carson
et al., 1998). Electronic and Personal Health Records
are IT systems where the professional and the
domestic domains meet. Häyrinen et al. have
conducted a systematic review on the definition,
structure, content use and impact of EHRs. They
state that further studies on the EHR content are
needed; especially on patient self-documentation
(Haeyrinen et al., 2008). Tang et al. discussed the
dependence of patient generated PHR content and
clinical decision making in (Tang et al., 2006). They
recognized the problem and put it in a nutshell as
follows:
“The reliability of patient-entered data depends
on the nature of the information per se, the
patient’s general and health literacy, and the
specific motivations for recording the data.”
However, the nature of patient-entered data and the
relation to clinical decision making were not further
characterized.
The field of activity detection can be divided
into approaches based on body-worn sensors like
accelerometers or heart rate sensors and ambient
sensors like cameras or motion sensors. Activity
detection with body-worn sensors is well
InclusionofDatafromtheDomesticDomainintheProcessofClinicalDecisionMakingusingtheExampleofa
ComprehensiveAmbientEnergyExpenditureDeterminationforCOPDPatients
43
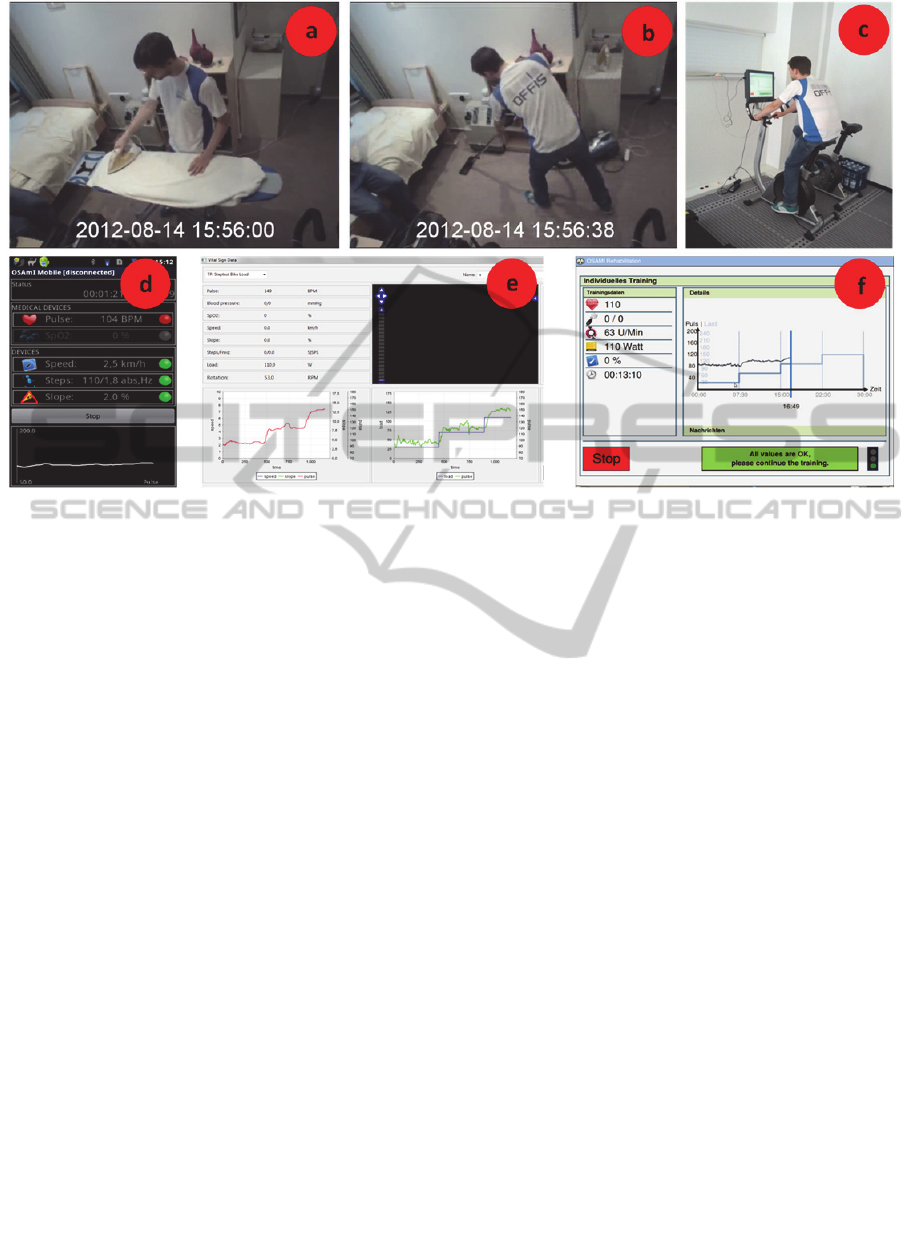
Figure 2: Training modalities: a) ironing, b) vacuuming, c) telerehabilitation ergometer training and system components: d)
mobile vital parameter recording, e) monitoring and training control, f) ergometer training view.
researched; commercial products are available, used
in many studies and showing satisfying results
(Mattila et al., 2009), (Chen et al., 2008), (Bauldoff
et al., 2007). However, obvious problems with these
sensors are that patients constantly have to wear an
electrical device, remember to put it on and to
charge the batteries (Scanaill et al., 2006). Systems
for activity detection with ambient sensors are
currently under research in the field of ambient
intelligence. They use statically installed motion
sensors (Barger et al., 2005), (Virone et al., 2002);
(Virone et al., 2008), microphones (Chen et al.,
2005), light sensors (Monekosso and Remagnino,
2007), and cameras. The main disadvantage for most
of these systems is that they can be intrusive and
depend on a lot of sensors that have to be installed in
the user’s environment. This probably leads to
acceptance problems and high installation costs.
Frenken et al. introduced a system that detects
activities of daily living (Frenken et al., 2010). They
use one single sensor that measures the power
consumption of electrical devices that are used
during these activities.
None of the mentioned ambient systems is able
to derive the intensity or the energy expenditure of
the performed activities.
1.3 Aim and Scope
The combination of clinical data with patient
obtained information from the domestic environment
is a general but well-known problem for clinicians.
The emerging use of new health-related systems in
patient’s homes adds a new technical dimension to
this problem. This complicates the decision making
process, but also holds the potential to make more
informed and better decisions.
The aim of this work is to show how new
assistive systems can be included in the practice of
medical decision making. We applied our prior
developed three dimensional layer context (3DLC)
model to the data of the COPD rehabilitation
process. The model gives a structured approach for
the combination of clinical and domestic data. As a
proof of concept we combined data from home
based telerehabilitation trainings for COPD patients
with an activity detection system based on the power
consumption of electrical devices. We used this
detection system in an experiment to develop a
comprehensive method to estimate the energy
expenditure for household activities.
2 METHODS
2.1 Three Dimensional Layer Context
Model (3DLC)
The 3DLC model was first published in (Helmer et
HEALTHINF2013-InternationalConferenceonHealthInformatics
44

Figure 3: Intensity feature extraction (cyan) from the power curve of an iron (left) and a vacuum cleaner (right).
al., 2011). It distinguishes among three continuous
dimensions (frequency, context dependence, and
relevance to clinical decision making) to
characterize data from different domains (see Figure
1). These three dimensions will be described in more
detailed in the following paragraphs.
The context dependence dimension reflects the
influence of the environment on the data acquisition.
A laboratory is used to minimize or stabilize
influences of the environment that could have a
possible impact on the acquired data. Such a very
well-understood and controlled setting is termed a
defined setting in the context dependence dimension
of the 3DLC. If a normalized clinical test / protocol
is performed outside of a laboratory then this is
termed a less-defined setting. The rest of our
everyday activity, which is possibly performed
without the intention of capturing medical data, is
termed a undefined setting in 3DLC.
Frequency reflects the occurrence in which one
test or dataset is being performed or received. A
higher (ideally: continuous) frequency is desirable in
most situations, to gain a more fine-grained picture
of the observed item. However, many tests in the
medical domain (e. g. x-ray) can only be performed
punctually (discrete).
Relevance to clinical decision making separates
the abstraction and importance of data into three
layers. The most valuable data to make decisions in
the medical domain e. g. for diagnoses is other
medical facts in form of clinical knowledge. When
this knowledge is not sufficient to make a diagnosis
the clinician has to perform further tests and is
normally interested in the results in form of a trend
or some other kind of pre-processed data. This
information is based on raw data that often
represents a physical measurement and is typically
not directly relevant for the decision making
process.
2.2 Experiment Design
The Experiment aimed to show how data from the
domestic domain can be useful for medical
decisions. Therefore, we wanted to obtain the
individual relation between the rehabilitation
training at home and two different household
activities.
As COPD patients were not available and the
experiment is a proof of concept for the applicability
of the 3DLC method, it was conducted with healthy
test persons. The participants performed two
household activities (ironing, see Figure 2a., and
vacuuming, see Figure 2b) and one step test on a
bicycle ergometer (see Figure 2c) in the home lab of
the OFFIS institute. Both household activities were
performed for five minutes with low intensity and
for five minutes with high intensity. The participants
rested for 3 minutes between the two intensities to
recover themselves. The step test on the bicycle
ergometer consisted of four steps with a length of
7:30 minutes each. The starting load was 30 watt
and increased each step by 40 watts, so that the
overall length of the training was 30 minutes with a
maximum load of 150 watt.
To perform the tests and to collect the data, three
software components were developed: The first
component runs on an Android mobile phone
(see Figure 2d) and collects the vital sign
measurements during the household activity tests.
The second component system was used to create
training plans and to monitor the training with the
bicycle ergometer (see Figure 2e). The third
component was mainly developed during
InclusionofDatafromtheDomesticDomainintheProcessofClinicalDecisionMakingusingtheExampleofa
ComprehensiveAmbientEnergyExpenditureDeterminationforCOPDPatients
45

Figure 4: Heart rate and standard deviation during the performance of household activities per test person.
OSAmI project (Lipprandt et al., 2009). It runs on
the training device for bicycle ergometer training
and controls the load of the device depending on
training plan (see Figure 2f).
All systems have an integrated user management
to allow multi-user access and are capable of using
several vital sign sensors. For this experiment the
Polar Wearlink+ was chosen. A video was recorded
during household activities to synchronize the data
from the different systems in time before analysis.
2.3 Feature Extraction
We use the individual energy consumption of the
iron and the vacuum cleaner to extract features that
can be used to determine the intensity of the
performed activity.
Figure 3 shows the power curve of the iron (left)
and the vacuum cleaner (right) during the use in the
experiment. The periods where the iron heats up can
be clearly recognized. If a test person performs
ironing with higher intensity the iron has to heat up
more of the material (e. g. a shirt) that is intended be
freed from wrinkles. This results in longer heating
periods over the time of the trial. Therefore, we
calculated the duration of the heating periods in
which the power consumption lied above a certain
threshold (cyan line in left in Figure 3).
The power consumption of the vacuum cleaner
changes, with the load of its motor, which depends
on how much air is drawn into the opening. This
amount differs during the forward and backward
movements of the suction head over the floor. So,
the flickering of the power curve of the vacuum
cleaner at the right of Figure 3 reflects these
movements, which was validated with help of the
video that was taken during the experiment. We
determine the frequency of the forward and
backward movements by counting the peaks of the
power curve (cyan circles on the right of Figure 3).
3 RESULTS
3.1 Inclusion of Data from the
Domestic Domain in the Medical
Decision Making Process
The target of physicians in our COPD example
scenario is to make a decision or prognosis (see top
of Figure 1) for a patient that is as good as it can be.
The typical process for the COPD rehabilitation with
three different stations was described in section 1.1.
These domains (clinical rehabilitation, home
rehabilitation, and unsupervised rehabilitation) are
reflected in the 3DLC model (see three blue framed
boxes in Figure 1) where they span along the three
dimensions.
Clinical rehabilitation is the most defined
setting, where a patient is strongly supervised and
external influences are avoided as much as possible
during the data acquisition. The frequency is very
low because the patient cannot perform tests in the
clinic more than once or twice a year due to the
effort that this would take from her/him and the
medical staff and also for cost reasons. The home
rehabiliation can (and should) be perfomed with a
higher frequency, but the setting is less defined than
in the clinic. The patient performs a normalized
training that is defined by a clinician and may also
be supervised. Unsupervised rehabilitation takes
place in the patient’s everyday life and reflects
her/his normal behaviour, which can be a very active
HEALTHINF2013-InternationalConferenceonHealthInformatics
46

or passive lifestyle. It is clear that these activities are
being performed with high frequency.
The contents of the dark blue box in the lower
left of Figure 1 display the raw data that is being
obtained during the physical exercise tolerance test,
when that functional capacity of the patient is
estimated. Typically this is done by a stepwise
increase of the training load e. g. on a bicycle
ergometer. Parts of the data that can be recorded
during this test are the heart rate during the test,
load of the training modality and duration of the
different test-steps. Further rather complex sensors
like electrocardiography and spirometry may be
used in the clinical setting. The spirometry data is
very important in case of COPD because it reflects
the oxygen consumption (VO
2
) under different
loads, which is different for each patient. The VO
2
value can used to precisely compute energy
expenditure during physical activities. The Borg
value (Borg, 1970) is provided by the patient and
expresses the individual perceived exertion of a
physical activity. Physicians use VO
2
and Borg to
estimate the individual capacity (lower and centre
left in Figure 1) and finally create an individual
training plan for one patient.
The partially normalized home rehabilitation
uses such a training plan to perform training in the
domestic environment by using a device (also
typically a bicycle ergometer) for telerehabilitation.
Typically such a system provides a subset of the data
that is also measured during the physical exercise
test (see bottom in centre frame in Figure 1), but
without the complicated and expensive sensors like
the ones used for the spirometry. Load and duration
are known for the specific activity of ergometer
training. This information can be used to calculate
the so called MET minutes (see bottom in centre and
middle frame in Figure 1). MET stands for
Metabolic Equivalent of Task which is a measure to
express the energy cost of physical activities. It is
based on the oxygen consumption of the muscles
and expresses the energy consumption as a factor of
the mean resting metabolic rate for a specific
activity. This data can be used over a longer time
period and a number of trainings by an appropriate
IT system like a PHR to calculate a home
rehabilitation training performance trend for a
patient.
The third domain summarizes unstructured
activity in an undefined (domestic) setting, where
unsupervised rehabilitation takes place. Currently,
the typical method to estimate activities in this
domain is a patient diary, where performed activities
are documented. We use an electrical power
consumption sensor to detect performed activities,
their duration and their intensity at home (bottom in
right frame in Figure 1). The corresponding MET
values can be looked up in a catalogue and can then
be used to estimate the energy expenditure and for
the calculation of the home activity performance of a
patient (centre in right frame in Figure 1). This
estimation of the energy expenditure for household
activities only with the activity and duration is
imprecise (dashed line right in Figure 1) because the
MET concept does not take any individual or
physical parameters into account, except of gender
and weight.
Figure 5: Relation of the household activities ironing and
vacuuming with low and high intensity to the fitted load
values of a step test on an bicycle ergometer.
The energy expenditure estimation of
rehabilitation training and household activities can
be improved by including the individual VO
2
value
of the formerly obtained exercise tolerance test. The
two trends are being combined to an overall
performed activity trend that is of high relevance for
the clinical decision making process in which a
physician estimates the health state of a patient. This
trend can be compared with the former defined
individual capacity to make better diagnoses and
prognoses, e. g. to predict exacerbations before they
occur.
The estimation of the energy expenditure for the
detected household activities can be further
improved by not only including the MET minutes
and individual VO
2
but also the intensity of the
performed activity.
In our proof of concept experiment, we calculate
two individual correlations between the recorded
heart rate (HR) and the energy expenditure during
the rehabilitation training and during the household
activities (bottom two red arrows in Figure 2). This
InclusionofDatafromtheDomesticDomainintheProcessofClinicalDecisionMakingusingtheExampleofa
ComprehensiveAmbientEnergyExpenditureDeterminationforCOPDPatients
47

enables us to relate the detected activity with their
duration and intensity to the telerehabilitation
training. Since HR reflects the impact of an activity
on the metabolism, it can be used to estimate which
specific amount of household activity substitutes one
complete rehabilitation training session. In other
words, the correlation with the rehabilitation training
over HR can be used to estimate the energy
expenditure of household activities.
3.2 Energy Expenditure Determination
12 healthy test persons aged between 27 and 39
years participated in the experiment that took place
between August and September 2012 in the home
and assessment labs of the OFFIS Institute in
Oldenburg, Germany.
Figure 4 shows the standard deviation and mean
HR of the test persons during the performance of the
household activities ironing (left) and vacuuming
(right). Except for one trial, HR was lower when the
test persons were instructed to perform an activity
with low intensity. Compared to the low intensities,
the overall HR was 9.4% higher during ironing with
high intensity (mean low int. 86.0 bpm ±11.2, mean
high int. 94.1 bpm ±11.0) and 31.2% higher during
vacuuming with high intensity (mean low int. 95.2
±8.2, mean high int. 124.9 ±18.2). HR rises during
the step test with each increment of the load in each
of the four steps (mean HR in bpm of step 1: 97.19
±7.1, step 2: 109.44 ±8.2, step 3: 126.1 ±13.4, step
4: 144.37 ±16.4).
To determine the intensity of ironing, the total
heating time of the iron was extracted as feature
from the power curve. Except for two trials, the
heating time was lower when test persons where
instructed to iron with low intensity. The iron heated
in mean 16.02% of the time during trials with low
intensity and 16.95% of the time when intensity was
high, which corresponds to a difference between low
and high of 6.53% in heating time.
To determine the intensity of vacuuming we
extracted the frequency of forward/backward
movements from the power curve. Except for one
trial, the frequency was lower during trials that
should be performed with low intensity. The
frequency during trials with low intensity was 0.40
±0.069 movements per second and for high intensity
0.65 ±0.124 movements per second, which
corresponds to a 62.5% higher frequency.
The target of the next step was to calculate the
energy (E) for household activities. Therefore, we
first calculated for each household activity
(h={ironing, vacuuming}) the linear correlation
between the detected intensity (I
h
(E)={low, high})
and the recorded heart rate (HR
h
). This results in a
simple linear model that enables us to calculate the
heart rate for an activity and intensity:
∗
(1)
The same procedure was applied to the four
intensities (l={30,70,110,150})) of the step test on
the bicycle ergometer:
∗
(2)
These formulas are then solved for l:
∗
⁄
(3)
The principle of this linkage over the HR is shown
in Figure 5, where the household activities have
been set in relation with the bicycle ergometer load
for one patient. With usage of the measured power
data we can now estimate the corresponding load
values for an activity and intensity. Ironing with low
intensity corresponds to 36.39 watt (green dashed
lines), ironing with high intensity to 86.58 watt
(magenta dashed lines), vacuuming with low
intensity to 60.36 watt (blue dashed lines) and
vacuuming with high intensity to 150.8 watt (black
dashed lines).
4 DISCUSSION
Since the 3DLC model characterizes data on a very
abstract level, it is usable when new applications or
technical improvements take place and data from
different domains have to be merged. However, the
model has to be used with concrete examples to
show its worth. Our proof of concept experiment
was conducted without real COPD patients, but is a
detailed blueprint that shows how activity data from
the domestic domain could be included in the
clinical decision making process to improve medical
diagnoses.
The experiment results show that the heart rate
correlates with the given instructions about the
intensity with which an activity should be
performed. This intensity is also reflected by the
features that were extracted from the power sensor.
It can be said that the difference in HR and feature
values is expressed stronger during vacuuming in
comparison to ironing. This can be explained with
the kinetics of the movements, which demands or
allows the use of the whole body during vacuuming,
in comparison to ironing, where only the upper body
HEALTHINF2013-InternationalConferenceonHealthInformatics
48

is used. The smaller difference during the measured
heating time of ironing reflects the smaller
difference in HR. Even if the detection is not perfect,
the data shows that the intensity (high/low) in which
a household activity has been performed can be
robustly detected by usage of an unobtrusive
ambient power sensor.
The mapping between the intensities of
household activities and the bicycle ergometer over
heart rate is to our knowledge the first attempt to
bring these different modalities together. The usage
of a simple fit with one parameter as a model for
energy expenditure is not sufficient for all practical
needs. For example, the model would predict
negative values when it extrapolates the energy
expenditure under certain circumstances. The most
important factor for a precise prediction of the
energy expenditure is the individual oxygen
consumption of a patient. To determine this value
the patient has to perform a load test with a cost
intensive breath by breath gas analysis. Hence, we
are currently working on a more complex model that
reflects the physiology of the human body in greater
detail. It takes the individual VO
2
consumption and
also environmental factors like temperature into
account and should, thereby, enable a more precise
prediction.
5 CONCLUSIONS
The use of the 3DLC model for the case study of an
enhanced energy expenditure determination for
COPD patients shows a way how data from the
domestic domain could be used to improve the
clinical decision making process. We substantiated
this abstract path with an experiment that was
conducted to create an intensity relation between the
telerehabilitation training on a bicycle ergometer and
the household activities ironing and vacuuming. We
showed that intensities of the activities can be
distinguished simply from the power consumption of
electrical devices that are used during the
performance of such an activity. We extracted
heating time for ironing and the frequency of
forward/backwards movements for vacuuming as
features from the power curves. These features
proved to be sufficient measures to distinguish
between two intensities in which the activities were
performed. Finally we used them for a correlation
with the ergometer training to estimate the energy
expenditure for household activities with an ambient
power sensor.
ACKNOWLEDGEMENTS
This work was funded in part by the German
Ministry of Education and Research within the
research project “OSAMI-D” (grant 01 IS 08003)
and in part by the Ministry for Science and Culture
of Lower Saxony within the Research Network
“Design of Environments for Ageing” (grant VWZN
2701).
REFERENCES
Abholz, H. H., Gillissen, A., Magnussen, H., Schott, G.,
Schultz, K., Ukena, D. and Worth, H., 2010. Nationale
Versorgungsleitlinie - Chronisch Obstruktive
Lungenerkrankung - COPD. In German.
http://www.copd.versorgungsleitlinien.de/.
Barger, T. S., Brown, D. E. and Alwan, M., 2005. Health-
status monitoring through analysis of behavioral
patterns, IEEE Transactions on Systems, Man and
Cybernetics, Part A: Systems and Humans 35(1), 22–
27.
Bauldoff, G. S., Ryan-Wenger, N. A. and Diaz, P. T.,
2007. Wrist actigraphy validation of exercise
movement in copd, Western Journal of Nursing
Research 29(7), 789–802. http://wjn.sagepub.com/
content/29/7/789.abstract.
Borg, G., 1970. Perceived exertion as an indicator of
somatic stress, Scandinavian journal of Rehabilitation
Medicine 2(2), 92–98.
Bousquet, J. and Khaltaev, N., 2007. Global surveillance,
prevention and control of Chronic Respiratory
Diseases - A comprehensive approach, Word Health
Organization.
Busch, C., Baumbach, C., Willemsen, D., Nee, O., Gorath,
T., Hein, A. and Scheffold, T., 2009. Supervised
training with wireless monitoring of ecg, blood
pressure and oxygen-saturation in cardiac patients.,
Journal of Telemedicine and Telecare 15(3), 112–114.
http://dx.doi.org/10.1258/jtt.2009.003002.
Carson, E., Cramp, D., Morgan, A. and Roudsari, A.,
1998. Clinical decision support, systems methodology,
and telemedicine: their role in the management of
chronic disease, Information Technology in
Biomedicine, IEEE Transactions on 2(2), 80 –88.
Chen, J., Zhang, J., Kam, A. H. and Shue, L., 2005. An
automatic acoustic bathroom monitoring system, in
‘Proc. IEEE Int. Symp. Circuits and Systems ISCAS
2005’, pp. 1750–1753.
Chen, Y.-P., Yang, J.-Y., Liou, S.-N., Lee, G.-Y. and
Wang, J.-S., 2008. Online classifier construction
algorithm for human activity detection using a tri-axial
accelerometer, Applied Mathematics and Computation
205(2), 849 – 860. Special Issue on Advanced
Intelligent Computing Theory and Methodology in
Applied Mathematics and Computation.
http://www.sciencedirect.com/science/article/pii/S009
InclusionofDatafromtheDomesticDomainintheProcessofClinicalDecisionMakingusingtheExampleofa
ComprehensiveAmbientEnergyExpenditureDeterminationforCOPDPatients
49

6300308003640.
Frenken, T., Wilken, O. and Hein, A., 2010. Technical
approaches to unobtrusive geriatric assessments in
domestic environments, in ‘Proceedings of the 5th
Workshop on Behaviour Monitoring and
Interpretation, BMI’10, Karlsruhe, Germany,
September 21, 2010’.
Grams, L., Tegtbur, U., Kueck, M., Guetzlaff, E.,
Marschollek, M. and Kerling, A., 2011.
Energieumsatzmessungen unter kontrollierten
Bedingungen - Vergleich von Accelerometer,
Multisensorsystem und mobiler Spiroergometrie,
Deutsche Zeitschrift für Sportmedizin 6, 160–165.
Haeyrinen, K., Saranto, K. and Nykaenen, P., 2008.
Definition, structure, content, use and impacts of
electronic health records: A review of the research
literature, International Journal of Medical
Informatics 77(5), 291 – 304. http://
www.sciencedirect.com/science/article/pii/S13865056
07001682.
Helmer, A., Lipprandt, M., Frenken, T., Eichelberg, M.
and Hein, A., 2011. 3DLC: A Comprehensive Model
for Personal Health Records Supporting New Types of
Medical Applications, Journal of Healthcare
Engineering 2, 321–336. ISSN 2030-2295 DOI
10.1260/2040-2295.2.3.321.
Kuperman, G. J., Bobb, A., Payne, T. H., Avery, A. J.,
Gandhi, T. K., Burns, G., Classen, D. C. and Bates,
D. W., 2007. Medication-related clinical decision
support in computerized provider order entry systems:
A review, Journal of the American Medical
Informatics Association 14(1), 29 – 40.
http://www.sciencedirect.com/science/article/pii/S106
750270600209X
Lipprandt, M., Eichelberg, M., Thronicke, W., Kruger, J.,
Druke, I., Willemsen, D., Busch, C., Fiehe, C., Zeeb,
E. and Hein, A., 2009. Osami-d: An open service
platform for healthcare monitoring applications, in
‘Proc. 2nd Conference on Human System Interactions
HSI ’09’, pp. 139–145.
Mattila, J., Ding, H., Mattila, E. and Sarela, A., 2009.
Mobile tools for home-based cardiac rehabilitation
based on heart rate and movement activity analysis,
Conf Proc IEEE Engineering in Medicine & Biology
Society 2009, 6448–6452.
Monekosso, D. N. and Remagnino, P., 2007. Monitoring
behavior with an array of sensors, Computational
Intelligence 23(4), 420–438.
http://dx.doi.org/10.1111/j.1467-8640.2007.00314.x
Pauker, S. G. and Kassirer, J. P., 1980. The threshold
approach to clinical decision making, New England
Journal of Medicine 302(20), 1109–1117.
http://www.nejm.org/doi/full/10.1056/NEJM19800515
3022003.
Rodriguez-Roisin, R. and Vestbo, J., 2011. Global strategy
for the diagnosis, management, and prevention of
chronic obstructive pulmonary disease, Report.
http://www.goldcopd.org/uploads/users/files/GOLD_
Report_2011_Feb21.pdf.
Scanaill, C. N., Carew, S., Barralon, P., Noury, N., Lyons,
D. and Lyons, G. M., 2006. A review of approaches to
mobility telemonitoring of the elderly in their living
environment., Annals of Biomedical Engineering
34(4), 547–563. http://dx.doi.org/10.1007/s10439-005-
9068-2.
Tang, P. C., Ash, J. S., Bates, D. W., Overhage, J. M. and
HEALTHINF2013-InternationalConferenceonHealthInformatics
50

Sands, D. Z., 2006. Personal health records:
definitions, benefits, and strategies for overcoming
barriers to adoption., Journal of the American Medical
Informatics Association : JAMIA 13(2), 121–126.
http://dx.doi.org/10.1197/jamia.M2025.
Virone, G., Alwan, M., Dalal, S., Kell, S. W., Turner, B.,
Stankovic, J. A. and Felder, R., 2008. Behavioral
patterns of older adults in assisted living, Transactions
on Information Technology in Biomedicine
12(3), 387–398.
Virone, G., Noury, N. and Demongeot, J., 2002. A system
for automatic measurement of circadian activity
deviations in telemedicine, Transactions on
Biomedical Engineering 49(12), 1463–1469.
Williams, G. W., 2006. The other side of clinical trial
monitoring; assuring data quality and procedural
adherence., Journal of the Society for Clinical Trials
3(6), 530–537. http://dx.doi.org/10.1177/174077450
6073104.
InclusionofDatafromtheDomesticDomainintheProcessofClinicalDecisionMakingusingtheExampleofa
ComprehensiveAmbientEnergyExpenditureDeterminationforCOPDPatients
51
