
Template Matching for Detection of Starry Milia-Like Cysts in
Dermoscopic Images
Viswanaath Subramanian
1
, Randy H. Moss
1
, Ryan K. Rader
2
,
Sneha K. Mahajan
1
and William V. Stoecker
1,2
1
Department of Electrical and Computer Engineering, Missouri University of Science & Technology,
141 Emerson Electric Co. Hall, Rolla, MO, U.S.A.
2
Stoecker & Associates, 10101 Stoltz Drive, Rolla, MO, U.S.A.
Keywords: Pattern Analysis, Image Processing, Object Detection, Template Matching, Seborrheic Keratosis, Milia-
Like Cysts.
Abstract: Early detection of melanoma by magnified visible-light imaging (dermoscopy) is hindered by lesions which
mimic melanoma. Automatic discrimination of melanoma from mimics could allow detection of melanoma
at an earlier stage. Seborrheic keratoses are common mimics; these have distinctive bright structures: starry
milia-like cysts (MLCs). We report discrimination of MLCs from mimics by features extracted from starry
MLC (star) candidates. After pre-processing, 2D template matching is optimized with respect to star
template size, histogram pre-processing, and 2D statistics. The novel aspects of this research were new
details for region of interest (ROI) analysis of the centers of the star candidate, a new method for
determining shape of hazy objects and multiple template matching, using unprocessed ROIs, shape-limited
ROIs, and histogram-equalized ROIs. Features retained in the final model for the decision MLC vs. mimic
by logistic regression include star size, 2D first correlation coefficient, correlation coefficient to the star
shape template, equalized correlation coefficient, relative star brightness, and statistical features at the star
center. These methods allow optimization of MLC features found by 2D template correlation. This research
confirms the importance of fine ROI features and ROI neighborhoods in medical imaging.
1 INTRODUCTION
Milia-Like Cysts (MLCs) are small white-to-ivory
dermoscopic structures that are commonly seen in
seborrheic keratoses (SKs). Their presence in benign
lesions makes MLCs an attractive target to
distinguish melanomas from benign lesions (Braun
et al., 2002); (Menzies et al., 2008); (Stricklin et al.,
2011). MLCs are classified as either starry or cloudy
(Figure 1). Starry MLCs are < 1/3 mm in diameter,
round and often appear like “stars on a misty night”
(Stricklin et al., 2011). Stricklin et al. found that
starry MLCs had 90.5% sensitivity and 45.7%
specificity for seborrheic keratosis (Stricklin et al.,
2011).
Analysis for automatic detection of these
structures has not been reported. The most critical
factor to aid detection is the brightness of these
structures (Figure 1), followed in importance by size
and shape.
2 IMAGES, PREPROCESSING
2.1 Data Sets and Images used
Sixty-six seborrheic keratoses and 34 melanomas
acquired in the course of the study NIH CA153927-
02A2 had MLC or MLC-mimicking structures.
Contact, non-polarized dermoscopy images (3Gen,
Dana Point CA) with 1024x768 resolution were
used.
2.2 Lesion Processing, Noise Removal
As starry MLCs are white or yellow, the blue plane
is chosen for maximum contrast (Lee, 2001). The
lesion border contours and hair masks were
manually drawn as in Stoecker et al. (2005).
Bubbles were automatically detected by high
intensity and sharp gradient; hairs were removed
manually.
444
Subramanian V., H. Moss R., K. Rader R., K. Mahajan S. and V. Stoecker W..
Template Matching for Detection of Starry Milia-Like Cysts in Dermoscopic Images.
DOI: 10.5220/0004227504440448
In Proceedings of the International Conference on Computer Vision Theory and Applications (VISAPP-2013), pages 444-448
ISBN: 978-989-8565-47-1
Copyright
c
2013 SCITEPRESS (Science and Technology Publications, Lda.)
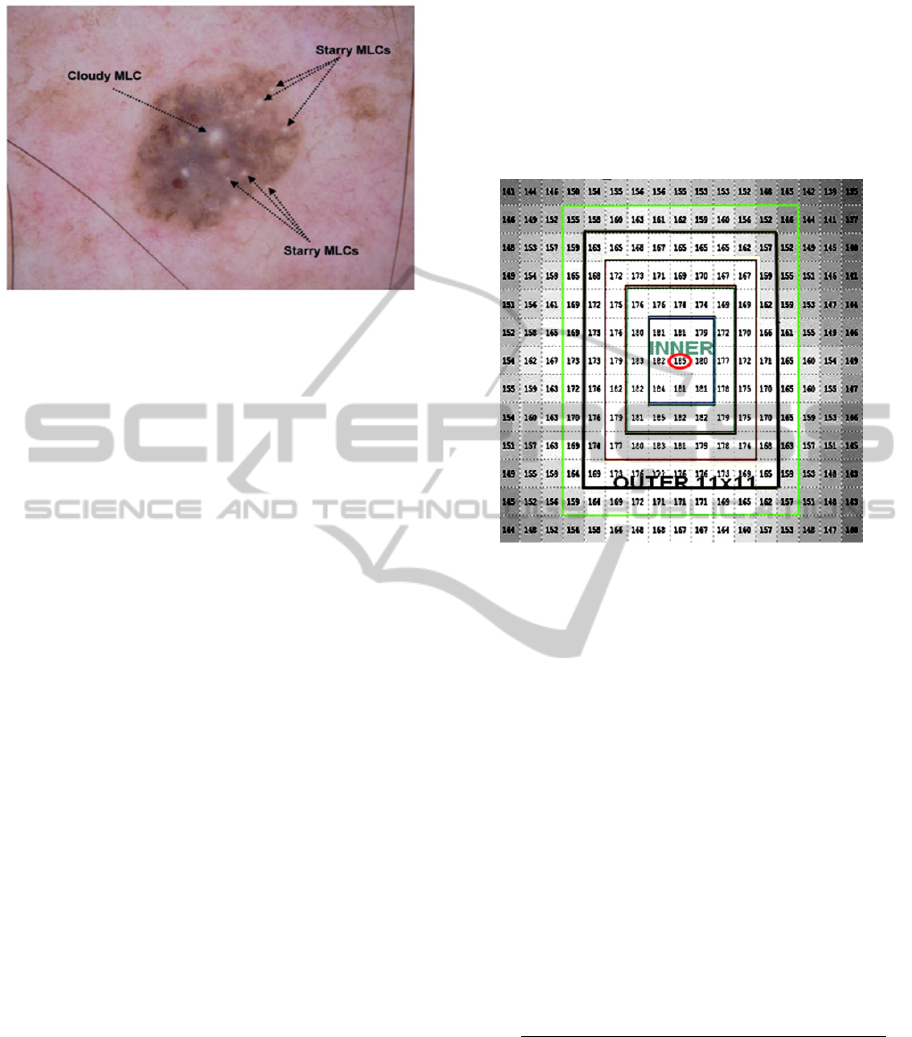
Figure 1: Seborrheic keratosis with a cloudy MLC and
multiple starry MLCs (Stricklin et al., 2011).
3 CANDIDATE STAR
SELECTION
3.1 Block-by-Block Selection
of Candidate Pixels
The lesion area is divided into 13
13 pixel blocks;
block size was empirically determined—as large as
possible for computational efficiency, with upper
bound constrained by the need to minimize MLC
loss due to multiple MLCs within a block. The
brightest pixel in each block is chosen as the center
for a candidate starry MLC (star).
3.2 Lesion Area Mean Intensity
as Threshold
Since stars are brighter than their surroundings, the
number of candidate stars can be additionally
reduced using a mean threshold, optimized at 0.85
(lesion mean intensity). To avoid “salt and
pepper” noise, a 3x3 mean filter was applied to the
3x3 neighborhood for each candidate pixel.
3.3 Rejecting Duplicate Candidates
If two candidate pixels occur in the same 13
13
block, the pixel with the highest intensity is
designated as the candidate pixel and all other pixels
are discarded.
4 STARRY MLC
CHARACTERISTICS
To get more details about the star, the difference in
intensity between consecutive concentric rings
around the central pixel was calculated (Figure 2).
Figure 2: MLC concentric rings, 11x11 region lime-green,
central pixel circled in red.
5 TEMPLATE MATCHING
The row vector method aided in star identification.
To remove numerous false positive star mimics, the
candidate stars were correlated with a star template.
5.1 Correlation Coefficient
and its Significance
Correlation has been used extensively for template
matching. Let f(x,y) be an image. Let w(x,y) be an
object of interest. If object w is present in f, the
correlation will be maximized at the location where
w finds a correspondence in f. Matching is
performed using the correlation coefficient
,
:
,
∑∑
,
̅
,
,
∑∑
,
̅
,
∑∑
,
/
where x = 0, 1, 2, 3 . . ., M-1, y = 0, 1, 2 . . ., N-1,
M
N is the size of f,
is the mean value of pixels
in w and
̅
is the mean value of the region that is
coincident with the current location of w. All
summations are taken over the coordinates common
to both f and w. The calculated correlation
coefficient γ(x,y) is scaled such that the maximum
TemplateMatchingforDetectionofStarryMilia-LikeCystsinDermoscopicImages
445
value is 1 and the minimum value is -1.
,
is
independent of amplitude in f and w (Gonzalez and
Woods, 2002). Since amplitudes are normalized,
,
depends only upon the match between shape
and relative shading, as in Figure 2. If the candidate
star has a similar shape and shading to the star
template, the correlation coefficient will be close to
1. For starry MLCs, 0.7 <
,
≤ 1.
5.2 Correlation with Different Star
Templates
Since starry MLCs vary in size, each candidate star
was correlated with star templates of sizes: 11
11,
17
17, and 23
23. The template with the highest
correlation coefficient for that star was selected and
the choice saved as ‘star size.’ Templates
synthesized various ways, including actual MLC
templates with and without rotation averaging and
contrast enhancement, showed no difference in MLC
screening results. Statistics on the central 11x11 star
region were retained (Table 1).
5.3 Application of Range
as a Threshold
All starry MLCs have a bright pixel at the center and
radially decreasing intensity. The difference
between maximum and minimum intensity, on the 0-
1 intensity scale, for the 11
11 center of the star
was determined. From 66 SK images, the data
regarding the relative variation in pixel intensities in
star centers were calculated. To be considered for
further processing, a star must have a difference
between the maximum and minimum pixel intensity
values in the 11
11 star center exceeding 0.14,
0.075 and 0.03, for star sizes 11, 17 and 23,
respectively. To illustrate the power of the central
range threshold in star elimination, a SK after the
first correlation had 34 candidate stars, whereas after
applying the range threshold for the 11
11 star
center, only 10 candidate stars remained, with no
true stars eliminated. For 100 training images, fewer
than 5% of the true starry MLCs were rejected.
6 CANDIDATE STAR SHAPE
ANALYSIS
6.1 Shape of the Starry MLC
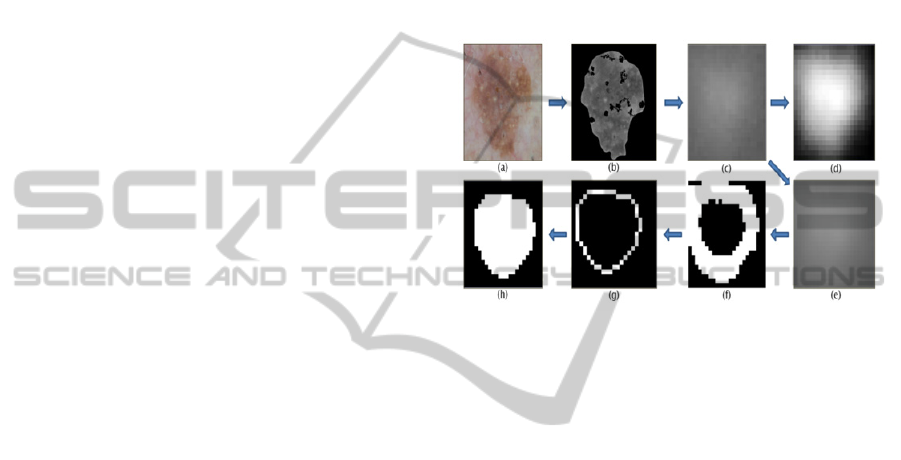
Star outlines are somewhat hazy (Figure 2). The
drop in the intensity values with a radial outwards
progression was not constant for all directions and
was not constant among starry MLCs. Therefore,
smoothing with a 3x3 mean filter applied with a
sliding window and histogram equalization were
performed, and the star shape was all points within
10% of the average intensity of the smoothed,
equalized object (Figure 3). Features analyzed
included area, perimeter, roundness
4
⁄
area), solidity, major and minor
axis lengths, eccentricity, and major axis/equivalent
diameter.
Figure 3: Formation of shape of the star for a true starry
MLC. (a) Original image – Seborrheic Keratosis. (b)
Lesion and bubble masks applied on blue plane. (c)
Enlarged version of a starry MLC. (d) Histogram
equalized starry MLC. (e) Enlarged version of smoothed
starry MLC. (f) Initial shape of the star. (g) Thinned – one
pixel width shape of the star. (h) Final filled centered star.
6.2 Second Correlation with Shape
of the Star
Once the shape is determined, an ideal elliptical or
circular binary star template is created, matching
shape and orientation. If the difference between the
major and minor elliptical axis is less than two
pixels, the shape is considered circular. The original
star candidate is correlated with this ideal star
template. This second correlation yields two
significant outputs: 1) Scaled output, to normalize
the effect of different candidate star sizes, with
scaling factors respectively 6, 4, and 3 for 11x11,
17x17, and 23x23 star candidates and 2) the
candidate star is histogram-equalized to better
differentiate skin pores from starry MLCs.
7 LOGISTIC REGRESSION
ANALYSIS
Thirty-three parameters obtained by the preceding
VISAPP2013-InternationalConferenceonComputerVisionTheoryandApplications
446
analysis were analyzed by the Statistical Analysis
System (SAS Institute, Cary, NC). The total number
of candidate pixels analyzed by logistic regression
was 1005 candidates from the seborrheic keratosis
images and 473 candidates from the melanoma
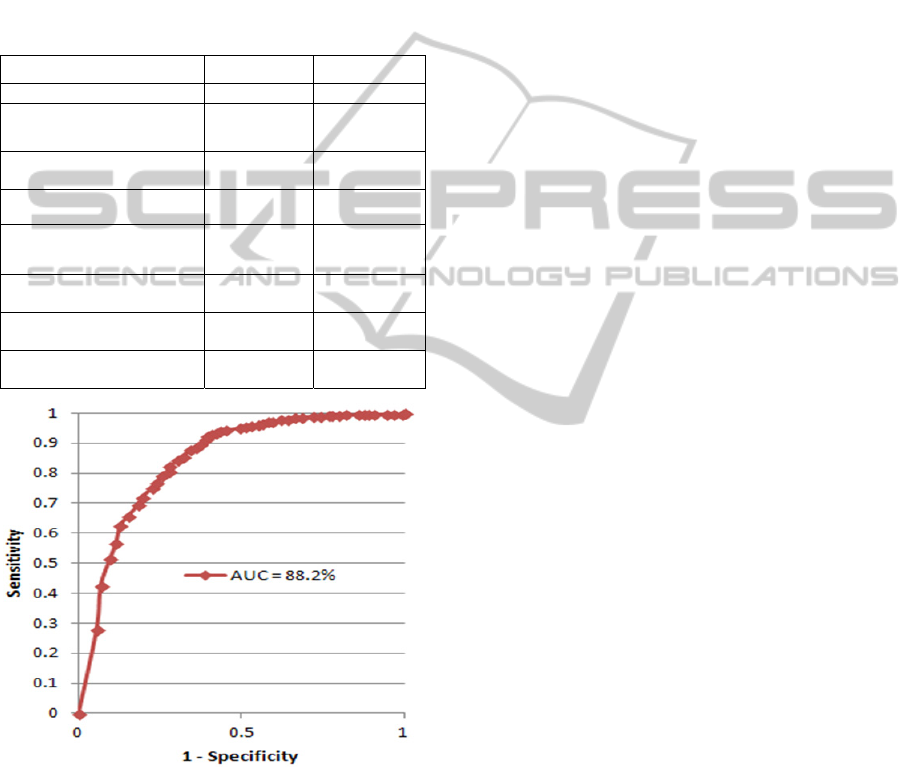
images. Significant features determined by logistic
regression (Table I) and the corresponding receiver
operating characteristic curve (Figure 4) are
displayed. The area under the ROC curve for MLC
vs. mimic discrimination is 88.2%.
Table 1: Significant features of logistic regression model.
Parameter Chi-Square Pr > Chi-Sq
Star size 24.6856 < .0001
First correlation coefficient
with ideal star template
29.1704 < .0001
Intensity difference between
star and surround
25.5965 < .0001
Mean of 11x11 star center 8.6837 0.0032
Variance of 11x11 star
center
10.0570 0.0015
Rise time of 11x11 star
center
30.8251 < .0001
Correlation coefficient to
the star shape template
11.1896 < .0008
Equalized correlation
coefficient
29.2425 < .0001
Figure 4: Receiver operating characteristic (ROC) curve
for detection of starry MLCs vs. mimics.
8 CONCLUSION AND FUTURE
WORK
This research was conducted to correctly classify
benign SKs based on automatically detected starry
MLCs. Well-known image processing techniques
were employed. Yet these techniques were
employed in novel ways: 1) new details for region of
interest (ROI) analysis of the centers of star
candidates, 2) template matching for size
determination, 3) a new method for determining
shape of hazy objects, and 4) performance of
multiple template correlations using unprocessed
ROIs, shape-limited ROIs, and histogram-equalized
ROIs. Other methods such as subtraction of a
filtered image from the original image were
attempted, i.e. the LaPlacian of Gaussian method as
a “tuning” filter for the fineness of detection.
However, the differences between star ROIs and
mimics are so tiny that fine details such as central
star range are needed. Because of the fine
discriminations needed, no simple filter or set of
simple blob feature suffices to discriminate starry
MLCs, and subtle intra-blob features were required.
The accuracy and the area under the receiver
operating characteristic curve show that the
algorithm presented here can identify most starry
MLCs and allow accurate classification. Future work
could increase MLC detection accuracy and benign
vs. melanoma discrimination by investigating the
following: 1) using a larger number of images, 2)
using finer gradation of MLC sizes, 3) finding
features of MLC mimics, e.g.. scales, 4) improving
bubble masks, and 5) using additional color planes.
REFERENCES
Braun, R. P., Rabinovitz, H. S., Krischer, J., Kreusch, J.,
Oliviero, M, Naldi, L., … Saurat, J.H. (2002).
Dermoscopy of Pigmented Seborrheic Keratosis: A
Morphological Study. Archives of Dermatology, 138,
1556-1560.
Cheng, Y., Swamisai, R., Umbaugh, S. E., Moss, R. H.,
Stoecker, W.V., Teegala, S., Srinivasan, S.K. (2008).
Skin lesion classification using relative color features.
Skin Research and Technology, 14(1), 53-64.
Gonzalez, R. C. & Woods, R. E. (2002). Digital Image
Processing. 2
nd
ed. New Jersey: Prentice Hall, pp.
698-704.
Lee, T. K. (2001). Measuring border irregularity and shape
of cutaneous melanocytic lesions. Ph.D. Thesis,
Simon Fraser University,Vancouver, British
Columbia.
MATLAB version 7.8.0 (R2009a). 2009. Image
Processing Toolbox. Natick, Massachusetts: The
MathWorks Inc.
Menzies, S. W., Kreusch, J., Byth, K., Pizzichetta, M. A.,
Marghoob, A., Braun, R., …Johr, R. (2008).
Dermoscopic evaluation of amelanotic and
hypomelanotic melanoma. Archives of Dermatology,
144(9), 1120-7.
TemplateMatchingforDetectionofStarryMilia-LikeCystsinDermoscopicImages
447

Stoecker, W. V., Gupta, K., Stanley, R. J., Moss, R. H.,
&Shrestha, B. (2005). Detection of asymmetric
blotches (asymmetric structureless areas) in
dermoscopy images of malignant melanoma using
relative color. Skin Research and Technology, 11(3),
179-84.
Stricklin, S. M., Stoecker, W. V., Oliviero, M. C.,
Rabinovitz, H.S., & Mahajan, S.K. (2011). Cloudy and
starry milia-like cysts: how well do they distinguish
seborrheic keratoses from malignant melanoma?
Journal of the European Academy of Dermatology and
Venereology, 25(10), 1222-4.
VISAPP2013-InternationalConferenceonComputerVisionTheoryandApplications
448
