
Adaptive Active Period Control for Low Power Consumption and
Low Latency in Multi-hop Wireless Sensor Networks
Narumi Kai, Shiro Sakata and Nobuyoshi Komuro
Graduate School of Advanced Integration Science, Chiba University, Chiba-shi, Chiba, Japan
Keywords:
Wireless Sensor Networks, Multi-hop, IEEE 802.15.4, Energy Efficiency, Low Latency.
Abstract:
IEEE 802.15.4 beacon-enabled mode can use the superframe structure for data transmission. In using the
superframe structure, the duty cycle of the wireless personal area network defined by the values of the beacon
order (BO) and superframe order (SO) can be adjusted in order to achieve high channel utilization and low
power consumption. The optimum values of BO and SO vary according to the network condition. The
present paper proposes a novel method that achieves low power consumption and low latency in a multi-hop
wireless sensor network. In the proposed method, active periods in the superframe structure are appropriately
assigned to routing nodes according to the network topology prior to data transmission, and the values of SO
are adaptively adjusted depending on the traffic load. Simulation results demonstrate the effectiveness of the
proposed method.
1 INTRODUCTION
With the rapid growth of wireless technologies and
the downsizing of devices, a number of investiga-
tions regarding wireless sensor networks (WSNs)
have been conducted in recent years. Environmen-
tal monitoring, crime prevention, disaster prevention,
home automation, and smart metering are considered
to be major applications of sensor networks.
The IEEE 802.15.4 standard defines the medium
access control (MAC) and physical layer specifica-
tions for low-rate and low-power WSNs (IEEE 802
Working Group, 2006). Zigbee (Zigbee Aliance,
2006), which is a representative WSN, adopts the
IEEE 802.15.4 standard. In IEEE 802.15.4, there
are two modes of operation: non-beacon-enabled and
beacon-enabled modes.
In the non-beacon-enabled mode, communication
is not synchronized, even if the parent-child relation
between neighboring nodes is established. In addi-
tion, the child node can start the transmission at any
time when data is to be transmitted, because the par-
ent node is always active. This, however, causes a
significant increase in power consumption.
In the beacon-enabledmode, after the parent-child
relation between neighboring nodes is established,
these nodes communicate while synchronizing with
a beacon. A child node transmits data toward a parent
node when the parent node is active. Power consump-
tion can be reduced because the parent node can sleep
in the beacon-enabled mode.
The present paper deals with IEEE 802.15.4
beacon-enabled WSNs while considering these char-
acteristics. The active period in the superframe con-
sists only of a contention access period (CAP). For
the sake of simplicity in validating the proposed
method, every contention free access period (CFP) is
neglected.
In the beacon-enabled mode, the duty cycle is de-
termined by two parameters, the beacon order (BO)
and superframe order (SO), both of which are integers
and 0 SO BO 14. When the duty cycle is small, the
power consumption is low for a low traffic load. The
end-to-end transmission delay and power consump-
tion, however, increase when the traffic is heavy, be-
cause collisions frequently occur. On the other hand,
when the duty cycle is large, collisions can be reduced
in the case of heavy traffic. Power consumption, how-
ever, increases even when the traffic load is low.
Determination of the appropriate BO and SO is
difficult because a wide variety of applications and
network topologies are assumed in WSNs. Although
a number of methods that adaptivelycontrol the active
period by adjusting BO and SO have been proposed,
fewof these methods deal with a multi-hop network in
which the congestion in the vicinity of the sink node
poses a serious problem.
The present paper proposes a novel method that
111
Kai N., Sakata S. and Komuro N..
Adaptive Active Period Control for Low Power Consumption and Low Latency in Multi-hop Wireless Sensor Networks.
DOI: 10.5220/0004228801110118
In Proceedings of the 2nd International Conference on Sensor Networks (SENSORNETS-2013), pages 111-118
ISBN: 978-989-8565-45-7
Copyright
c
2013 SCITEPRESS (Science and Technology Publications, Lda.)

0 1 2 3 4 5 6 7 8 9
10
11
12
13
14
15
CAP CFP
GTS
GTS
BeaconBeacon
Inactive
(Active)
BI = aBaseSuperframeDuration
2
BO
symbols
SD = aBaseSuperframeDuration
2
SO
symbols
Figure 1: IEEE 802.15.4 superframe structure.
achieves low power consumption while maintain-
ing low end-to end transmission delay for an IEEE
802.15.4 beacon-enabled multi-hop WSN. In the pro-
posed method, active periods in the superframe struc-
ture are appropriately assigned to routing nodes ac-
cording to the network topology prior to data trans-
mission in order to reduce the congestion in the vicin-
ity of the sink node. After transmission starts, the val-
ues of SO are adaptively adjusted depending on the
traffic load. Simulation results demonstrate the effec-
tiveness of the proposed method.
The rest of this paper is organized as follows.
Section 2 introduces an overview of IEEE 802.15.4
beacon-enabled mode. Section 3 describes related
works. Section 4 explains our proposed method in
detail. Section 5 gives an evaluation of our proposed
method by showing simulation results. Finally, Sec-
tion 6 concludes the paper.
2 OVERVIEW OF IEEE 802.15.4
BEACON-ENABLED MODE
2.1 Characteristics of IEEE 802.15.4
Beacon-enabled Mode
The superframe structure in the beacon-enabled mode
is shown in Figure 1 . The beacon Interval (BI) and
superframe Duration (SD) are determined by Eqs. (1)
and (2).
BI = aBaseSuper frameDuration× 2
BO
(1)
SD = aBaseSuper frameDuration× 2
SO
(2)
(0 ≤ SO ≤ BO ≤ 14)
The value of aBasesuperframeDuration is fixed to
960 [symbols] (= 15.36 [msec]). The smaller the BI,
the more significantly the delay can be reduced, be-
cause the frequency of active periods becomes large
per unit time. The larger the SD, the greater the num-
ber of frames that can be transmitted in a superframe.
However, it is necessary to appropriately set BO and
SO depending on the number of full function devices
(FFDs), because a multi-hop network cannot be con-
figured if BO = SO. Here, the node, which has the
routing function and can have multiple child nodes in
its communication range, is configured as the FFD.
The sink node and routing nodes are referred to as
the coordinator and the routers, respectively, in Zig-
Bee. In the present paper, these nodes are assumed
to be configured as FFDs, and sensor nodes corre-
sponding to end devices in Zigbee are configured as
reduced function devices (RFDs). The duty cycle in
the IEEE 802.15.4 beacon-enabled mode is expressed
in Eq. (3).
DutyCycle =
ActivePeriod
ActivePeriod + SleepPeriod
=
Super frameDuration
BeaconInterval
=
2
SO
2
BO
(3)
The smaller the difference between BO and SO, the
larger the duty cycle.
2.2 Parameters BO and SO and
Number of FFDs
If multiple FFDs in the IEEE 802.15.4 beacon-
enabled mode have SDs at the same time, colli-
sions among beacons are likely to occur. When such
collisions occur, communication is unavailable be-
cause synchronization for the communication is not
achieved. Therefore, it is necessary for each FFD to
use each SD exclusively in order to avoid collisions
among beacons. Eq. (4) holds for the case in which
each FFD uses each SD exclusively.
2
BO−SO
≥ FFDnum =
hop−1
∑
k=0
n
k
(4)
Here, the network is assumed to configure an n-ary
tree by the FFDs. An n-ary tree is a tree in which,
SENSORNETS2013-2ndInternationalConferenceonSensorNetworks
112

ACKBeacon
Data
t
ack
CCA
Backoff
IFS
backoff period
Parent
Child
Figure 2: Slotted CSMA/CA.
Start
CR
Data
> TH
Collision
?
OR
Superframe
> TH
SfOccupy
?
OR
Superframe
> TH
SfOccupy
?
SO-- SO++ SO+=2End
No
Yes
Yes
Yes
No
No
Figure 3: Flowchart of sink node in DSAA.
with the exception of edge routers, every FFD has n
child nodes. An edge router is a routing node that
is the farthest from the sink node. In an n-ary tree,
all hopcounts between the sink node and each sensor
node are the same. The hopcount is denoted as hop in
Eq. (4).
3 RELATED WORK
In order to control the active period, adjusting the val-
ues of BO and SO adaptively is considered to be ef-
fective. A number of methods have been proposed
that adaptively increase or decrease the values of BO
and SO, with the goal of reducing power consumption
and transmission delay (Joen et al., 2007), (J. Lee et
al., 2007), and (Paz et al., 2010). The dynamic su-
perframe adjustment algorithm (DSAA), in which SO
is adaptively adjusted while fixing BO (B. H. Lee et
al., 2010), is one such method. In the DSAA, the
collision ratio and the superframe occupation ratio,
which are metrics of the traffic load, are calculated,
and SO is adjusted according to the calculated traffic
load. However, these methods, including the DSAA,
are intended for use with a single-hop network.
3.1 Calculation of Collision Ratio and
Superframe Occupation Ratio in
DSAA
Slotted carrier sense multiple access with collision
Start
Active period
end ?
I have data to
send ?
Transmission
success ?
End
Enter inactive period
wait for next superframe
Idle mode
Transmit data using
the slotted CSMA/CA
Transmit toning signal
Yes
Yes
Yes
No
No
No
Figure 4: Flowchart of sensor nodes in DSAA.
avoidance (CSMA/CA) is used in the CAP of IEEE
802.15.4 in the DSAA. In slotted CSMA/CA, clear
channel assessment (CCA) and back-off are con-
ducted based on the smallest unit of time expressed in
unit backoff periods (UBPs) = 20 [symbols]. Figure 2
shows an overview of the slotted CSMA/CA mecha-
nism.
The collision ratio and the occupation ratio of the
superframe are represented by Eqs. (5) and (6), re-
spectively.
OR
Super frame
=
Packet
Rx
× Node
UBPs Total
S
UBPs SO
− S
UBPs Beacon
× 100%
(5)
CR
Data
=
Node
Data Failure
Node
Data Success
+ Node
Data Failure
× 100%
(6)
Here, Packet
Rx
is the number of packets received
in the CAP, Node
UBPs Total
is the number of UBPs
needed to complete the data transmission, S
UBPs SO
is the number of UBPs in the active period, and
S
UBPs Beacon
is the length of the beacon frame in UBP.
Node
Data Success
is the number of nodes that have suc-
cessfully transmitted data, and Node
Data Failure
is the
number of nodes that have unsuccessfully transmitted
data. Unsuccessful transmission is detected by means
of a toning signal (Koubaa et al., 2006).
3.2 Overview of DSAA
The sink node will start to adjust the duty cy-
cle of the next superframe when the values of
ORsuper frame and CRData are calculated. Based
on the relation among ORsuper frame, CRData,
THsuper frameOccupy, and THCollision, there are
four possible situations. Depending on the situation,
AdaptiveActivePeriodControlforLowPowerConsumptionandLowLatencyinMulti-hopWirelessSensorNetworks
113

the sink node adjusts the value of SO, as shown in
Figure 3.
If a child node needs to send data in the CAP, the
child node will try to transmit the data using the slot-
ted CSMA/CA algorithm. Otherwise, if there is no
data to send, the node will switch to the idle mode. At
the end of the CAP, if the node has no data to send, the
node will do nothing and will enter the inactive period
or the CFP. However, if the node cannot transmit its
data successfully in the current superframe, the node
will send a toning signal to notify the sink node of the
failure. The flowchart is shown in Figure 4.
New active periods of some other FFDs may start
after an active period of an FFD ends n a multi-hop
network. Therefore, there is a possibility that the
toning signal will collide with subsequent beacons or
data packets. This indicates that the DSAA is not ap-
plicable to the multi-hop networks. In addition, the
toning mechanism imposes some changes on both the
hardware and the protocol itself (Koubaa et al., 2006).
4 PROPOSED METHOD
The present paper proposes a novel method that
achieves low power consumption while maintaining
a low end-to-end transmission delay for an IEEE
802.15.4 beacon-enabled multi-hop WSN. In the pro-
posed method, active periods in the superframe struc-
ture are appropriately assigned to routing nodes ac-
cording to the number of edge routers, prior to data
transmission in order to reduce the congestion in the
vicinity of the sink node. After the data transmission
starts, the values of SO are adaptively adjusted de-
pending on the traffic load.
Each sensor node can directly communicate with
only one edge router. The traffic load is calculated in a
manner similar to the DSAA. The toning signal is not
used in the calculation of the collision ratio. Instead
of the toning signal, the number of retransmissions
is used as the metric of the traffic load. The number
of retransmissions is appended to data packets in the
sending node, and the number is counted in each re-
ceiving node.
4.1 Active Period Assignment
Depending on Number of Edge
Routers
In a multi-hop WSN, when the traffic load corre-
sponding to the sensing frequency at each sensor
nodes is high, congestion occurs in the vicinity of the
sink node. In order to mitigate such congestion, the
2
1
3
4 5 6 7
R(2,3) = 1
SOmax(2,3) = 3
R(1) = 2
SOmax(1) = 4
R(4,5,6,7) = 0
SOmax(4,5,6,7) = 2
Sink Node
Router
Figure 5: Example of active period assignment.
1
2
3
4
5
6
7
BI = 983[ms] (BO = 6)
time
Figure 6: Beacon scheduling.
active period of the FFD is assigned to be long, be-
cause the number of hops to the sink node is small
and the number of sensors placed beneath the FFD is
large. Here, SO of each FFD is decided based on the
number of edge routers beneath the FFD.
The node number of each FFD is denoted as i [1,
2, c, n]. n
ER
(i) is defined as the number of edge
routers beneath the FFD(i). Integer R(i) is defined
as the smallest R that satisfies Eq. (7).
n
ER
(i) ≤ 2
R
(7)
BOmin is defined as the smallest BO that satisfies
Eq. (8).
n
∑
i=1
2
R(i)
≤ 2
BO
(8)
In the network that constructs an n-ary tree, as men-
tioned in Section 2.2, BOmin can be expressed as
Eq. (9).
2
BO
min
≥ hop × n
hop−1
(9)
SOmax(i), or the maximum value of SO for each
FFD(i), is determined by Eq. (10).
SO
max
(i) = R(i) + (BO− BO
min
) (10)
For example, if the network topology is a 3-hop bi-
nary tree, R(i) is determined as shown in Figure 5,
and BOmin = 4. When BO = 6, SOmax(i) is deter-
mined as shown in Figure 5.
In the proposed method, beacons are scheduled as
shown in Figure 6 so that no collisions occur, and
low latency can be achieved when the active period
of each FFD is 2
SOmax(i)
(Eq. (2)). This active period
assignment prior to the data transmission can achieve
SENSORNETS2013-2ndInternationalConferenceonSensorNetworks
114
low power consumption and low latency, even when
the traffic load is high.
4.2 Adaptive Active Period Control
Method based on Traffic Load
The active period of each FFD is adaptivelycontrolled
using the metric of the traffic load in a manner similar
to the DSAA. The occupation ratio of the superframe
denoted as ORsuperframe is determined by Eq. (5).
The number of retransmissions as the metric of the
traffic load is evaluated using RTData. RTData of
each parent node is the number of retransmissions
per frame received from its child nodes. Each node
counts the number of retransmissions when transmit-
ting data. In the sensor node, the number of retrans-
missions is added to the data frame when the sensing
data is transmitted to the parent node. In the routing
node, the number of retransmissions of the routing
node is added to the number of retransmissions in-
cluded in the data frame. Based on this information,
the parent nodes detect the occurrence of collisions at
their child nodes and increases the active period im-
mediately.
In the proposed method, four thresholds are
defined, whereas two are defined in the DSAA.
These thresholds are denoted as THS fOccupy(1),
THS fOccupy(2), THSfOccupy(3), and THRetry
and are set for ORsuper frame and RTData,
where THSfOccupy(1) THS fOccupy(2)
THS fOccupy(3). In each FFD, the occupation
ratio of the superframe and the number of retransmis-
sions are calculated at the end of the active period.
As shown in Figure 7, SO of the next active period
is adjusted according to the traffic load, comparing
ORsuperframe and RTData with four thresholds. The
traffic load is represented using four stages in the
same manner as the DSAA. These four thresholds
enable finer adjustment of SO than the DSAA.
5 PERFORMANCE EVALUATION
5.1 Simulation Scenarios
The performance improvement achieved by the pro-
posed method is evaluated via simulation. The IEEE
802.15.4 beacon-enabled mode, the DSAA and the
proposed method are compared using the QualNet
simulator. The value of BO is fixed to 6 in both meth-
ods. The value of SO can be adjusted from 0 to the
maximum value that is possible in the network topol-
ogy. Simulation is conducted for five tree topolo-
No
Start
RT
Data
> TH
Retry
?
OR
Superframe
> TH
SfOccupy
(3)?
OR
Superframe
> TH
SfOccupy
(1)?
SO--
SO++
SO+=2
End
Yes
Yes
Yes
No
No
OR
Superframe
> TH
SfOccupy
(2)?
Yes
No
Figure 7: Flowchart of FFDs in proposed method.
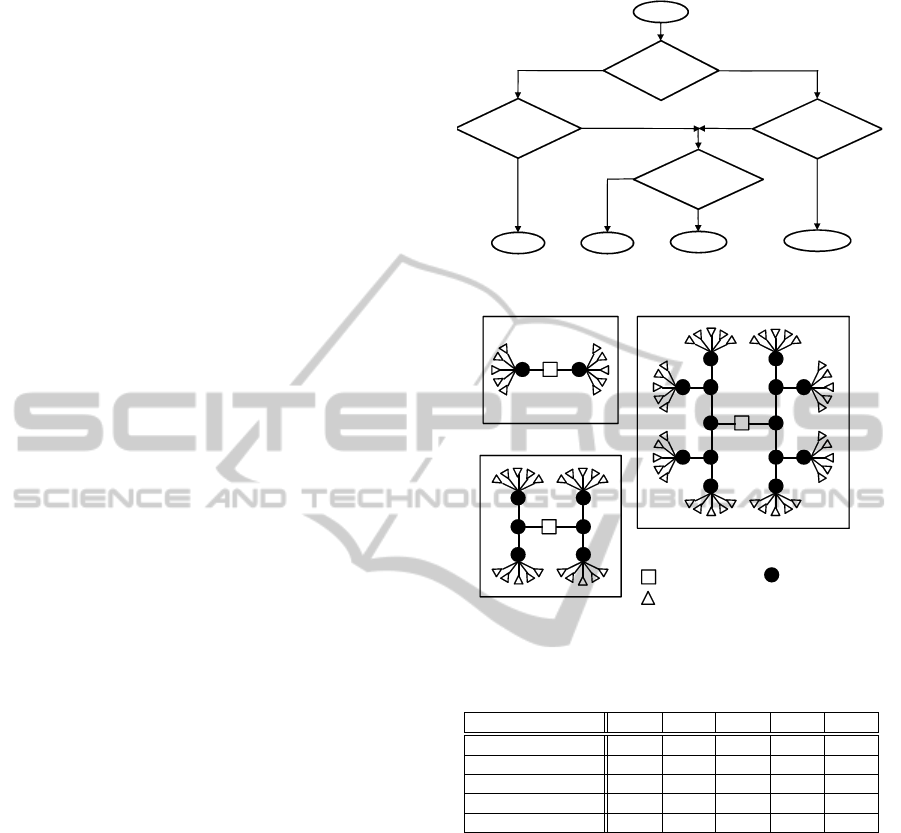
(a) 2-hop
(b) 3-hop
(c) 4-hop
Sink Node
Router
Sensor Node
Figure 8: Network topology of binary tree.
Table 1: Topology and number of nodes.
Topology(n,h) (2,2) (2,3) (2,4) (4,2) (4,3)
Relay Node 2 6 14 4 20
Sensor Node(5) 10 20 40 20 80
Sensor Node(10) 20 40 80 40 160
Sensor Node(15) 30 60 120 60 240
Sensor Node(20) 40 80 160 80 320
N-ary tree is denoted as n and hopcount is denoted as h.
gies, 2-, 3-, and 4-hop binary trees, and 2- and 3-hop
quad trees. Each edge router is assumed to be able to
directly communicate with 1 to 20 sensor nodes. In
each topology, the number of sensor nodes and rout-
ing nodes are determined as shown in Table 1. As
an example, Figure 8 shows the topologies of 2-, 3-,
and 4-hop binary trees when each edge router has five
sensor nodes as child nodes.
Table 2 shows the simulation parameters. The four
thresholds used in the proposed method are constant
values, as shown in Table 2. Evaluation is conducted
in terms of the total energy consumed by all of the
nodes and the average end-to-end transmission delay
with respect to the number of sensor nodes and the
offered load. The offered load represents the number
of frames to be sent by one sensor node per sec. In
AdaptiveActivePeriodControlforLowPowerConsumptionandLowLatencyinMulti-hopWirelessSensorNetworks
115

Table 2: Simulation parameters.
Parameter Value
Physical Layer IEEE 802.15.4 250[Kbps]
Data Frame Size 30[bytes]
Offerd Load 0.0167[pps]
TH
Sf Occupy
(1) 60[%]
TH
Sf Occupy
(2) 40[%]
TH
Sf Occupy
(3) 20[%]
TH
Retry
0
addition, the sensing frequency is assumed to be the
same at each sensor node. The carrier sensing range
is assumed to be twice the transmission range, which
means that no hidden terminals are considered.
5.2 Simulation Results
5.2.1 Comparison with the IEEE 802.15.4
The proposed method (BO = 6) and the IEEE802.15.4
beacon-enabled mode (BO = 6, SO =0, 1, 2, and 3)
are compared for a 3-hop binary tree. The simula-
tion results are compared in terms of the average total
power consumption and the end-to-end transmission
delay with respect to the number of nodes in Figures 9
and 10, respectively.
As shown in Figure 9, the power consumption
is the lowest for the case of IEEE 802.15.4 SO = 0
when the number of sensor nodes is small. The power
consumption, however, increases significantly as the
number of sensor nodes increases. Figure 10 shows
that the delay increases due to collisions as the traffic
load increases. Even for the case of IEEE 802.15.4
SO = 1, the delay starts to increase from the point at
which each edge router has approximately 16 sensor
nodes, and the power consumption also increases. On
the other hand, for the case of IEEE 802.15.4 SO = 2
or SO = 3, the power consumption is much higher
than for case of SO = 0 or SO = 1. This is because
power wastage occurs due to the increase in active pe-
riods.
The powerconsumption of the proposed method is
approximately equal to that of IEEE 802.15.4 SO = 0,
when each edge router has one to five sensor nodes,
and is equal to that of IEEE 802.15.4 SO = 1, when
each edge router has more than five sensor nodes.
When each edge router has more than 17 sensor
nodes, the delay in IEEE 802.15.4 SO = 1 increases
due to collisions. On the other hand, the delay is at
most approximately 1.5 [s] in the proposed method. It
can be shown that the proposed method appropriately
adjusts the value of SO according to the traffic load.
Similar characteristics are shown in other topologies.
Figure 11 shows the variation of SO of the sink
0
10
20
30
40
50
60
70
80
90
100
1 3 5 7 9 11 13 15 17 19
Total Energy Consumption [mJ]
Number of Sensor nodes
Proposed Method
IEEE 802.15.4 SO=0
IEEE 802.15.4 SO=1
IEEE 802.15.4 SO=2
IEEE 802.15.4 SO=3
Figure 9: Energy consumption with respect to number of
nodes (3-hop binary tree).
0
0.5
1
1.5
2
2.5
3
3.5
4
4.5
5
1 3 5 7 9 11 13 15 17 19
Average End-to-End Delay [sec]
Number of Sensor nodes
Proposed Method
IEEE 802.15.4 SO=0
IEEE 802.15.4 SO=1
IEEE 802.15.4 SO=2
IEEE 802.15.4 SO=3
Figure 10: Delay with respect to number of nodes (3-hop
binary tree).
node with respect to the simulation time in a 3-hop
binary tree topology for the proposed method. In
Figure 12, the proposed method and IEEE 802.15.4
SO = 0, 1, 2,and 3 are compared in terms of the delay
and power consumption in this topology. Figures 11
and 12 show that the proposed method reduces the
power consumption and delay by appropriately ad-
justing the value of SO depending on the traffic load.
Figures 13 and 14 show the characteristics in the
case of a high traffic load. In these figures, the pro-
posed method (BO = 6) and IEEE802.15.4 beacon-
enabled mode (BO = 6, SO = 0, 1, and 2) are com-
pared for a 4-hop binary tree. The results in terms
of the average total power consumption and the end-
to-end transmission delay with respect to the offered
SENSORNETS2013-2ndInternationalConferenceonSensorNetworks
116

Table 3: Variation of number of sensor nodes.
Simulation time[sec] 0 - 700 700 - 1200 1200 - 1700 1700 - 2200 2200 - 2700 2700 - 3600
Number of sensor nodes 5 10 15 20 10 5
0
1
2
3
4
200 700 1200 1700 2200 2700 3200
SO Value
Simulation Time [sec]
Figure 11: Value of SO with respect to simulation time.
0
0.2
0.4
0.6
0.8
1
1.2
1.4
0
10
20
30
40
50
60
70
Proposed
Method
IEEE
802.15.4
SO=0
IEEE
802.15.4
SO=1
IEEE
802.15.4
SO=2
IEEE
802.15.4
SO=3
Average End-to-End Delay [sec]
Total Energy Cousumption[mJ]
Energy
Delay
Figure 12: Energy consumption and delay.
load are compared inFigures 13 and 14, respectively.
As shown in Figure 15, even for the case of IEEE
802.15.4 SO = 2, the delay increases significantly due
to collisions in the vicinity of the sink node. The pro-
posed method, however, reduces the delay by sup-
pressing such collisions. This is achieved by appro-
priately setting the value of SO according to the num-
ber of edge routers in the topology, prior to the data
transmission.
5.2.2 Effect of thresholds in Adaptive Active
Period Control
The SO adjustment mechanism of the proposed
method (Figure 7) and that of the DSAA (Figure 3)
are compared for a 3-hop binary tree. In this com-
parison, the proposed method and the DSAA use the
same active period assignment. When the thresh-
0
200
400
600
800
1000
1200
1400
1600
1800
2000
0 0.05 0.1 0.15
Total Energy Consumption [mJ]
Offered Load [pps]
Proposed Method
IEEE 802.15.4 SO=0
IEEE 802.15.4 SO=1
IEEE 802.15.4 SO=2
Figure 13: Energy consumption with respect to offered load
(4-hop binary tree).
0
200
400
600
800
1000
1200
1400
1600
0 0.05 0.1 0.15
Average End-to-End Delay [sec]
Offered Load [pps]
Proposed Method
IEEE 802.15.4 SO=0
IEEE 802.15.4 SO=1
IEEE 802.15.4 SO=2
Figure 14: Delay with respect to offered load (4-hop binary
tree).
olds of the superframe occupation ratio and the num-
ber of retransmissions are expressed as THS fOccupy
and THRetry, respectively, the SO adjustment mech-
anism of the DSAA is represented as the DSAA
(THS fOccupy, THRetry). The simulation results in
terms of the average total power consumption and the
end-to-end transmission delay are compared in Fig-
ures 15 and 16, respectively. As can be seen, the
power consumption of the proposed method is lower
than that of the DSAA, while maintaining the low de-
lay. This effect is mainly achieved by the thresholds
defined in the proposed method.
AdaptiveActivePeriodControlforLowPowerConsumptionandLowLatencyinMulti-hopWirelessSensorNetworks
117

0
10
20
30
40
50
60
70
80
90
100
1 3 5 7 9 11 13 15 17 19
Total Energy Consumption [mJ]
Number of Sensor nodes
Proposed Method(60,40,20,0)
Proposed Method(60,40,20,1)
DSAA(20,0)
DSAA(60,0)
DSAA(20,1)
DSAA(60,1)
Figure 15: Energy consumption with respect to number of
nodes (3-hop binary tree).
0
0.5
1
1.5
2
2.5
3
3.5
4
4.5
5
1 3 5 7 9 11 13 15 17 19
Average End-to-End Delay [sec]
Number of Sensor nodes
Proposed Method(60,40,20,0)
Proposed Method(60,40,20,1)
DSAA(20,0)
DSAA(60,0)
DSAA(20,1)
DSAA(60,1)
Figure 16: Delay with respect to number of nodes (3-hop
binary tree).
6 CONCLUSIONS
The present paper proposed a novel method that re-
duces the power consumption while keeping the la-
tency low in an IEEE 802.15.4 beacon-enabled multi-
hop WSN. In the proposed method, active periods in
the superframe structure are appropriately assigned
to routing nodes depending on the number of edge
routers, prior to data transmission. After the data
transmission starts, the values of SO are adjusted ap-
propriately depending on the traffic load. A sim-
ulation evaluation has demonstrated that the pro-
posed method maintains lower power consumption
and lower end-to-end transmission delay regardless
of the traffic load, as compared to the IEEE 802.15.4
beacon-enabled mode.
The setting of appropriate thresholds and the eval-
uation of various BO values for various network
topologies are areas for future research.
REFERENCES
IEEE 802 Working Group, 2006. Standard for Part 15.4:
Wireless Medium Access Control (MAC) and Phys-
ical Layer (PHY) Specifications for Low-Rate Wire-
less Personal Area Networks (LR-WPANs).
ZigBee Aliance, 2006. ZigBee Specification 2006. Website:
http://www.zigbee.org/.
J. Jeon, J. W. Lee, J. Y. Ha, and W. H. Kwon, 2007. DCA:
Duty-Cycle Adaptation Algorithm for IEEE 802.15.4
Beacon-Enabled Networks. In Proceedings of Vehicu-
lar Technology Conference, pp. 110-113.
J. Lee, J. Y. Ha, J. Jeon, D. S. Kim, and W. H. Kwon,
2007. ECAP: A Bursty Traffic Adaptation Algorithm
for IEEE 802.15.4 Beacon-Enabled Networks. In Pro-
ceedings of Vehicular Technology Conference, pp.
203-207.
R. Paz, and D. Pesch, 2010. DCLA: A Duty-Cycle Learning
Algorithm for IEEE 802.15.4 Beacon-Enabled WSNs.
In Proceedings of ADHOCNETS, pp. 217-232.
B. H. Lee, and H. K. Wu, 2010. Study on a Dynamic Super-
frame Adjustment Algorithm for IEEE 802.15.4 LR-
WPAN. In Proceedings of Vehicular Technology Con-
ference, pp. 1-5.
A. Koubaa, M. Alves, B. Nefzi, and Y-Q. SongC2006. Im-
proving the IEEE 802.15.4 Slotted CSMA/CA MAC
for Time-Critical Events in Wireless Sensor Net-
works. In Proceedings of Fifth International Work-
shop on Real-Time Networks.
SENSORNETS2013-2ndInternationalConferenceonSensorNetworks
118
