
Fuzzy-enhanced, Real-time Capable Detection of Biological Viruses
using a Portable Biosensor
Pascal Libuschewski
1,2
, Dominic Siedhoff
1
, Constantin Timm
2
, Andrej Gelenberg
2
and Frank Weichert
1
1
Department of Computer Science 7, TU Dortmund University, Otto-Hahn-Str. 16, Dortmund, Germany
2
Department of Computer Science 12, TU Dortmund University, Otto-Hahn-Str. 16, Dortmund, Germany
Keywords:
Fuzzy Logic, Real-time, Mobility, Biosensor, Biological Virus Detection, GPGPU.
Abstract:
This work presents a novel portable biosensor for indirect detection of viruses by optical microscopy. The
focus lies on energy-efficient real-time data analysis for automated virus detection. The superiority of our
fuzzy-enhanced time-series analysis over hard thresholding is demonstrated. Real-time capability is achieved
through general-purpose computing on graphics processing units (GPGPU). It is shown that this virus detec-
tion is real-time capable on an off-the-shelf laptop computer, allowing for a wide range of in-field use-cases.
1 INTRODUCTION
Rising numbers of global virus epidemics increase
the demand for infection control (Mairhofer et al.,
2009). It is desirable to deliver diagnoses on-site
and as quickly as possible, in order to prevent further
spread of virus-transmitted diseases (Erickson et al.,
2008). This calls for virus detection devices which are
fast and portable. Such devices can be used e.g. at air-
ports, to answer the question whether or not passen-
gers might propagate contagious diseases from high
risk regions. A novel method providing the basis for a
portable and real-time capable virus detection device
is the so-called PAMONO technique (Plasmon As-
sisted Microscopy of Nano-Size Objects) (Weichert
et al., 2010; Zybin and et al., 2010). It enables selec-
tive detection of different types of nano-objects, in-
cluding but not limited to viruses. In order to be de-
tected, the nano-objects must be immobilized on the
surface of the PAMONO biosensor. In the case of
viruses, this is achieved by preparing the sensor sur-
face with antibodies. Using different antibodies en-
ables distinction of multiple strains of viruses. Con-
versely, it it possible to determine which antibodies
are capable of attaching to a certain kind of virus.
These capabilities are combined in an inexpensive de-
vice, consisting of the biosensor and of a laptop com-
puter for data analysis.
The contribution of this work is twofold: Firstly, a
fuzzy approach for virus detection is presented as an
improvement over the existing real-time PAMONO
data analysis pipeline described in (Siedhoff et al.,
2011). Secondly, it is described how this analysis
pipeline was ported to mobile computers, maintain-
ing its real-time capability.
The paper is structured as follows: Section 1.1
briefly sketches the physics behind the PAMONO
biosensor. Section 2 describes the data analysis
pipeline, while focusing on the fuzzy virus detection
algorithm. Section 3 covers aspects of mobility. Fi-
nally, sections 4 and 5 provide results and discussion.
1.1 PAMONO Biosensor
PAMONO is the acronym for Plasmon Assisted
Microscopy of Nano-Size Objects, i.e. objects on
the nanometer scale are detected using optical mi-
croscopy (Zybin and et al., 2010). As Ernst Abbe
discovered, optical microscopy is diffraction-limited
to imaging objects that must exhibit a minimum ex-
tension of half the wavelength of the employed light
(Abbe, 1873). As a consequence, optical microscopy
lacks the resolving power to directly detect most types
of viruses. PAMONO is an indirect detection method
that bridges the gap between the nano- and microme-
ter scale by utilizing the surface plasmon resonance
effect. This effect is stimulated by illuminating a
thin gold layer (the sensor surface) with a super-
luminescent diode (Figure 1, left). The gold layer is
prepared with antibodies. Viruses are pumped over
169
Libuschewski P., Siedhoff D., Timm C., Gelenberg A. and Weichert F..
Fuzzy-enhanced, Real-time Capable Detection of Biological Viruses using a Portable Biosensor.
DOI: 10.5220/0004230201690174
In Proceedings of the International Conference on Bio-inspired Systems and Signal Processing (BIOSIGNALS-2013), pages 169-174
ISBN: 978-989-8565-36-5
Copyright
c
2013 SCITEPRESS (Science and Technology Publications, Lda.)
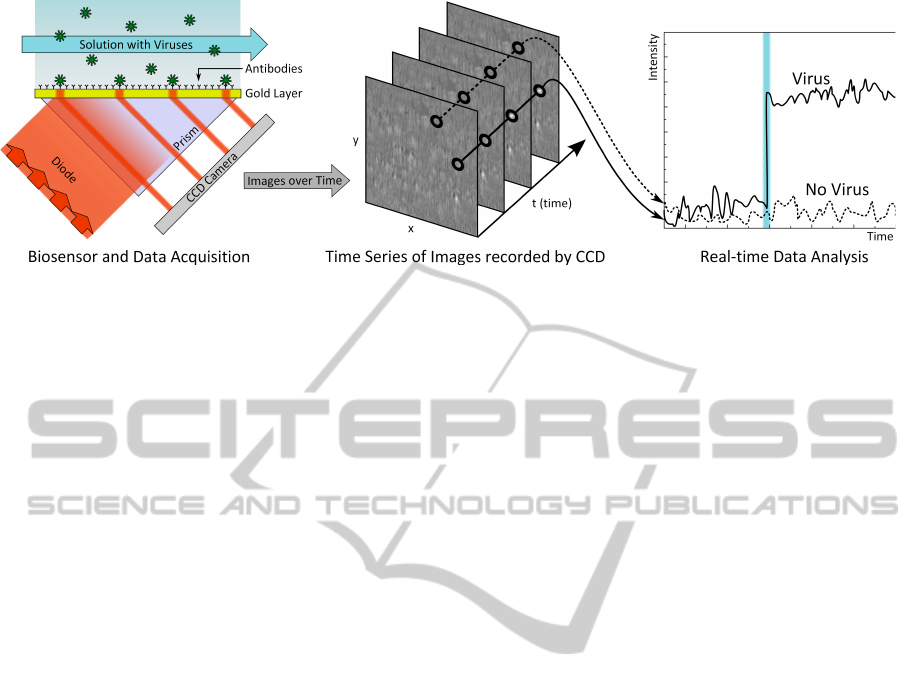
Figure 1: PAMONO biosensor (left), the recorded data (center) and the concept of virus detection (right).
the gold layer within a buffer solution. If a virus
attaches to an antibody, the surface plasmon reso-
nance properties change within a micrometer scale
area around that nanometer scale attachment. This re-
sults in an increased reflectance of the sensor surface
in that micrometer scale area. More light from the
diode is reflected at the attachment site, which can be
detected using optical microscopy.
The light reflected from the gold layer is cap-
tured with a highly sensitive 12-Bit CCD camera chip,
recording a lateral resolution of 1024 × 256 pixels at
a temporal resolution of 30 frames per second. An at-
taching virus manifests as a quickly appearing, faint
spot in this time-series of images (Figure 1, center).
On a per pixel level, this results in a step in the time
series of intensities (Figure 1, right), allowing to dis-
tinguish virus candidate pixels from non-virus pixels.
The PAMONO sensor detects variations in the thick-
ness of the material covering the sensor surface, thus
enabling detection of any type of object that can be
immobilized on that surface. Its high analytic sensi-
tivity comes at the cost of susceptibility to detecting
artifacts, caused e.g. by sensor jitter and air bubbles,
which have to be sorted out by classification, cf. Sec-
tion 2. Details on the physics behind the sensor can
be found in the literature (Zybin and et al., 2010).
2 DATA ANALYSIS
This section sketches the existing pipeline for PA-
MONO data analysis (Siedhoff et al., 2011) and in-
troduces a new fuzzy virus detection algorithm (cf.
Section 2.1). This algorithm can replace the existing
detection based on hard thresholding. Comparative
results are given in Section 4.
The intended use-cases of the PAMONO biosen-
sor demand for an automated data analysis that can be
carried out in real-time. The large amount of data and
the demand for online visualization and diagnosis ne-
cessitate stream processing. An analysis pipeline re-
alizing these concepts will be summarized now. On a
high-level, this pipeline (cf. Figure 2) consists of four
steps: A preprocessing step denoises the images to re-
move Poisson- and other noise inherent to the sensor
setup. To this end, a wavelet denoising filter (Mitter-
mayr et al., 1996) is used. The second step identi-
fies virus candidate pixels by examining the per-pixel
time-series of intensities. A pattern matching algo-
rithm compares the observed time-series (Figure 1,
right) to the model patterns, given as variations of an
ideal step function. Translational differences on the
time axis are handled by a sliding window. Step three
aggregates sets of contiguous virus candidate pixels
to polygons, using the Marching Squares algorithm.
Finally, step four serves to distinguish detections of
actual viruses from artifacts (false positives). To this
end, form factors are computed from the polygons
which are then used as features in an automatic clas-
sification, separating viruses from artifacts.
In order to achieve real-time capability and en-
ergy efficiency on a mobile device, the entire analy-
sis pipeline is implemented using a GPGPU approach
(Timm et al., 2011a).
2.1 Fuzzy Detection
Pattern matching of per pixel time-series is a cru-
cial part in the detection pipeline (Figure 2): Pixels
covered by the surface plasmon resonance effect of a
virus adhesion can be identified by inspecting their
time-series of intensities. Time-series of pixels af-
fected by a virus adhesion exhibit a characteristic step
function pattern, while those of unaffected pixels con-
tain only noise (cf. Figure 1, right). To find virus can-
didate pixels, the observed time-series are matched
to an ideal model pattern. The task of the follow-
ing fuzzy detection algorithm is to turn the resulting
matching scores into a robust classification that elimi-
nates false positives and integrates spatial information
BIOSIGNALS2013-InternationalConferenceonBio-inspiredSystemsandSignalProcessing
170
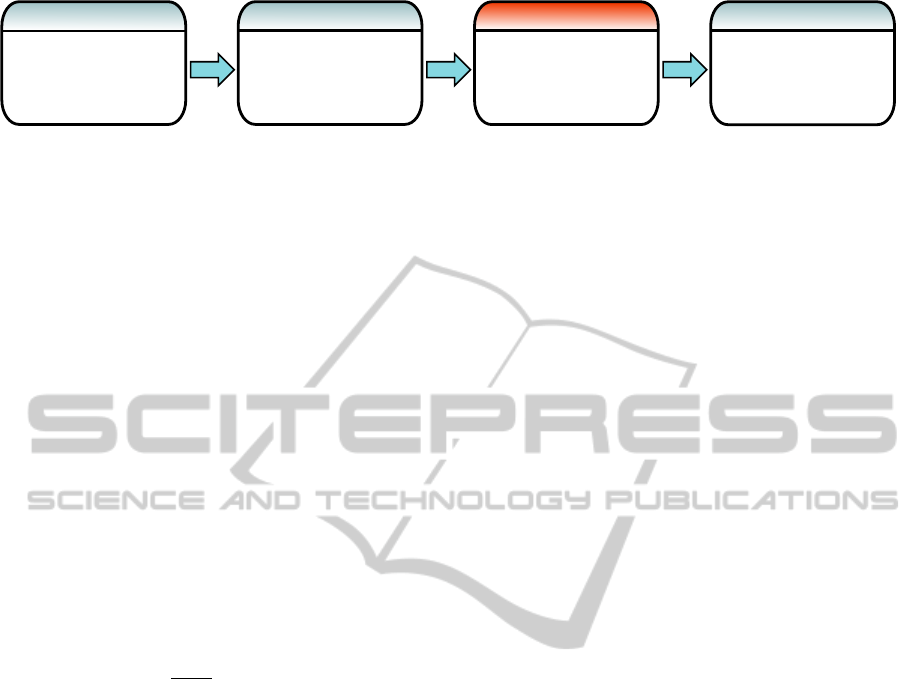
Classification
Fuzzy Detection
Pattern Matching
Preprocessing
Wavelet denoising
Per-pixel time-series
analysis yielding virus
candidacy scores
Separating virus
candidate pixels from
nonvirus pixels by
fuzzy rules on scores
Eliminating false
positives by regarding
shapes of contiguous
sets of candidates
Figure 2: GPGPU Processing pipeline for biosensor data analysis in real-time.
by taking neighboring matches into account.
Let D(x,y,t) be the matching score returned by the
pattern matcher at spatial position x, y on the t-th im-
age of the time-series of images provided by the sen-
sor. The task is to decide, on the basis of D, whether
or not pixel x, y,t is affected by a virus adhesion. In-
stead of taking a binary decision (like in hard thresh-
olding), fuzzy detection assigns to each pixel a degree
of membership to one or more fuzzy sets. The range
of the membership functions for each set is [0,1]. Un-
like probabilities, degrees of set membership can sum
to values larger or smaller than 1. For the PAMONO
application, fuzzy sets are used to distinguish four dif-
ferent classes, named “virus”, “background”, “noise”
and “artifact”. Our approach extends (M
´
elange and
et al., 2011) to the field of detection enhancement.
In a fuzzification step, each matching score
d
=
D(x,y,t) ∈ R
≥0
is mapped to the fuzzy set µ
step
with
range [0,1], using the soft thresholds 0 ≤ π
1
< π
2
:
µ
π
1
,π
2
step
(d) =
1 for d ≥ π
2
d−π
1
π
2
−π
1
for π
1
< d < π
2
0 else
. (1)
This fuzzy set indicates similarity of the observed
time-series to the model step function. As step-
function-like time-series are caused by viruses, equa-
tion (1) describes membership to the fuzzy set
of pixels affected by viruses. By using addi-
tional application-specific fuzzy rules, further domain
knowledge about the structure of virus adhesions can
be incorporated. Three examples of such rules are
given, after the required definitions have been made.
The 3D neighborhood set N of width w, height h
and length l, evaluated at spatio-temporal coordinates
x,y,t is defined as
N
x,y,t
w×h×l
:=
{
D(x + ˆx,y + ˆy,t +
ˆ
t)
}
with
ˆx ∈
{
⌈(w − 1)/2⌉, ...,⌊(w − 1)/2⌋
}
ˆy ∈
{
⌈(h − 1)/2⌉, ...,⌊(h − 1)/2⌋
}
ˆ
t ∈
{
⌈(l − 1)/2⌉, ...,⌊(l − 1)/2⌋
}
The k-th largest element r(k, S) in the set S with k ∈
{
1,.. . ,|S|
}
is defined as
r(k,S) := s
k
where s
1
≥ s
2
. . . ≥ s
k
≥ . . . s
|S|
.
Using these definitions and building upon the fuzzy
rule µ
π
1
,π
2
step
(d) from equation (1), a further rule for the
virus class can be stated. It aims at enhancing the
detection of pixels at the fringe of virus adhesions:
µ
π
1
,π
2
fringe
(d) = d > π
1
AND (2)
µ
π
1
,π
2
step
(r(15, N
x,y,t
7×7×3
)).
Here the fuzzy operator a AND b is defined as the
minimum min(a, b). This rule is motivated by the fact
that the magnitude of the surface plasmon resonance
effect decreases with distance. Thus the pixels at the
fringe of an adhesion can not be accounted for by hard
thresholding, due to their lower signal-to-noise ratio
causing a mediocre match, i.e. π
1
< d < π
2
. Equa-
tion (2) relaxes the issue by promoting pixels with
mediocre matching scores, if they reside in a neigh-
borhood with a sufficient number of virus pixels. This
is the case for pixels on the fringe. The assigned de-
gree of membership is determined from rank-ordered
matching scores of neighboring pixels.
The second fuzzy rule aims at synchronizing dif-
ferent temporal instances of the same virus detection:
µ
π
1
,π
2
temporal
(
d
) =
d
>
π
1
AND
(3)
µ
π
1
,π
2
step
(r(1, N
x,y,t
1×1×5
)).
Equations (1) to (3), together with five more rules
(omitted for brevity), characterize the class of virus-
affected pixels. There are further rules for the classes
“background”, “noise” and “artifact”. As an example,
a rule for the background class is given as:
µ
π
1
,π
2
background
(d) = d < π
2
AND (4)
NOT µ
π
1
,π
2
step
(r(10, N
x,y,t
7×7×3
)).
The fuzzy operator NOT a is defined as 1 − a for
fuzzy arguments a. This rule states that background
pixels have matching scores smaller than π
2
and that
their degree of membership to the background in-
creases, depending on its neighborhood: The smaller
the membership of the 10th best neighboring match-
ing score to the set from equation (1), the larger the
membership to the background class.
In a final defuzzification step, all set memberships
are converted into a crisp decision classifying the pix-
els. As the ratio between the virus class and the other
Fuzzy-enhanced,Real-timeCapableDetectionofBiologicalVirusesusingaPortableBiosensor
171
classes is unknown, the crisp decision is made by
choosing the label of the class with the highest degree
of set membership.
With the goal of real-time capability, the algo-
rithm has been parallelized on the GPU: Images and
detections are stored in a ring buffer. As the rank
function r(k,S) is used by multiple fuzzy rules, the set
S is partially sorted to the point where all rank queries
can be answered in constant time. Global memory
accesses have been minimized by exploiting the lo-
cal memory on the GPU. For a spatio-temporal neigh-
borhood of width w, height h and length l, evaluated
on images of size w
img
× h
img
, the number of global
memory accesses for processing one image amounts
to w
img
· h
img
· w · h · l, if no local memory was used.
On the GPU, each local workgroup of size w
grp
×h
grp
has a shared local memory which can be used as a
manual cache. By doing so, the number of global
memory accesses per analyzed image is reduced to
(⌈w
img
/w
grp
⌉ · ⌈h
img
/h
grp
⌉) · (w
grp
+ w − 1) · (h
grp
+
h − 1) · l.
As an example, a typical task arising in practice is
analyzing time-series of 1024 × 256 images, using a
neighborhood size of 7 ×7× 3. If a workgroup size of
16 × 16 is used, caching in local memory reduces the
number of global memory accesses from 38,535,168
to 1,486, 848.
3 TOWARDS A PORTABLE VIRUS
DETECTION DEVICE
Portability of the virus detection device comprises
two major aspects: Firstly, the sensor must be made
mobile, as briefly covered in Section 3.1. Secondly, it
must be verified that the analysis pipeline is suitable
for the resource-constrained computing environment
imposed by portable computers, which will be the fo-
cus of the experiment description in Section 3.2 and
of the results presented in Section 4.
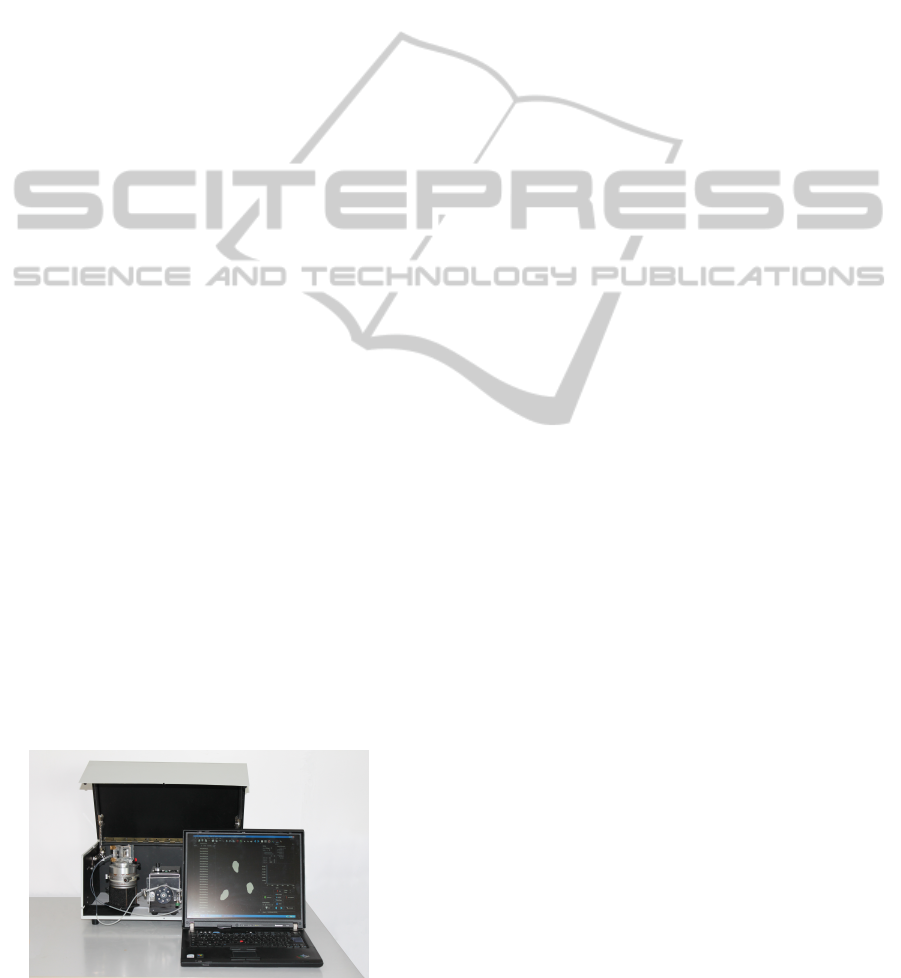
Figure 3: The portable virus detection unit.
3.1 Portable PAMONO Sensor
By design, the PAMONO sensor is a small device,
consisting of four major components:
• a gold-layer mounted on a prism,
• a superluminescent diode for illumination,
• a pump circulating a liquid with the specimen and
• a CCD camera to acquire the images.
Battery-driven operation of the components is possi-
ble and they all fit into a portable case (Figure 3).
3.2 Portable Real-time Data Analysis
The second challenge in creating a portable virus de-
tection device lies in conducting the computationally
demanding analysis of the sensor data in real-time,
while being subject to the resource constraints im-
posed by portable computers. The two major con-
straints are limited processing speed and energy con-
sumption. The focus of this work lies on verifying
the real-time capability of the analysis pipeline when
moving from desktop to laptop computers. Minimiza-
tion of its energy consumption by means of design
space explorations (Timm et al., 2011b) has been con-
ducted previously.
The questions to be answered by the experiments
in Section 4 are as follows: In how far does virus
detection performance benefit from using fuzzy rules
instead of hard thresholds? Can the virus detection
pipeline achieve real-time performance on a portable
computer? What is the speedup of GPGPU? Is a state-
of-the-art CPU sufficient for real-time capability?
These questions are answered empirically by ex-
ecuting virus detection tasks in a controlled environ-
ment. Details of the experimental setup are as fol-
lows: The frame rates attained by a desktop system
(Intel Core i7 2600, Nvidia GeForce GTX 480 1GB,
respectively Nvidia GeForce GTX 560 Ti 2GB) were
compared to those of a laptop system (Intel Core i7
620M, Nvidia Quadro NVS 3100M 256MB, Battery
Capacity 8.4Ah at 11.1V). For both systems, the anal-
ysis pipeline was run on CPU and GPU. The size of
the images and the number of viruses were gradually
increased by repeating a prerecorded 64 × 64 × 160
pixel tile along the x- and y-axes. The examined im-
age sizes are 1024 pixels in x-direction and 128, 256,
512 and 1024 pixels in y-direction. For each combi-
nation of desktop/laptop and CPU/GPU it was investi-
gated which image sizes cause a violation of the real-
time condition. This determines the processing hard-
ware that is capable of real-time performance. For
the laptop system, energy consumption was recorded
for the runs on CPU and GPU by utilizing the battery
status information in the sysfs of Linux.
BIOSIGNALS2013-InternationalConferenceonBio-inspiredSystemsandSignalProcessing
172

Table 1: Positive agreement (PA) for fuzzy and non-fuzzy
detection as attained for different sources of noise and at-
tenuation factors of the virus signal.
Noise Signal Non-fuzzy Fuzzy
Source Attenuation PA PA
Poisson 1.00 0.995 1.000
Poisson 0.75 0.975 0.979
Poisson 0.50 0.761 0.828
Sensor 1.00 0.917 0.970
Sensor 0.75 0.801 0.873
Sensor 0.50 0.518 0.593
4 RESULTS
The obtained results divide into measurements of
fuzzy detection performance (Section 4.1) and verify-
ing the real-time capability of the overall data analysis
pipeline on a mobile device (Section 4.2).
4.1 Fuzzy Detection Results
The fuzzy detection algorithm was compared to a
non-fuzzy implementation (Timm et al., 2011a) in
order to assess its merit. Data-driven synthesis was
used to transform real datasets into new datasets for
which ground-truth detection results are known. Pos-
itive agreement (PA) (Cicchetti and Feinstein, 1990)
between ground-truth and detected viruses was used
to measure performance. This choice is motivated by
the fact that it penalizes false positives and negatives,
both of which are equally undesirable in this context.
PA is used as a single omnibus index here, i.e. the
corresponding negative agreement is ignored because
the notion of true negatives in not defined this con-
text: A true negative would be an area not marked as
a virus, neither in the ground-truth, nor in the detec-
tion results. Such areas do not relate to discrete events
on the sensor surface and thus can not be counted.
Suitable parameters for the fuzzy and non-fuzzy
detector were found by optimizing PA by means of a
genetic algorithm (GA). This was done for two types
of datasets: The facile datasets were constructed by
synthesizing real-data-based virus instances on a syn-
thetic Poisson noise background. The more chal-
lenging datasets use real sensor data as the source of
noise. This sensor data contains no viruses but be-
sides Poisson noise it includes several further degra-
dations incurred during image acquisition, such as re-
sulting from concussions of the sensor, dust and air
bubbles in the buffer solution. Different attenuations
of the ground-truth virus signal were added to these
two types of noise signal: The virus intensities were
multiplied by 1, 0.75 and 0.5, respectively. This sim-
ulates decreasing virus sizes because the diameter of
a virus linearly affects the observed virus signal inten-
sity (Zybin and et al., 2010).
Table 1 shows positive agreement (PA) for non-
fuzzy and fuzzy detection after GA-based parame-
ter optimization. Fuzzy detection increases PA in all
cases. The facile datasets (in the first two lines) do not
benefit much from fuzzy detection because the signal-
to-noise ratio is high enough to make non-fuzzy de-
tection succeed. For halved signal intensity, fuzzy de-
tection raises positive agreement from 0.761 to 0.828
for the Poisson-noise dataset and from 0.518 to 0.593
for the sensor-noise dataset. It thus enables more re-
liable detection of smaller viruses. The average im-
provement for the sensor-noise datasets amounts to
7 percentage points. Using fuzzy rules in a spatio-
temporal neighborhood is a suitable approach be-
cause it enables lower thresholds (virus areas are more
fully covered and noise-corrupted boundaries can be
closed) without adversely affecting the detector’s sus-
ceptibility to noise (false positive pixels due to noise
do not form contiguous islands).
4.2 Verifying Real-time Capability
The camera used in the PAMONO biosensor captures
30 frames per second, thus defining real-time capabil-
ity as processing 30 or more frames per second (fps).
Artificially limiting the temporal resolution to relax
the real-time constraint adversely affects detection ro-
bustness and is thus not an option. Table 2 shows that
both examined state-of-the-art CPUs violate the real-
time constraint for all image sizes – including the im-
age size of 1024 × 256 pixels, which is the size that
occurs in practice. To meet the real-time constraint,
it is necessary to utilize the GPU. The mobile GPU is
a low-cost model with 16 streaming processors. As
shown in the table, it attains 32.6 fps for 1024 × 256
images, thus meeting the real-time constraint. Larger
images can be processed in real-time if GPUs with
more than 16 streaming processors are used, like the
desktop GPUs. For the laptop computer, the average
speed-up between GPU and CPU amounts to ≈ 3.6x.
Furthermore, using the GPU instead of the CPU re-
duces energy consumption of the overall system by a
factor of ≈ 3.7x. While processing one 1024 × 256
image on the GPU uses 1.56J, the CPU consumes
5.84J (1024 × 512: 2.76J (GPU), 10.52J (CPU) and
1024 × 128: 0.93J (GPU), 3.26J (CPU)).
Table 2 furthermore shows that the employed
streaming algorithms scale almost perfectly since im-
ages with half the size are processed twice as fast.
This linearity seemingly does not hold for the frame
rates attained by the desktop GPUs. The reason is that
Fuzzy-enhanced,Real-timeCapableDetectionofBiologicalVirusesusingaPortableBiosensor
173

Table 2: Frame rates attained for different image sizes and different devices.
Frames per second (fps)
Image size in pixels
1024 × 128 1024 × 256 1024 × 512 1024 × 1024
Desktop
CPU: i7-2600 23 20.1 16.1 11.5
GPU: GTX 560 Ti 60 60 60 26.8
GPU: GTX 480 60 60 60 40.3
Laptop
CPU: 620M 16 8.5 4.6 2.4
GPU: 3100M 60 32.6 16 7.8
the frame rates are capped at the screen refresh rate
(60 Hz). It is not a limitation incurred by the utilized
algorithms.
In summary, it was shown that using our fuzzy algo-
rithm is beneficial for detecting viruses in PAMONO
data: It increases positive agreement of the detection
results to synthetic ground-truth data. The algorithm,
along with the remainder of the processing pipeline,
achieves real-time performance on a portable device.
The utilization of GPGPU techniques is mandatory
because state-of-the art CPUs do not provide suffi-
cient processing power to satisfy the real-time con-
straint. Using the GPU furthermore saves energy.
5 DISCUSSION
With the increasing global spread of human viral in-
fections and the emergence of highly virulent norovi-
ral strains, the availability of fast, reliable and inex-
pensive methods for virus detection is urgently nec-
essary for screening at e.g. airports or in crisis ar-
eas. The proposed “Portable PAMONO Unit” ful-
fills these requirements. The unit consists of a small
case containing the novel PAMONO biosensor and of
an off-the-shelf laptop computer running specialized
signal analysis software. Besides allowing for ubiqui-
tous availability of virus detection, it accelerates diag-
noses because results are produced in real-time while
viruses attach to the sensor surface.
Future research aims at a further miniaturization
of the “Portable PAMONO Unit” and at running real-
time data analysis on tablet computers and smart
phones. Due to their low cost, a deployment of a large
number of cooperating “Portable PAMONO Units” is
conceivable. A network of such units allows for draw-
ing conclusions about the large-scale propagative be-
havior of pathogens in the human environment.
ACKNOWLEDGEMENTS
Part of the work on this paper has been supported
by Deutsche Forschungsgemeinschaft (DFG) within
the Collaborative Research Center SFB 876 “Provid-
ing Information by Resource-Constrained Analysis”,
project B2. URL: http://sfb876.tu-dortmund.de
REFERENCES
Abbe, E. (1873). Beitr
¨
age zur Theorie des Mikroskops
und der mikroskopischen Wahrnehmung. Archiv f
¨
ur
Mikroskopische Anatomie, 9:413–418.
Cicchetti, D. V. and Feinstein, A. R. (1990). High agree-
ment but low kappa: II. Resolving the paradoxes.
Journal of Clinical Epidemiology, 43(6):551–558.
Erickson, D., Mandal, S., Yang, A., and Cordovez, B.
(2008). Optofluidic, Electrical and Mechanical Ap-
proaches to Biomolecular Detection at the Nanoscale.
Microfluid. Nanofluid., 4:33–52.
Mairhofer, J., Roppert, K., and Ertl, P. (2009). Microflu-
idic systems for pathogen sensing: A review. Sensors,
9(6):4804–4823.
M
´
elange, T. and et al. (2011). Fuzzy random impulse noise
removal from color image sequences. IEEE Transac-
tions on Image Processing, 20(4):959–970.
Mittermayr, C., Nikolov, S., Hutter, H., and Grasserbauer,
M. (1996). Wavelet denoising of Gaussian peaks:
A comparative study. Chemometrics and Intelligent
Laboratory Systems, 34(2):187–202.
Siedhoff, D., Weichert, F., Libuschewski, P., and Timm, C.
(2011). Detection and classification of nano-objects
in biosensor data. Microscopic Image Analysis with
Applications in Biology (MIAAB 2011).
Timm, C., Libuschewski, P., Siedhoff, D., Weichert, F.,
M
¨
uller, H., and Marwedel, P. (2011a). Improving
nanoobject detection in optical biosensor data. Proc.
5th International Symposium on Bio- and Medical In-
formation and Cybernetics (BMIC 2011), 2:236–240.
Timm, C., Weichert, F., Marwedel, P., and M
¨
uller, H.
(2011b). Design space exploration towards a realtime
and energy-aware GPGPU-based analysis of biosen-
sor data. Computer Science – Research and Develop-
ment, Springer, pages 1–9.
Weichert, F., Gaspar, M., Timm, C., Zybin, A., Gurevich,
E., Engel, M., M
¨
uller, H., and Marwedel, P. (2010).
Signal analysis and classification for surface plasmon
assisted microscopy of nanoobjects. Sensors and Ac-
tuators B: Chemical, Elsevier, 151:281–290.
Zybin, A. and et al. (2010). Real-time detection of single
immobilized nanoparticles by surface plasmon reso-
nance imaging. Plasmonics, 5:31–35.
BIOSIGNALS2013-InternationalConferenceonBio-inspiredSystemsandSignalProcessing
174
