
Bioimpedance Parameters as a Risk Factor to Assess Pine Decay
An Innovative Approach to the Diagnosis of Plant Diseases
E. Borges
1
, M. Sequeira
1
, André F. V. Cortez
1
, H. Catarina Pereira
1
, T. Pereira
1
, V. Almeida
1
,
T. M. Vasconcelos
2
, I. M. Duarte
2
, N. Nazaré
2
, J. Cardoso
1
and C. Correia
1
1
Instrumentation Center, Physics Department of the University of Coimbra, Rua Larga, Coimbra, Portugal
2
Centro de Estudos de Recursos Naturais Ambiente e Sociedade, Escola Superior Agrária de Coimbra
of the Instituto Politécnico de Coimbra, Bencanta, Coimbra, Portugal
Keywords: Electrical Impedance Spectroscopy, Bioimpedance, Early Detection, Physiological States, Pinewood
Disease, Pinewood Nematode, Plant Diseases, Hydric Stress, Pinus pinaster Aiton, Bursaphelenchus
xylophilus Nickle.
Abstract: Electrical impedance spectroscopy, EIS, has been proving efficacy and utility in a wide range of areas, from
the characterization of biological tissues to living organisms. Several commercial solutions, with high
precision and resolution, are available. Nonetheless, the typical equipments are expensive, unfeasible for in
vivo and in field applications and unspecific for concrete applications. These features, together with the
lately demands in the vegetal field, fundament this work. Actually, the fast spread of asymptomatic forest
diseases, with no cure available to date, such as the pinewood disease, PWD, constitute a problem of
economical and forestall huge proportions. Herein is proposed a portable EIS system, for biological
applications, able to perform AC current or voltage scans within a selectable frequency range. The
procedure and the results obtained for a population of 24 young pine trees (Pinus pinaster Aiton) are also
presented. Pine trees were kept in a controlled environment and were inoculated with the nematode
(Bursaphelenchus xylophilus Nickle), that causes the PWD, and also with bark beetles (Tomicus destruens
Wollaston). Some degree of discrimination between different physiological states was achieved. These
results may constitute a first innovative approach to the diagnosis of such types of diseases.
1 INTRODUCTION
Electrical impedance measurements performed in a
wide frequency range give rise to a great number of
techniques able to characterize solids, liquids and
suspensions (Callegaro, 2009). Lately, the method
has proved its value also in the characterization of
biological tissues and fluids, either in vitro or in vivo
(Callegaro, 2009), and also to living plants (Fukuma,
2001); (Repo et al., 2000); (Väinölä and Repo,
2000); (Bauchot et al., 2000), animals (Dean et al.,
2008); (Willis and Hobday, 2008) and humans (Kyle
et al., 2004); (Giouvanoudi and Spyrou, 2008).
Concerning the vegetal field, the applications of
electrical impedance spectroscopy, EIS, techniques
have been claiming significant and growing
acceptance, especially as a measure of the water
content in the quality control processes (Vozáry and
Mészáros, 2007); (Fukuma, 2001); (Pliquett, 2010)
of fruits (Fang et al., 2007) and vegetables (Hayashi
et al., 1992); (Dejmek and Miyawaki, 2002), as well
as in the monitoring of the maturation process of
fruits (Bauchot et al., 2000); (Harker and
Maindonald, 1994) and the physiological state of
living plants under adverse environmental conditions
(Repo et al., 2000); (Väinölä and Repo, 2000).
The electrical impedance of a biological
material, or simply bioimpedance, is a passive
electrical property that measures the opposition
relatively to an alternating current flow applied by
an external electric field. The current I, as it passes
across a section of a material of impedance Z, drops
the voltage V, established between two given points
of the same section, yielding the well-known
generalized Ohm’s law: V=IZ, where V and I are
complex scalars and Z is the complex impedance.
The law can be rewritten as V=I|Z|e
j
Ѳ
since, at a
given frequency, the current flow I lag the voltage V
by a phase of Ѳ (i.e. the current signal is shifted
(Ѳ/2π)T s to the right with respect to the voltage
35
Borges E., Sequeira M., F. V. Cortez A., Pereira H., Pereira T., Almeida V., M. Vasconcelos T., M. Duarte I., Nazaré N., Cardoso J. and Correia C..
Bioimpedance Parameter as a Risk Factor to Assess Pine Decay - An Innovative Approach to the Diagnosis of Plant Diseases .
DOI: 10.5220/0004230500350046
In Proceedings of the International Conference on Biomedical Electronics and Devices (BIODEVICES-2013), pages 35-46
ISBN: 978-989-8565-34-1
Copyright
c
2013 SCITEPRESS (Science and Technology Publications, Lda.)

signal, in the time domain). Hence, the result of the
EIS measurements is a set of complex (magnitude
and phase) of impedance versus frequency.
Cell membranes, intracellular fluid (cytosol) and
extracellular fluid are the major contributors of the
impedance of biological tissues (Kyle et al., 2004);
(Pliquett, 2010).The cytosol and the extracellular
fluid are mostly constituted by water, consist in
electrolytes, and act like ohmic resistors, while the
insulating membranes behave like capacitors (Kyle
et al., 2004); (Pliquett, 2010). It is, therefore,
possible to depict the behaviour of a biological
tissue by the representation of capacitive and
resistive elements of a respective equivalent
electrical circuit. A commonly used circuit to
represent biological tissues consists of a parallel
arrangement between a resistor, simulating the
extracellular fluid, and a second serial arrangement
connecting a resistor, this one of the cytosol, and a
capacitor, of the membrane (Kyle et al., 2004) - see
figure 1. Since the time constant for loading cell
membranes is typically of the order of the
microsecond (Pliquett, 2010), tissue impedance can
be measured in a frequency range up to tens of MHz
(Callegaro, 2009). In this range of frequencies the
membrane performs like an almost perfect capacitor,
allowing an estimation of the combined ohmic value
of the cytosol and the extracellular fluid. On the
other hand, using direct current level, DC, (low
frequency), the current does not cross the membrane
due to its insulator behaviour. This short circuit-like
actuation forces the current to flow exclusively
through the extracellular fluid providing, thus, a
measure of its ohmic value. However, due to
technical limitations and multiple dispersions (α
dispersions at low frequencies – tissues’ electrolyte
behaviour – and γ dispersions at very high
frequencies – tissues’ aqueous behaviour Ivorra,
2003), the usage of DC and very high frequency AC
currents is restricted (Kyle et al., 2004). Therefore, it
becomes quite more convenient to determine the
ohmic values by prediction. The model commonly
used to predict such values is the Cole bioimpedance
model, in which the bioimpedance spectra is
represented by means of a Cole-Cole plot (see figure
1), that explores resistance versus reactance,
allowing the determination of the ohmic values of
the cytosol and the extracellular fluid. The
mathematical expression descriptive of the Cole-
Cole plots is the Cole equation (here expressed has
in Grimnes and Martinsen, 2008):
∆
, ∆
(1)
Where Z is the impedance value at frequency ω
(with ω=2πf), Z
∞
is the impedance at infinite
frequency (high frequencies) (note: this term is
misleading and is replaced by an ideal resistor R
∞
), j
is the complex number, R
0
is the impedance at DC
frequency, τ is the characteristic time constant and α
is a dimensionless parameter with a value between 0
and 1.
Figure 1: Bode and Cole-Cole diagrams obtained by
simulation with Matlab® for an electrical circuit
representing a hypothetical biological tissue (right top of
the figure).
The relationship between reactance and
resistance, perceived in a Cole-Cole plot, expresses
the electrical properties of tissues. Diseases and
nutritional or hydration levels may change their
physiological state. These changes have direct
influence in the impedance spectra. The phase angle
and other interrelated indices, such as Z
0
/Z
∞
(Kyle et
al., 2004) and Z
0
/Z
50
(Hayashi et al., 1992), have
been used to extract information about the
physiological condition of biological materials. The
index Z
0
/Z
50
gains some significance since it is at the
50 kHz that the current starts passing through both
cytosol/membranes and extracellular fluid, although
10
-2
10
0
10
2
10
4
10
6
10
8
10
10
1
2
3
4
5
x 10
4
Frequency (Hz)
Module (Ohms)
10
-2
10
0
10
2
10
4
10
6
10
8
10
10
0
10
20
30
40
Frequency (Hz)
Phase Shift (º)
1.5 2 2.5 3 3.5 4 4.5
x 10
4
-5000
0
5000
10000
15000
20000
Resistance
Reactance
50
k
Ω
20
k
Ω
80
p
F
BIODEVICES2013-InternationalConferenceonBiomedicalElectronicsandDevices
36

the proportion varies from tissue to tissue (Kyle et
al., 2004).
The nature of the impedance excitation signal
varies depending on the application. It is possible to
excite the sample with a current and measure a
voltage or to do the exact opposite. The discussion
on what source, voltage or current, is the most
convenient remains. Current sources, CS, provide
suitably controlled means of current injection
(Rafiei-Naeini et al., 2007) and present reduced
noise due to spatial variation when compared with
voltage sources, VS (Ross et al., 2003). However,
CS accuracy decreases with high frequency (Yoo et
al., 2010), especially due to their output impedance
degradation (Ross et al., 2003). Since the impedance
measurements are limited to field strength where the
current is linear with respect to the voltage applied
(Pliquett, 2010), or vice-versa, CS need high-
precision components (Saulnier et al., 2006) and a
limited bandwidth operation range (Yoo et al., 2010,
Saulnier et al., 2006) to overcome the stated
limitation. On the other hand, VS, although
producing less optimal EIS systems (Saulnier et al.,
2006), can operate over a sufficient broad frequency
range (Yoo et al., 2010); (Saulnier et al., 2006) and
are built with less expensive components (Saulnier
et al., 2006).
Nowadays, instruments with high precision, high
resolution and frequency ranges extending from
some Hz to tens of MHz are commercially available
(Callegaro, 2009). However, in what concerns to the
range of low or high frequencies (already above 100
kHz), the degradation of the excitation signal affects
the accuracy of the measurements (Callegaro, 2009).
Besides, the typical solutions consist in impedance
analyzers and LCR meters which are desktop
instruments (Callegaro, 2009), unfeasible for in vivo
(Callegaro, 2009) and in field applications.
Those EIS features, together with the lately
demand in the vegetal applications, fundament this
work. In fact, there are several plant pest and
diseases affecting different cultures of huge
economic and forestall importance, not only in our
country but also around the world. This is the case of
esca disease in vineyard, ink disease in chestnuts or
pinewood disease, PWD, and bark beetles in pinus
stands, among others. It is known that PWD, the
case study presented in this paper, is caused by the
nematode Bursaphelenchus xylophilus Nickle, that is
housed in the tracheas of pine sawyer Monochamus
galloprovincialis Olivier. Bark beetles in general
and pine shoot beetle (Tomicus destruens
Wollaston), in particular, play an important role in
nematode establishment since they are responsible
of pine decay, condition required for M.
galloprovincialis oviposition. The PWD disease
leads to a rotting process from within the plant
(therefore, inside the stem) so that symptoms are
difficult to see from the outside. Furthermore, there
is still no cure available and the only solution to
discontinue the progress of the disease throughout
the culture is to identify and isolate the specimens
that seem to have contracted the disease.
The authors propose a portable EIS system able
to perform AC scans within a selectable frequency
range. The system implements the phase sensitive
detection, PSD, method and can drive either a
current or a voltage signal to excite a biological
sample in field or in vivo. The instrumentation was
designed to be cost-effective and usable in several
applications.
The design specifications are listed in Table I.
Table 1: Summary of specifications of the EIS system.
Range
Parameter Current Mode Voltage Mode
Measuring method 2 electrodes
Frequency 1 kHz to 1 MHz
Signal amplitude 25 uA 4.6 V
Impedance magnitude 100 Ω to
100 kΩ
1
1.5k Ω to
2.2 MΩ
1
Impedance phase -π rad to π rad -π rad to π rad
Mean absolute magnitude error 1675.45 Ω 709.37 Ω
Mean absolute phase error 2.45 % 2.06 %
Mean distortion 0.29 % 0.48 %
Mean SNR 117.0 dB 118.8 dB
Calibration Automatically calibrated by
software
A first interesting case study is presented for a
population of 24 young pine trees (Pinus pinaster
Aiton), from a controlled environment. Pine trees
were inoculated with the nematode that causes the
PWD and also with bark beetles (T. destruens
Wollaston).
2 SYSTEM DESIGN
2.1 General Description
The developed EIS system employs two electrodes
and consists of three main modules: signal
conditioning unit, acquisition system (PicoScope®
3205A) and a laptop for data processing (Matlab®
based software), as figure 2 depicts. There were built
two different versions: one OEM for lab studies and
another miniaturized version for field acquisitions.
The electrodes being used are beryllium cooper
gold platted needles with around 1.02 mm in
BioimpedanceParameterasaRiskFactortoAssessPineDecay-AnInnovativeApproachtotheDiagnosisofPlant
Diseases
37
diameter. The bioimpedance measurement requires
the most superficial possible penetration of the
electrodes in order to reduce the dispersion of the
needles surface current density (Grimnes and
Martinsen, 2008), and also to reduce damage on the
biologic sample.
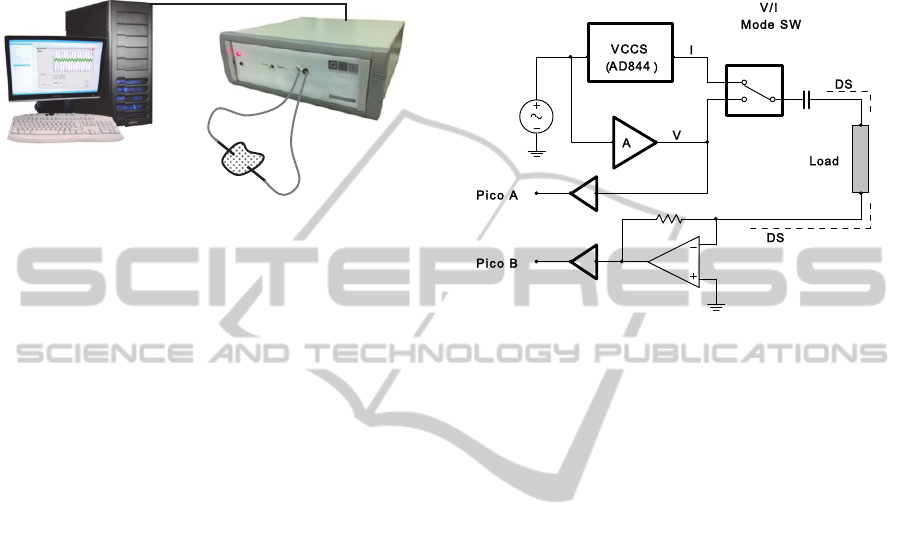
Figure 2: Schematics of the EIS OEM system – 1)
Biologic sample; 2) electrodes; 3) short coaxial cables; 4)
EIS system conditioning unit and acquisition system, with
the Picoscope®3205A incorporated; 5) laptop/PC.
The digital oscilloscope PicoScope® 3205A has
dual functionality: 1) synthesizes and provides the
excitation AC signal to the conditioning unit (ADC
function); 2) digitizes both excitation and induction
signals at high sampling rates (12.5 MSps) and
transfers data to the computer via USB where it is
stored. The signal conditioning unit receives the
exciting AC signal, coming from the PicoScope®,
and amplifies it to be applied, through an electrode,
to the specimen under study. The induced AC signal
is collected by a second electrode and is redirected
to the conditioning unit where it is also amplified.
Both excitation and induced signals are conduced to
the PicoScope® to be digitized.
It is also important to remark that the
conditioning unit has an external switch that allows
the user to select the mode type of excitation: by AC
current or AC voltage. As previously mentioned, it
is more advantageous to choose a mode of excitation
over another, depending on the type of application.
The features of both excitation modes are
described below.
2.2 Design Specifications
The current mode circuit employs the current-
feedback amplifier AD844 in a non-inverting ac-
coupled CS configuration (see figure 3), already
studied by Seoane et al., 2006.
A common problem inherent to bioimpedance
measurements is the charging of the dc-blocking
capacitor between the source and the electrode due
to residual DC currents (Seoane et al., 2006). This
effect lead to saturation of the transimpedance
output of the AD844. The DC feedback of the
implemented configuration maintains dc voltage at
the output close to 0V without reducing the output
impedance of the source. Subsequently, the output
current, is maintained almost constant over a wide
range of frequencies.
Figure 3: Schematic of the EIS system conditioning unit -
1) AC current source; 2) AC voltage source; 3)
current/voltage sense.
The high speed voltage-feedback amplifier
LM7171 is employed in the voltage mode circuit
(see figure 3). This behaves like a current-feedback
amplifier due to its high slew rate, wide unit-gain
bandwidth and low current consumption.
Nevertheless it can be applied in all traditional
voltage-feedback amplifier configurations, as the
one used. These characteristics allow the
maintenance of an almost constant voltage output
over a wide range of frequencies.
Current or voltage signals resulting from voltage
or current excitation modes, respectively, are sensed
by a high speed operational amplifier, LT1220 (see
figure 3), which performs reduced input offset
voltage and is able of driving large capacitive loads.
Gain values of both current excitation source and
voltage excitation source can be changed in order to
extend the range of impedance magnitude. The
transductance gain of the LT1220 is currently set to
5.1 kΩ and defines the gain of the system. Since the
gain values are known and also the amplitude of the
AC excitation signal, V
sin
, from the PicoScope®, the
EIS system is calibrated automatically by software.
2.3 Cables Capacitance
The characteristics of the cables that connect
between the conditioning unit and the sample under
study are also crucial. For an optimized signal-to-
noise ratio, coaxial cable must be used.
V1
LT1220
RS
C
1)
2)
3)
1
2
3
4
5
BIODEVICES2013-InternationalConferenceonBiomedicalElectronicsandDevices
38
Nevertheless, this type of cable is prone to introduce
high equivalent parasitic capacitances, which
translate in errors in the bioimpedance
measurements, especially at high frequencies. To
overcome this effect, the employed RG174 RF
coaxial cables (capacitance of 100 pF.m-1) are as
short as possible (around 15cm). It was also
implemented a driven shield technique to the coaxial
cables, which permits to partially cancel the
capacitive effect, that otherwise is generated
between the internal and the external conductors, by
putting both at the same voltage (Yamamoto et al,
1985). Reductions in the capacitive effect of 20.4%,
in the current mode, and around 35.8%, in the
voltage mode, at the highest frequencies are verified.
Figure 4 depicts the capacitive effect reduction by
the usage of the driven shield technique.
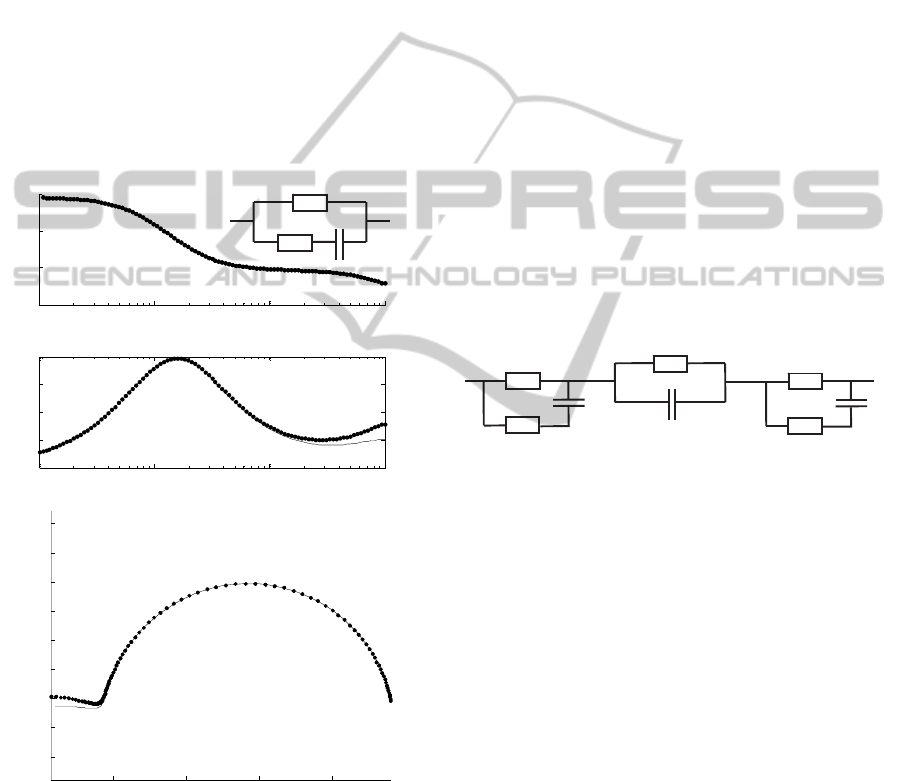
Figure 4: Bode and Cole-Cole diagram showing the
reduction of cables capacitive effect by the application of
the driven shield technique. The voltage mode excitation
was used to analyze the circuit at the right top. The
reduction is more noticeable at high frequencies where the
capacitive effects have more influence.
When assessing bioimpedance, the capacitive
effects from cables are not the only exerting
influence. In fact, phase shift effects, perceptible
especially in the high frequencies range, are
introduced mainly by the amplifiers. The influence
of phase shift errors has a cumulative effect that is
translated, in the impedance spectra, as an inflexion
that occurs at high frequencies (see figure 4).
This behaviour can be simulated by an
equivalent circuit as it is like the system analyzes
any load always in parallel with a capacitor.
The impedance magnitude, at high frequencies,
is also affected. It presents a characteristic decline as
the bode diagrams of the figure 4 show. In the
developed EIS system, the slight decline of the
impedance magnitude is due to the loss of the
product gain-bandwidth of the LT1220 for high
frequencies.
Since stray capacitances are considered
systematic errors of the system, thus affecting all the
measurements, theirs influence doesn’t directly
affect the results. Although, it is convenient to have
an approached sense of the real equivalent circuit
(see figure 5), in such a way that the effect of all the
parasitic elements can be considered and/or
discounted where justified.
Figure 5: Equivalent electric circuit of all parasitic
elements affecting impedance measurements of a load,
Z
LOAD
. The effect of the stray capacitances from cables,
C
CABLE
, is minimized by the driven shield. Other stray
capacitance effect, C
STRAY
, due primarily to the phase shift
of amplifiers, can be minimized by software.
3 SOFTWARE AND ANALYSIS
PROCESSING
3.1 General Specifications
The software interface, developed with Matlab®
tools, allows the operator to choose the parameters
of the bioimpedance analysis and to monitor the data
acquisition. The operator can perform an analysis for
one specific frequency or alternatively can carry out
a true bioimpedance spectroscopy. These two
software functioning modes can be programmed for
continuous monitoring, where the number of
acquisitions and the intervals between them are
specified by the user. The interface includes a basic
function that allows a preview of the Bode and Cole-
10
3
10
4
10
5
10
6
1
2
3
4
x 10
4
Module (Ohms)
Frequency (kHz)
10
3
10
4
10
5
10
6
0
5
10
15
20
Phase Shift (º)
Frequency (kHz)
2 2.5 3 3.5
x 10
4
-2000
0
2000
4000
6000
8000
10000
12000
14000
Reactance
Resistance
R
CABLE
Z
LOAD
C
CABLE
C
STRAY
R
CABLE
R
CABLE
R
CABLE
C
CABLE
39
k
Ω
39
k
Ω
180
p
F
BioimpedanceParameterasaRiskFactortoAssessPineDecay-AnInnovativeApproachtotheDiagnosisofPlant
Diseases
39

Cole diagrams of the acquired data. Bioimpedance
*txt or *mat files are saved in a pre-determined
directory with a filename, previously chose by the
user, to which date and time are associated. Each file
contains information about magnitude, phase shift
and real and imaginary parts of the measured
impedance, for each frequency.
The type of bioimpedance spectroscopy
implemented consists in a frequency AC sweep,
whose limit values are 1 kHz and 1 MHz.
Notwithstanding, the software allows the operator to
choose other frequency limits, as well as the number
of intervals between them. In addition, it can be
choose a linear or logarithmic analysis. Therefore,
the frequencies, f(i), over which the impedance of a
sample is analysed, are determined by the following
equations:
For a linear analysis:
f
i
f_starti∗
f_stopf_start
n1
,
∀i⊂
0,n1
∧n∈N
(2)
For a logarithmic analysis:
f
i
f_start∗10
_
_
,
∀i⊂
0,n1
∧n∈N
(3)
Where f_star and f_stop are, respectively, the first
and final frequencies of the AC sweep, and n the
number of intervals between them.
3.2 PSD Method
To assess the impedance phase shift it is
implemented a digital Phase Sensitive Detection,
PSD, method with a novel implication. As stated in
the literature, the PSD method is a quadrature
demodulation technique that implements a coherent
phase demodulation of two reference (matched in
phase and quadrature) signals (He et al, 2008);
(Dobrev et al., 2008). It is also known that this
method is preferable over others especially when
signals are affected by noise (Dobrev et al., 2008).
The signal from the Picoscope® that corresponds
to the current, V
I
=Bsin(ωt+φ
2
), is set as the
reference signal. Since the phase of the signal V
I
is
not controlled, it is easily understandable that it
doesn’t necessarily contain a null phase. This
statement remains valid whether V
I
is used to excite
the sample, in the current mode, or whether it
corresponds to the current passing through the
sample, in the voltage mode. The signal from the
Picoscope® that corresponds to the voltage, V
V
=A
sin(ωt+φ
1
), also contains a non-null phase. Both
amplitudes, A and B, are also different from each
other and none equals to 1.
The developed PSD algorithm was tested with
Matlab® for several phases and amplitudes without
the theoretical requirements (i.e., ensure that the
reference signal has null phase at the origin and that
its amplitude equals to 1 (He et al., 2008)). For all of
them it was showed an always corrected phase shift
assessment, when compared to the results obtained
for a reference signal with the theoretical
characteristics.
In addition, the mathematical resolution for the
demodulation of two signals with non-null phases
and amplitudes not equal to 1, corresponds to the
phase difference between both signals. The
following mathematical demonstration and the
schematic block diagram (shown in figure 6) support
the results obtained with the simulation.
Assuming that the analog input signals V
V
(t) and
V
I
(t) are sine waves of frequency f, amplitude A and
B, respectively, and initial phase φ
1
and φ
2
,
respectively:
V
t
Asin2π
f
φ
(4)
V
t
Bsin2π
f
φ
(5)
The digitized input signals V
V
(n) and V
I
(n) are
obtained from V
V
(t) and V
I
(t), respectively, by
sampling at a frequency f
s
, where f
s
is a multiple of
the f:
V
n
Asin
2πfn
f
φ
,n∈0,N1
(6)
V
n
Bsin
2πfn
f
φ
,n∈0,N1
(7)
Where N is the number of samples. N/f
s
is the
measurement time and must be an exact multiple of
1/f, so that there is whole number of cycles of the
sine wave.
Figure 6: Schematic of Phase-sensitive Demodulator
implemented in the EIS system.
1
∑
1
∑
2/
1
PicoscopeCh.B
2/
2
PicoscopeCh.A
2/
2
PicoscopeChannelAshifted90º
2
cos
1
2
2
sin
1
2
BIODEVICES2013-InternationalConferenceonBiomedicalElectronicsandDevices
40
The signal V
I
(n) is set as reference. The
quadrature reference signal, V
Iq
(n), results from the
reference signal shifted by a phase of 90º.
Consequently, V
Iq
(n) is cosine with the same
frequency, amplitude and initial phase as V
V
(n):
V
n
Bsin
2πfn
f
φ
,n∈0,N1
(8)
V
n
Bcos
2πfn
f
φ
,n∈0,N1
(9)
The output voltages of the system shown at figure 6
are:
V
1
N
V
n
V
n
(10)
V
1
N
V
n
V
n
(11)
The multiplication between two sine signals, with
the same frequency, results in a sum of a DC signal
and a sine signal with a frequency that is the double
of the original. The double frequency component
can be suppressed since the time is a multiple of the
period of the input sine signal. Therefore, it remains
only the DC component which amplitude is
dependent on the amplitude of the individual sine
signals and their relative phase:
V
AB
2
cosφ
φ
(12)
V
AB
2
sinφ
φ
(13)
From the expressions above, the resulting amplitude
and phase can be determined:
φ
φ
arctan
V
V
(14)
A
2
B
V
V
(15)
The determined phase is actually a phase difference
between the demodulated signal, V
V
and the
reference signal, V
I
, i.e., it corresponds to the phase
difference between voltage and current signals.
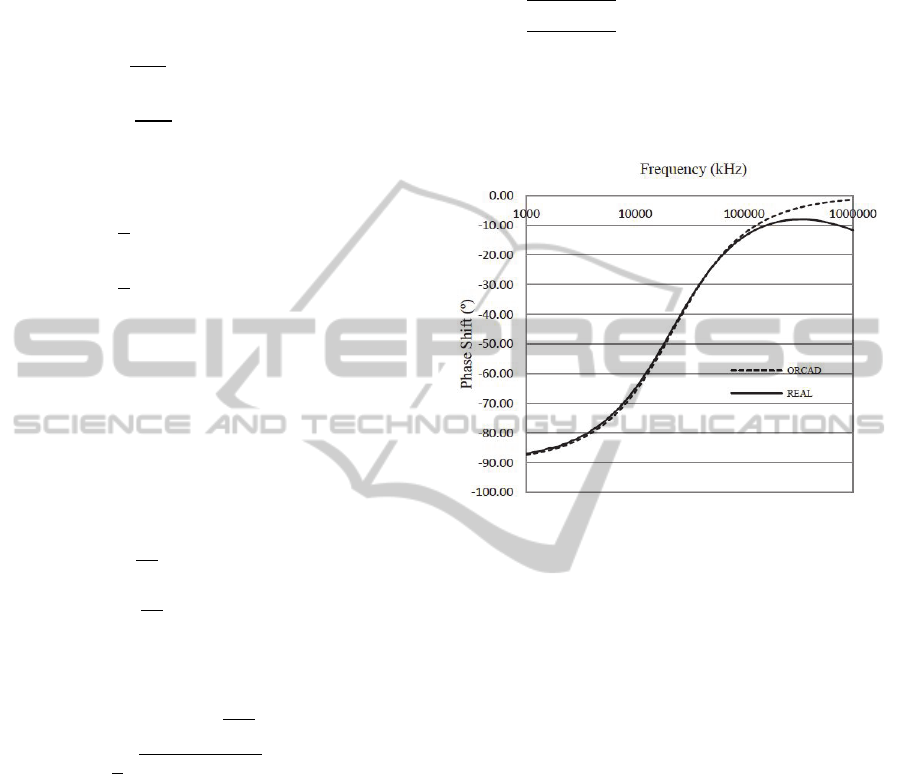
Figure 7 shows the consistence of the algorithm
when the impedance phase of a real data is
compared with a spice simulation in Cadence®.
The determination of impedance magnitude
cannot be achieved by the PSD method, since the
amplitude equation (equation 15) shows a
dependence on the amplitude of the reference signal,
which, in this case, is not equal to 1. Hence, to
assess amplitude, the EIS system algorithm
processes the root mean square, RMS, of both
signals V
V
(t)and V
I
(t) from de channel B and A,
respectively, of the Picoscope®. In this manner, the
impedance magnitude is given by the ratio between
the RMS value of the signal V
V
(t) and the rms value
of the signal V
I
(t):
|
|
∑
∑
, ∀∈0,1
(16)
Where Gain is the EIS system gain defined by the
transconductance gain of the LT1220 (see section
2.2).
Figure 7: Comparison between impedance phase of a real
data and Cadence® simulated data for a RC circuit. The
deviation that occurs between the graphics, at high
frequencies, is due to the influence of stray capacitances
(see section 2).
4 BIOLOGIC APPLICATION
STUDY
4.1 Materials and Methods
Twenty four young healthy pine trees (Pinus
pinaster Aiton), with about 2,5 meters tall and 2 to 3
centimetres in diameter, constituted the population
for the conducted study. The pine trees were placed
in vases in a controlled water environment at a
greenhouse. Half of the tree population was watered
during 5 minutes per day (~ 133,37 mL/day), while
the other half were watered during only 2 minutes
per day (~ 66,67 mL/day). This second half was less
watered to maintain a relevant level of hydric stress.
After one month elapsed since the pine trees
were placed in the greenhouse, the inoculations with
pinewood nematode, PWN, (Bursaphelenchus
xylophilus Nickle) and with the bark beetle (T.
destruens Wollaston) were performed. Six pines
were inoculated with PWN, other 6 pines were
BioimpedanceParameterasaRiskFactortoAssessPineDecay-AnInnovativeApproachtotheDiagnosisofPlant
Diseases
41

inoculated with bark beetles, other 6 pines were
inoculated simultaneously with PWN and bark
beetles, while the remaining 6 were kept under
normal conditions, i.e., healthy. The position of the
pines in the greenhouse was made so that each sub-
group had the same number of pines with normal
watering (5 min/day) and with reduced watering (2
min/day).
To perform the inoculations with bark beetles,
callow adults were collected immediately after
emergence. In each tree, a box containing 15 beetles
were placed in the middle and the device was
covered using Lutrasil tissue to avoid beetles escape.
The inoculation with the PWN followed an
innovative approach. Firstly, three 2 x 2 cm
rectangle of cork were removed from the first tiers
of the trunk (about 1,80 m above the soil) and
exposed phloem was erased with a scalpel in order
to increase the adhesion of the PWN. Afterward,
0,05 mL of of a PWN suspension was placed on in
each incision. In the total, 6000 nematodes were
inoculated per tree. To finalize the task, the removed
rectangle of cork was fixed in the respective place
and wrapped with plastic tape.
Seventy days after the inoculations, the EIS
measurements were performed in all the tree
population. At this time, the pine trees inoculated
with PWN presented some visually symptoms of the
PWD. The decay of those trees, rounded 40 %. Two
of the healthy pines died (decay of 100 %) due to
hydric stress. All remaining individual appeared
healthy.
To perform the EIS measurements, the electrodes
were placed in the trunk of each tree, in a diametric
position, and about 30 cm above the soil. It was used
the portable EIS system version in the voltage mode
of excitation and a frequency range between 1 kHz
and 1 MHz. There were taken two measurements for
each tree. The acquisitions took place between 11
a.m. and 13 p.m. since it was already verified in
previous studies that at this time period the trees
impedance is higher and presents few variation (see
figure 8 – section 4.2).
In order to relate the EIS data with the PWD and
the stage of the disease, the trunk of the pine trees
inoculated with PWN were cut in three distinct
regions to perform a count of nematodes. The cuts
were executed: a) immediately below the inoculation
incision (180 cm above the soil); b) 30 cm above the
soil (where EIS measurements took place); and c) in
the middle of the previous two cuts (approximately
80 cm above the soil).
After the EIS measurements, two healthy pines
were monitored by two independent portable EIS
systems. After a week of monitoring, the same pines
were inoculated with PWN, and the measurements
continued during 7 more weeks. The main purpose
of this last experiment was to study the variation of
the pine EIS profiles during the decay due to the
PWD.
4.2 Results
For each obtained impedance spectra there were
assessed several impedance parameters. Due to
paper space limitation and also because it is a well-
known impedance parameter, it will only be
presented the results obtained for the ratio Z
1
/Z
50
.
Note that it is used the index 1, that corresponds to
the lowest analyzed frequency (1 kHz), instead of
the index 0, as explained in section1.
4.2.1 Impedance Daily Oscillation
The EIS measurements revealed that EIS Cole
profiles have a daily oscillation. To analyze this
behavior it was calculated the R
1
/R
50
ratio (R
represents module) for a period of 4 days.
Figure 8: Variation of the R
1
/R
50
ratio during the
monitoring of a healthy pine tree. The impedance values
show a daily oscillation that is characteristic of the studied
trees.
To confirm the daily oscillation it was calculated
the fast fourier transform of this ratio. A frequency
of 11,57 µHz was clearly founded, which
corresponds to a frequency of 24 h.
The lower values of the ratio R
1
/R
50
correspond
to the night period, while the higher values
correspond to the day period where the temperature
and luminance are higher (between 11 a.m. and 15
p.m.). Previous studies on plants also shown that,
during the day period, the variation of impedance
values is lower than the one observed at the night
Night Period
Day Period
BIODEVICES2013-InternationalConferenceonBiomedicalElectronicsandDevices
42
period. This was the main reason that lead to
performing the EIS measurements between the 11
a.m. and 14 p.m.
4.2.2 Discrimination between Physiological
States
In order to compare results between the different
physiological states of the trees, there were assessed
several impedance parameters. The impedance
parameter that showed better results was the Z
1
/Z
50
ratio – see figure 9.
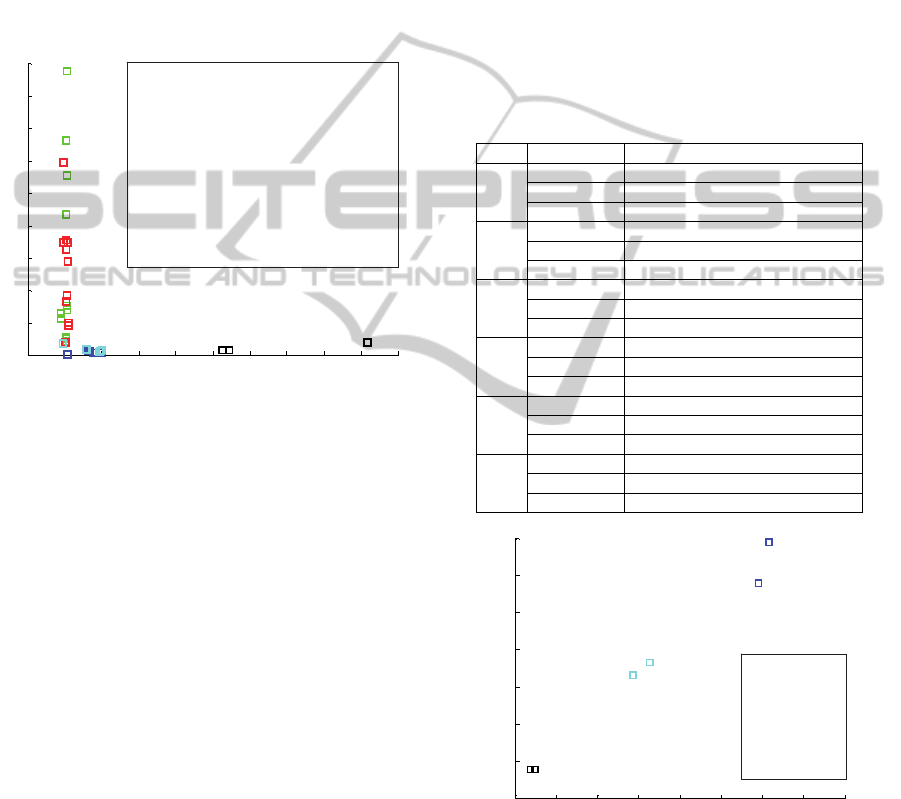
Figure 9: Values of the impedance parameter Z
1
/Z
50
for
each of the 24 pine trees. Note that there are represented
two values for each pine.
The analysis of the obtained results shown that
the healthy pines and the pines inoculated with bark
beetles have similar Z
1
/Z
50
values. In fact, the bark
beetles doesn’t damage the inner structure of the
trees, therefore it was expected that the impedance
profiles were similar between healthy pines and
pines inoculated with bark beetles.
On the other hand, Z
1
/Z
50
values for the pines
inoculated with nematodes and also, for those
inoculated simultaneously with nematodes and bark
beetles, locates in the same region, different from
the previous one, of the graph of figure 9. Those
values present a relatively high dispersion in terms
of reactance. It was later confirmed that higher
reactance Z
1
/Z
50
values correspond to higher number
of nematodes in the tree (see figure 10 from section
4.2.3).
The pines that died due to hydric stress (decay of
100%) were also studied and the Z
1
/Z
50
parameter
present high resistance values in relation to all the
other pines.
4.2.3 Relation between the Number of
Nematodes and Impedance Parameters
The counting of nematodes in the several cut
sections revealed that the concentration of
nematodes was higher in the cut sections b) and c)
for the pines less watered (pines 1, 2 and 3) – see
table 2. It is known that the nematodes move toward
watered regions along the trunk. For this reason, the
concentration of nematodes in the lower parts of the
trunks was much higher for the pines with less
watering than for those with regular watering (pines
4, 5 and 6).
Table 2: Number of nematodes in the trunks of pine trees
per cut sections.
Tree Cut Section Number of nematodes in 0,05 mL
1
a 1
b 0
c 133
2
a 0
b 43
c 1
3
a 0
b 0
c 112
4
a 4
b 20
c 0
5
a 0
b 17
c 0
6
a 0
b 0
c 14
Figure 10: Values of the impedance parameter Z
1
/Z
50
for
the pines inoculated with nematodes and with low
watering (pines 1, 2 and 3 from the table 2). Note that
there are represented two values for each pine.
These results for the nematodes counting support
the already referred results obtained for the Z
1
/Z
50
impedance parameter. In fact, it is observed a clear
0 1 2 3 4 5 6 7 8 9 10
0
10
20
30
40
50
60
70
80
90
Resistance
Reactance
1.03 1.04 1.05 1.06 1.07 1.08 1.09 1.1 1.11
0
5
10
15
20
25
30
35
Resistance
Reactance
Legend:
■ Healthy Pines;
■ Pines inoculated with bark beetles;
■ Pines inoculated with nematodes;
■ Pines inoculated simultaneously
with nematodes and bark beetles;
■ Pines with a decay of 100 % due to
hydric stress (dead pines)
Legend:
■ Pine 1;
■ Pine 2;
■ Pine 3.
BioimpedanceParameterasaRiskFactortoAssessPineDecay-AnInnovativeApproachtotheDiagnosisofPlant
Diseases
43
relation between the number of nematodes and the
reactance dispersion for the Z
1
/Z
50
parameter, as
figure 10 shows. The higher the number of
nematodes is, the higher is the reactance value of
Z
1
/Z
50
. It is considered that the dispersion in terms of
resistance is not significant when compared with
values from pines in other physiological condition –
see figure 9 from section 4.2.2.
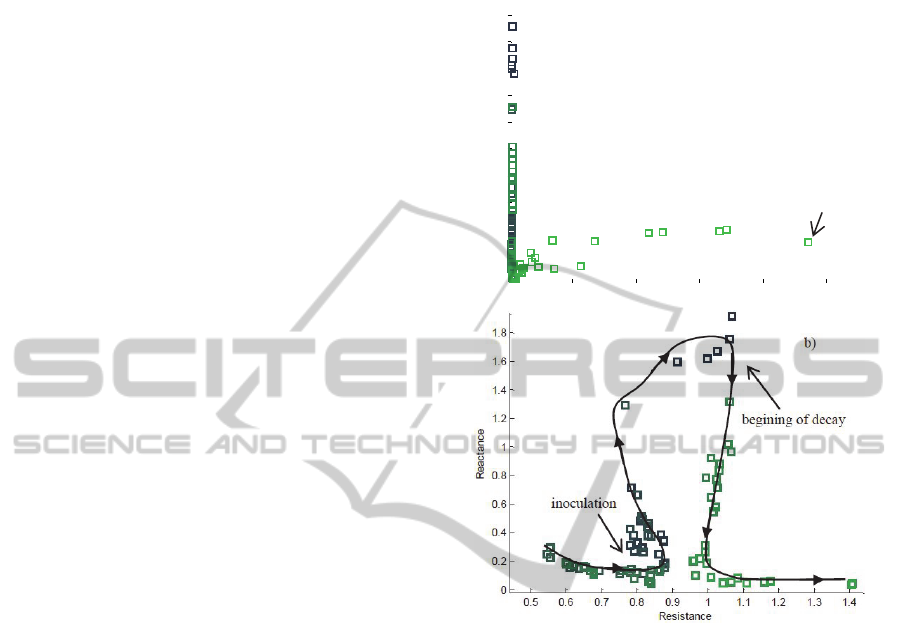
4.2.4 EIS Monitoring during Pine Decay
There were monitored two healthy pines, one with
low watering (2 min/day) and another with regular
watering (5 min/day). After one week from the
beginning of the monitoring, both pines were
inoculated with nematodes. It was shown again a
dispersion of the reactance values of the Z
1
/Z
50
parameter, as figure 11 shows. As time passed the
reactance values became higher. The higher values
of reactance were achieved for the pine with less
watering. According to the previous presented
results, it was expected that the number of
nematodes increase in the below part of the trunk for
the pines with less watering; and consequently, to
observe a higher rising of the reactance of the Z
1
/Z
50
parameter. After the 6th week, pines start to decay
strongly and it was observed a relevant decrease of
the reactance and a significant increase of the
resistance for the same parameter – see figure 11.
The higher values of resistance were achieved for
the pine with less watering, and also in a shorter
period of time. At the end of the monitoring, the
decay of the pines, evaluated by an expertise, was
about 80 % for the pine with regular watering and
100 % for the pine with less watering.
From the figure 11 b), that represents a closer
view of the Z
1
/Z
50
values for the monitoring, it is
possible to observe that the path followed during the
period of nematodes population increasing is
different from the path followed during the period of
decay, i.e., it is observed an hysteresis-like behavior.
5 CONCLUSIONS
The EIS system was developed in order to ensure a
robust, efficient and fast bioimpedance analysis. The
adaptability to different biological applications, the
portability and the usage of easily accessible and
affordable components, were preferred aspects taken
into account. In this manner, the system allows the
user to choose the settings of the analysis that best
fit to a specific application. Furthermore, there were
built two versions of the equipment: one OEM
version for lab tests and a miniaturized version for
field applications.
Figure 11: a) Evolution of the Z1/Z50 during the
monitoring time (8 weeks). b) Closer view from the Z
1
/Z
50
evolution, showing a hysteresis-like behaviour.
The system is able to perform AC scans within a
frequency range from 1 kHz to 1 MHz. The
frequency limits and the number of intervals of the
scan can be selected at the user interface (developed
with Matlab® tools). The type of signal used to
excite de sample, voltage or current, can be
preselected by an external switch. This allows the
usage of the source with the best behaviour in a
concrete application.
The implemented PSD algorithm allows a very
good phase shift assessment without the need to use
a reference signal of amplitude equal to 1 and null-
phase at the origin. In fact, the signal set as reference
has undetermined phase and amplitude. All the
algorithm tests revealed results analogous to the
theoretical.
To overcome problems inherent to stray
capacitive effects from cables, a driven shield
technique is applied. The maximum phase shift
reduction is estimated at 20.4 % for the current
0 20 40 60 80 100
0.2
0.4
0.6
0.8
1
1.2
1.4
1.6
1.8
2
Resistance
Reactance
a)
80 % of decay
BIODEVICES2013-InternationalConferenceonBiomedicalElectronicsandDevices
44

excitation mode and at 35.8% for the voltage mode.
The biological application study aimed at
discriminating between different pine tree
physiological states.
The obtained results suggest that the
implemented method may constitute a first
innovative approach to the early diagnosis of plant
diseases. In fact, the achieved impedance parameters
allow discriminating three different physiological
states: healthy trees, trees with PWD and trees in
hydric stress.
The trees with PWD present Z
1
/Z
50
ratio with
high values of reactance, suggesting that the current
flows preferably trough the cytosol. In fact, the
action of the nematodes inside the tree may destroy
cell membranes. This means that membranes
capacitor effect becomes less significant in the
impedance measurement.
It was also shown that the number of nematodes
and Z
1
/Z
50
impedance parameter are related. The
higher the number of nematodes is, the higher the
reactance of the ratio is.
The action of bark beetles seems not to interfere,
at least in measurable terms, in the level of hydric
stress of pine trees.
Healthy trees, with high values of hydric stress
(decays above 80 %), and also trees with PWD at
advanced stages, revealed low reactance and high
resistance for the same studied parameter. The high
values of resistance are justified due to the water
loss in the tree. Consequently, it means that for this
specific case, the method cannot distinguish between
trees with PWD or trees with high level of hydric
stress but with no disease. However, it is known that
advanced stages of PWD promote high levels of
hydric stress. This means that both cases represent,
in practical terms, the same situation, i.e., the tree
presents high probability to die. In addition, in the
stages where the method is able to distinguish
between healthy trees and trees with PWD, the
decay was determined to round the 40 %. Therefore,
if a cure is available, this diagnosis could help to
administrate a treatment and reverse the disease
evolution.
Hence, the main conclusion of the developed
study is that the studied method could be used to
assess physiological states of living pine trees, and
that the Z
1
/Z
50
impedance parameter could be
applied as a risk factor.
ACKNOWLEDGEMENTS
We acknowledge support from Fundação para a
Ciência e Tecnologia, FCT (scholarship
SFRH/BD/61522/2009).
REFERENCES
Bauchot, A. D., Harker, F. R. and Arnold, W. M., (2000).
The Use of Electrical Impedance Spectroscopy to
Assess the Physiological Condition of Kiwifruit.
Postharvest Biology and Technology, 18 9-18.
Callegaro, L., (2009). The Metrology of Electrical
Impedance at High Frequency: a Review. Meas. Sci.
Techno, 20 022002.
Dean, D. A., Ramanathan, T., Machado, D. and
Sundararajan, R., (2008). Electrical Impedance
Spectroscopy Study of Biological Tissues. J
Elesctrostat, 66 (3-4): 165-177.
Dejmek, P. and Miyawaki O., (2002). Relantionship
between the Electrical and Rheological Properties of
Potato Tuber Tissue after Various Forms of
Processing. Biosci. Biotechnol. Biochem., 66 (6),
1218-1223.
Fang, Q., Liu, X. and Cosic, I., (2007). Bioimpedance
Study on Four Apple Varieties. IFMBE Proceedings,
17, 114-117.
Fukuma, H., Tanaka, K. and Yamaura, I., (2001).
Measurement of Impedance of Columnar Botanical
Tissue Using the Multielectrode Method. Electronics
and Communications in Japan, 3, 84, 2.
Giouvanoudi, A. C. and Spyrou N. M., (2008). Epigastric
Electrical Impedance for the Quantitative
Determination of the Gastric Acidity. Physiol. Meas.,
29 1305-1317.
Grimnes, S. and Martinsen, O. (2008). Bioimpedance &
Bioelectricity Basics, 2
nd
Edition. Academic Press of
Elsevier.
Harker, F. R. and Maindonald, J. H., (1994). Ripening of
Nectarine Fruit – Changes in the Cell Wall, Vacuole,
and Membranes Detected Using Electrical Impedance
Measurements. Plant Physiol, 106: 165-171.
Hayashi, T., Todoriki, S., Otobe, K., Sugiyama, J., (1992).
Impedance Measuring Technique for Identifying
Irradiated Potatoes. Biosci. Biotechnol. Biochem., 56
(12), 1929-1932.
He, C., Zhang, L., Liu, B., Xu, Z. and Zhang, Z., (2008).
A Digital Phase-sensitive Detector for Electrical
Impedance Tomography. IEEE proceedings.
Ivorra, A., (2003). Bioimpedance Monitoring for
Physicians: an Overview. Centre Nacional de
Microelectrònica, Biomedical Applications Group.
Kyle, U. et al., (2004). Bioelectrical Impedance Analysis –
Part I: Review of Principles and Methods. Clinical
Nutrition, 23, 1226-1243.
Pliquett, U., (2010). Bioimpedance: A Review for Food
Processing. Food Eng Rev, 2:74-94.
Rafiei-Naeini, M., Wright P. and McCann, H., (2007).
Low-Noise Measurements for Electrical Impedance
Tomography. IFMBE Proceedings, 17 324-327.
Repo, T., Zhang, G., Ryyppö, A. and Rikala, R., (2000).
BioimpedanceParameterasaRiskFactortoAssessPineDecay-AnInnovativeApproachtotheDiagnosisofPlant
Diseases
45

The Electrical Impedance Spectroscopy of Scots Pine
(Pinus sylvestris L.) Shoots in Relation to Cold
Acclimation. Journal of Experimental Botany, 51,
353, 2095-2107.
Ross, A. S., Saulnier, G. J., Newell, J. C. and Isaacson, D.,
(2003). Current Source Design for Electrical
Impedance Tomography. Physiol. Meas., 24 509-516.
Saulnier, G. J, Ross, A. S. and Liu, n., (2006). A High-
Precision Voltage Source for EIT. Physiol. Meas., 27
S221-S236.
Seoane, F., Bragós, R. and Lindecrantz, K. (2006). Current
Source for Multifrequency Broadband Electrical
Bioimpedance Spectroscopy Systems. A Novel
Approach. Proceedings of the 28
th
IEEE, 1-4244-0033.
Väinöla, A. and Repo, T. (2000). Impedance Spectroscopy
in Frost Hardiness Evaluation of Rhododendron
Leaves. Annals of Botany, 86: 799-805.
Vozáry, E. and Mészáros, P., (2007). Effect of Mechanical
Stress on Apple Impedance Parameters. IFMBE
Proceedings, Vol. 17.
Willis, J. and Hobday, A., (2008). Application of
Bioelectrical Impedance Analysis as a Method for
Estimating Composition and Metabolic Condition of
Southern Bluefin Tuna (Thumus maccoyii) During
Conventional Tagging. Fisheries Research, 93 64-71.
Yamamoto, T., Oomura, Y., Nishino, H., Aou, S. and
Nakano, Y., (1985). Driven Shield for Multi-Barrel
Electrode. Brain Research Bulletin, 14 103-104.
Yoo, P. J., Lee, D. H., Oh, T. I. and Woo, E. J., (2010).
Wideband Bio-impedance Spectroscopy using Voltage
Source and Tetra-polar Electrode Configuration.
Journal of Physics, 224 012160.
BIODEVICES2013-InternationalConferenceonBiomedicalElectronicsandDevices
46
