
An Image Quality Assessment Technique using Defocused Blur as
Evaluation Metric
Huei-Yung Lin and Xin-Han Chou
Department of Electrical Engineering, National Chung Cheng University
168 University Rd., Min-Hsiung, Chiayi 621, Taiwan
Keywords:
Image Quality Assessment, Blur Identification, Histogram Matching.
Abstract:
In this paper, an image quality assessment technique based on defocus blur identification is proposed. Some
representative image regions containing edge features are first extracted automatically. A histogram analysis
based on the comparison of real and synthesized defocused regions is then carried out to estimate the blur
extent. By iteratively changing the convolution parameters, the best blur extent is identified from histogram
matching. The image quality is finally evaluated based on the overall blur extent of the selected regions. We
have performed the experiments using real scene images. It is shown that accurate image quality assessment
results can be achieved using the proposed technique.
1 INTRODUCTION
Image quality assessment is an important issue for
many image processing systems and multimedia ap-
plications. It aims to evaluate the image quality based
on some possible measures, such as contrast, bright-
ness, and sharpness, to reflect the human visual per-
ception. Since the idea of image quality is percep-
tual and sometimes subjective, deriving a universal
approach based on a specific standard is either in-
feasible or very difficult. Thus, the current objective
quality metrics are commonly categorized according
to the availability of a reference image, namely full-
reference, no-reference, and reduced-reference meth-
ods (Furht and Marques, 2003).
Among the existing techniques, the full-reference
and reduced-reference approaches are mostly de-
signed for image compression and transmission pur-
poses, rather for the assessment of originally ac-
quired images. For those images directly captured
by a camera, there is no ground truth reference for
quality evaluation. Thus, the particular interest is
the no-reference image quality assessment techniques
(Gabarda and Crist
´
obal, 2007; Ciancio et al., 2011;
Ye and Doermann, 2011). Since the low noise images
can be easily produced by the modern sensing tech-
nologies, the image quality is mainly affected by the
improper image formation during the acquisition pro-
cess. In general, the most prominent issue is the im-
age blur introduced by optical defocus or the relative
motion between the camera and the scene (Bondzulic
and Petrovic, 2011). Consequently, the evaluation of
image blur lies on the core of most image quality as-
sessment techniques.
In this work, we present a defocus blur identifica-
tion technique based on histogram analysis for image
quality assessment. The defocus process of a cam-
era system is formulated by the spatial convolution
of the image with a pillbox point spread function.
For a given image for quality assessment, the regions
containing edge features are selected for blur extent
estimation. The histogram of a defocused region is
compared with the ones derived from the image re-
gions generated with synthetic pillbox blur. By itera-
tively changing the point spread function parameters,
the best blur extent can be identified from image his-
togram matching. The image quality is then evaluated
based on the overall blur extent of the selected edge
regions.
The proposed blur parameter identification ap-
proach does not rely on the system calibration or cam-
era parameters. Since no prior knowledge is required
other than the captured image itself, the histogram
matching algorithm can be carried out on the selected
image regions for blur estimation. To demonstrate the
effectiveness of our image quality assessment tech-
nique, we have conducted several experiments using
the images captured with known ground truth qual-
ity rankings and some test images in the LIVE image
database (Sheikh et al., 2006). The experimental re-
101
Lin H. and Chou X..
An Image Quality Assessment Technique using Defocused Blur as Evaluation Metric.
DOI: 10.5220/0004232101010104
In Proceedings of the International Conference on Computer Vision Theory and Applications (VISAPP-2013), pages 101-104
ISBN: 978-989-8565-47-1
Copyright
c
2013 SCITEPRESS (Science and Technology Publications, Lda.)

sults have shown that our approach is able to achieve
high accurate image quality rankings using an objec-
tive evaluation metric.
2 QUALITY ASSESSMENT
Given an ideal black and white image with intensity
values µ
1
and µ
2
, the histogram consists of only two
sharp peaks at these two intensity values. For a real
scene image captured by a camera, the intensities are
spread out due to the optical system and noise, and
the histogram usually contains two bell-shape distri-
butions located at µ
1
and µ
2
. If the image contains
defocus blur, the mixture of high and low intensity
values introduced by the point spread function gen-
erates a smooth transition between µ
1
and µ
2
in the
histogram.
According to the defocused image formation, the
histogram changes with the blur extent (Lin et al.,
2012). When the defocus blur becomes severe, the
two main lobes corresponding to the high and low in-
tensity regions diminish, and the transition area be-
tween the two main lobes increases. Thus, the blur
extent of a defocused image can be characterized by
the distribution of its histogram. By comparing the
histogram of the unknown defocused image with the
histogram of a calibrated image, the blur extent of the
unknown image can be identified. More specifically,
the blur parameter of the point-spread function can
be derived by this histogram matching technique and
used to represent the amount of defocus blur associ-
ated with the given image (Lin and Chou, 2012).
To apply our blur identification technique for im-
age sharpness evaluation, we need to select several re-
gions of interest (ROI) for histogram matching. This
is accomplished automatically by performing the fol-
lowing steps. First, an edge image obtained from
Canny edge detection is used to derive suitable edge
segments for blur extent estimation. Since the blur
identification is carried out locally along the horizon-
tal direction, the edge segments are constrained by
three criteria to ensure the robustness of histogram
matching: (a) the vertical 8-neighbor connectivity, (b)
a minimum edge length threshold (typically about 1%
of the original image height), and (c) no other edges
present in the neighborhood.
Second, an initial ROI with a fixed width (typi-
cally about 2% of the original image width) is as-
signed for each edge segment. The intensity distri-
bution of each ROI is analyzed, and only those ROIs
with low intensity variation on both sides of the edge
segment are preserved. Finally, each ROI is enlarged
in the horizontal direction if the local intensity distri-
butions on both sides of the edge still remain uniform
when including an extra column of pixels from the
left and right of the ROI respectively. This process
is carried out iteratively until the local intensity vari-
ation is no longer uniform. It aims to provide larger
ROIs for histogram matching and achieve better blur
identification results.
After the ROIs are selected for a given image, his-
togram matching is performed on each ROI individu-
ally. The average of the identified blur extents from all
ROIs is used to represent the image sharpness. For a
given set of images, the quality ranking is then derived
based on the amount of their blur extents. To evalu-
ate the performance of our image quality assessment
technique, the ground truth image quality ranking is
used for comparison. Suppose a set of n images is
indexed by 1, 2, · · · , n, according to their ground truth
quality, and the evaluated quality ranking is given by
a permutation function p(·). Then the quality assess-
ment score for the image set is defined by
S =
∑
n
i=1
∑
n
j=1
c(i, j)
C
n
2
(1)
where
c(i, j) =
1 if i < j implies p(i) < p( j)
0 otherwise
(2)
It is seen that the quality assessment score S ∈ [0, 1].
The special cases S = 1 and S = 0 correspond to the
correct and completely reverse quality rankings, re-
spectively.
3 EXPERIMENTAL RESULTS
The proposed image quality assessment technique has
been tested using the images with synthetic and real
defocus blur. For the experiments with synthetic blur,
we choose 8 sets of images with Gaussian blur from
the LIVE image database (Sheikh et al., 2006; Wang
et al., 2004). A series of 10 blurred images are gen-
erated from each reference image using the circular-
symmetric 2-D Gaussian kernels on with standard de-
viation ranging from 0.5 to 5 pixels with mask size:
5,9,13,17,21,25,31,35,39,43.
In the experiments, the number of ROIs extracted
from each test image and used for image quality as-
sessment ranges from 21 to 107. The blur identifi-
cation results of the LIVE database images are tabu-
lated in Table 1. The quality evaluation of the image
datasets is illustrated in Figure 1. Index number 0
indicates the reference or focused image, and the im-
ages generated with more severe blur are those with
VISAPP2013-InternationalConferenceonComputerVisionTheoryandApplications
102
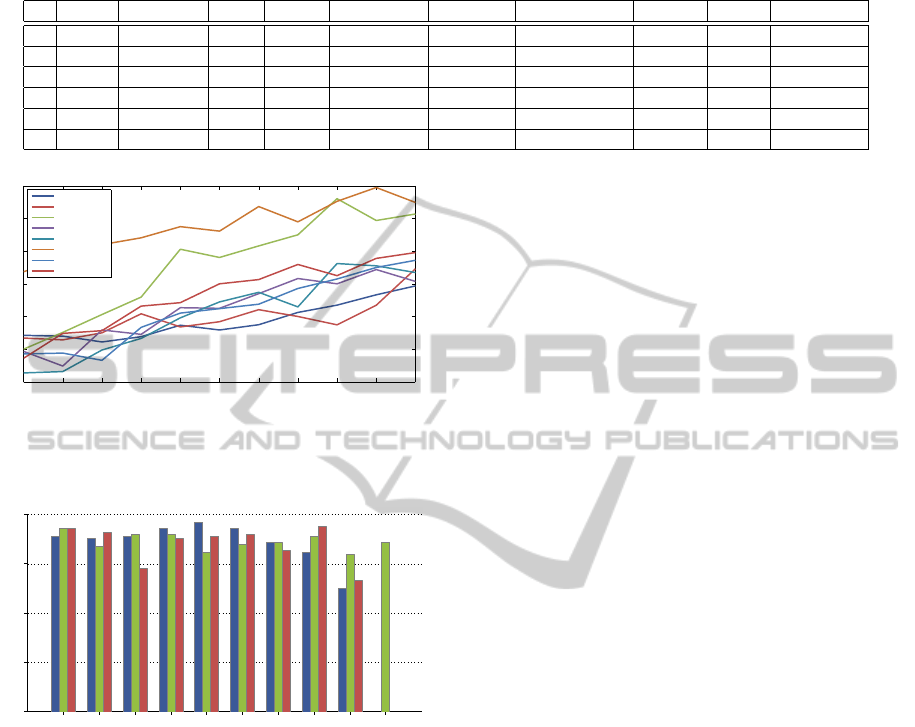
Table 1: The blur extents of the LIVE database images and our captured defocused images. Index number 0 indicates the
reference or focused image, and the images generated or captured with more severe blur are those with higher index numbers.
# bikes buildings caps house lighthouse monarch paintedhouse parrots plane womanhat
0 2.33 0.00 0.59 1.00 0.50 1.00 5.50 1.86 0.78 2.75
1 2.33 0.00 0.76 1.67 0.50 1.50 5.25 2.14 1.44 3.13
2 2.33 0.33 1.41 2.00 2.50 3.00 6.75 2.43 1.33 4.63
3 3.00 0.67 2.76 2.00 2.50 3.00 7.00 3.57 2.33 4.75
4 3.67 1.33 5.29 3.00 4.50 4.00 7.25 4.86 6.11 5.75
5 7.67 4.00 7.88 4.33 11.00 3.50 12.50 9.00 6.56 7.00
0 1 2 3 4 5 6 7 8 9 10
1
2
3
4
5
6
7
Image Index
Blur Width
bikes
buildings
caps
monarch
paintedhouse
parrots
plane
womanhat
Figure 1: The quality evaluation of 8 image datasets (build-
ings, monarch, parrots, plane, bikes, caps, paintedhouse,
womanhat) from the LIVE image database.
cing−yuan corner fountain gate gym hall IIC parkinglot pool average
80%
85%
90%
95%
100%
97.18%
Figure 2: The accuracy of our image quality assessment
evaluated using the images captured with different amount
of blur.
higher index numbers. The plots reveal the consis-
tency between the identified blur extent and the image
quality in most cases.
For the experiments with real blur test, we choose
9 locations and capture 3 sets of images from differ-
ent viewpoints for each location. Each of the above 27
image datasets contains a sequence of 32 images cap-
tured with different defocus settings, so there are to-
tally 864 images in our evaluation database. Since the
image sequences are captured by changing the lens
focus position from the well-focused setting gradually
to the most defocused setting, the ground truth image
quality ranking can be obtained accordingly and used
for performance evaluation.
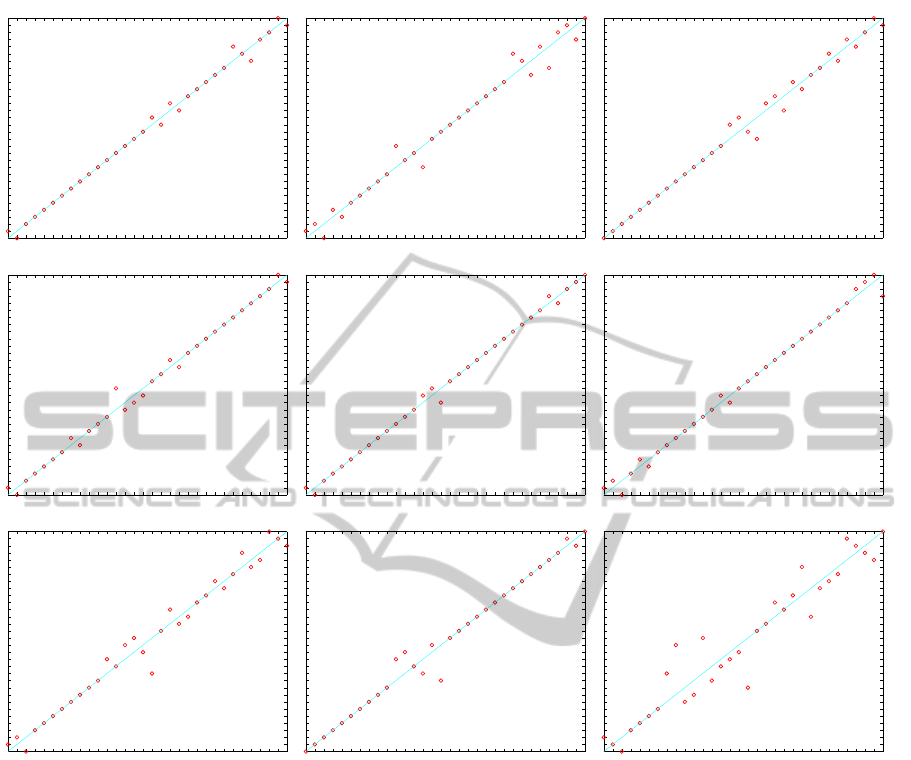
The image quality assessment is carried out first
by evaluating the quality of individual images based
on the blur extent estimation, followed by deriving
and comparing the quality ranking for each of the 27
image datasets. Figure 3 illustrates some results of
image quality assessment for the image datasets cap-
tured from the 9 different locations. The ground truth
image quality ranking and our evaluation result are
shown in the x-axis and y-axis, respectively. The data
points scattering around the 45
◦
lines in the plots ex-
hibits the high correlation between our quality evalu-
ation and the ground truth ranking. These results are
also consistent with the accuracy calculated using the
quality assessment score given by Eq. (1). As shown
in Figure 2, the overall accuracy on the image quality
ranking is about 97% for the real scene images used
in the experiment.
4 CONCLUSIONS
The image blur introduced by optical defocus is one
major issue which affects the image quality. In this
work, we present a histogram based defocus blur
identification approach for image quality assessment.
Given an input image, the edge regions are first ex-
tracted automatically, followed by a novel histogram
matching technique for blur extent estimation. The
image quality is then evaluated based on the overall
blur extent of the selected regions. Since no prior
knowledge such as camera parameters is required, the
proposed non-reference method is suitable for quality
assessment of archived images. The experimental re-
sults have demonstrated that our technique is able to
achieve high accurate image quality rankings using an
objective evaluation metric.
ACKNOWLEDGEMENTS
The support of this work in part by National Science
Council of Taiwan under Grant NSC-99-2221-E-194-
005-MY3 is gratefully acknowledged.
AnImageQualityAssessmentTechniqueusingDefocusedBlurasEvaluationMetric
103
0 1 2 3 4 5 6 7 8 9 10 11 12 13 14 15 16 17 18 19 20 21 22 23 24 25 26 27 28 29 30 31
1
0
2
3
4
5
6
7
8
9
10
11
12
13
14
15
17
16
19
18
20
21
22
23
24
27
26
25
28
29
31
30
Cing−yuan2
Accuracy: 98.5887%
0 1 2 3 4 5 6 7 8 9 10 11 12 13 14 15 16 17 18 19 20 21 22 23 24 25 26 27 28 29 30 31
1
2
0
4
3
5
6
7
8
9
13
11
12
10
14
15
16
17
18
19
20
21
22
26
25
23
27
24
29
30
28
31
Corner2
Accuracy: 96.7742%
0 1 2 3 4 5 6 7 8 9 10 11 12 13 14 15 16 17 18 19 20 21 22 23 24 25 26 27 28 29 30 31
0
1
2
3
4
5
6
7
8
9
10
11
12
13
16
17
15
14
19
20
18
22
21
23
24
26
25
28
27
29
31
30
Fountain1
Accuracy: 97.7823%
0 1 2 3 4 5 6 7 8 9 10 11 12 13 14 15 16 17 18 19 20 21 22 23 24 25 26 27 28 29 30 31
1
0
2
3
4
5
6
8
7
9
10
11
15
12
13
14
16
17
19
18
20
21
22
23
24
25
26
27
28
29
31
30
Gate1
Accuracy: 98.5887%
0 1 2 3 4 5 6 7 8 9 10 11 12 13 14 15 16 17 18 19 20 21 22 23 24 25 26 27 28 29 30 31
1
0
2
3
4
5
6
7
8
9
10
11
12
14
15
13
16
17
18
19
20
21
22
23
24
25
26
28
27
29
30
31
Gym1
Accuracy: 99.1935%
0 1 2 3 4 5 6 7 8 9 10 11 12 13 14 15 16 17 18 19 20 21 22 23 24 25 26 27 28 29 30 31
1
2
0
3
5
4
6
7
8
9
10
11
12
14
13
15
16
17
18
19
20
21
22
23
24
25
26
27
29
30
31
28
Hall1
Accuracy: 98.5887%
0 1 2 3 4 5 6 7 8 9 10 11 12 13 14 15 16 17 18 19 20 21 22 23 24 25 26 27 28 29 30 31
1
2
0
3
4
5
6
7
8
9
10
13
12
15
16
14
11
17
20
18
19
21
22
24
23
25
28
26
27
31
30
29
IIC3
Accuracy: 96.371%
0 1 2 3 4 5 6 7 8 9 10 11 12 13 14 15 16 17 18 19 20 21 22 23 24 25 26 27 28 29 30 31
0
1
2
3
4
5
6
7
8
9
13
14
12
11
15
10
16
17
18
19
20
21
22
23
24
25
26
27
28
30
29
31
Parkinglot2
Accuracy: 97.7823%
0 1 2 3 4 5 6 7 8 9 10 11 12 13 14 15 16 17 18 19 20 21 22 23 24 25 26 27 28 29 30 31
2
1
0
3
4
5
6
11
15
7
8
16
10
12
13
14
9
17
18
21
20
22
26
19
23
24
25
30
29
28
27
31
Pool1
Accuracy: 92.5403%
Figure 3: Image quality assessment results of the image datasets captured from the outdoor scenes.
REFERENCES
Bondzulic, B. and Petrovic, V. (2011). Edge-based objec-
tive evaluation of image quality. In 18th IEEE Inter-
national Conference on Image Processing, pages 3305
–3308.
Ciancio, A., da Costa, A., da Silva, E., Said, A., Samadani,
R., and Obrador, P. (2011). No-reference blur as-
sessment of digital pictures based on multifeature
classifiers. IEEE Transactions on Image Processing,
20(1):64 –75.
Furht, B. and Marques, O. (2003). Handbook of Video
Databases: Design and Applications. CRC Press,
Inc., Boca Raton, FL, USA, 1 edition.
Gabarda, S. and Crist
´
obal, G. (2007). Blind image quality
assessment through anisotropy. J. Opt. Soc. Am. A,
24(12):B42–B51.
Lin, H.-Y. and Chou, X.-H. (2012). Defocus blur parame-
ters identification by histogram matching. J. Opt. Soc.
Am. A, 29(8):1694–1706.
Lin, H.-Y., Gu, K.-D., and Chang, C.-H. (2012). Photo-
consistent synthesis of motion blur and depth-of-field
effects with a real camera model. Image Vision Com-
put., 30(9):605–618.
Sheikh, H., Sabir, M., and Bovik, A. (2006). A statisti-
cal evaluation of recent full reference image quality
assessment algorithms. IEEE Transactions on Image
Processing, 15(11):3440 –3451.
Wang, Z., Bovik, A., Sheikh, H., and Simoncelli, E. (2004).
Image quality assessment: from error visibility to
structural similarity. IEEE Transactions on Image
Processing, 13(4):600 –612.
Ye, P. and Doermann, D. (2011). No-reference image qual-
ity assessment based on visual codebook. In 18th
IEEE International Conference on Image Processing,
pages 3089 –3092.
VISAPP2013-InternationalConferenceonComputerVisionTheoryandApplications
104
