Hierarchical Design of Continuous Line Illustrations
Fernando J. Wong and Shigeo Takahashi
The University of Tokyo, Tokyo, Japan
Keywords:
Line Illustration, Hierarchical Design, Eulerian Paths.
Abstract:
A hierarchical approach for designing continuous line illustrations, drawings that consist of a single line, is
presented throughout this paper. Users specify a graph that will guide the overall shape of the line illustration,
and proceed to assign a series of child graphs to many of its vertices. A line illustration can then be generated
by taking all of these graphs into account, allowing us to produce complex drawings that are composed of
several objects. Our approach also allows us to preserve the overall structure and orientation of the line as
graphs are inserted or removed from the illustration. We also propose a variety of visual enhancements for
our illustrations based on the specified hierarchical graph information and provide several result examples that
demonstrate the effectiveness of our approach.
1 INTRODUCTION
Continuous Line Illustrations (CLI) are a subclass of
artistic drawings that abstract an object or scene with
a single line that portrays the most relevant features
of the object in question. This style is often taught
in art courses as a technique to help students develop
their artistic senses (Nicola
¨
ıdes, 1990). Apart from
artistic purposes, CLIs also have many real-world ap-
plications in the production of quilting designs (Fritz,
2001), steel wire sculptures (Lohman, 2009), and
connect-the-dots puzzles, just to name a few.
Despite their simple nature, there is actually quite
a variety of CLI styles. For example, the works of
Morales (Morales, 2005) consist of a non-intersecting
line of uniform thickness, which approximates the
shading of the scene through the variation of line den-
sity at different areas. Slater’s paintings (Slater, 2001)
depict a non-intersecting line that varies in thickness
and color accordingly, covering most of the canvas
with the line while beautifully portraying the color of
the scene. In Lindsay’s works (Lindsay, 2010), a self-
intersecting smooth curve with uniform thickness is
traced, while often portraying several objects along
the line. Sable’s drawings (Sable, 2009) also contain
several self-intersections in them, while adding varia-
tions in line thickness accordingly, in order to achieve
shading effects with the line.
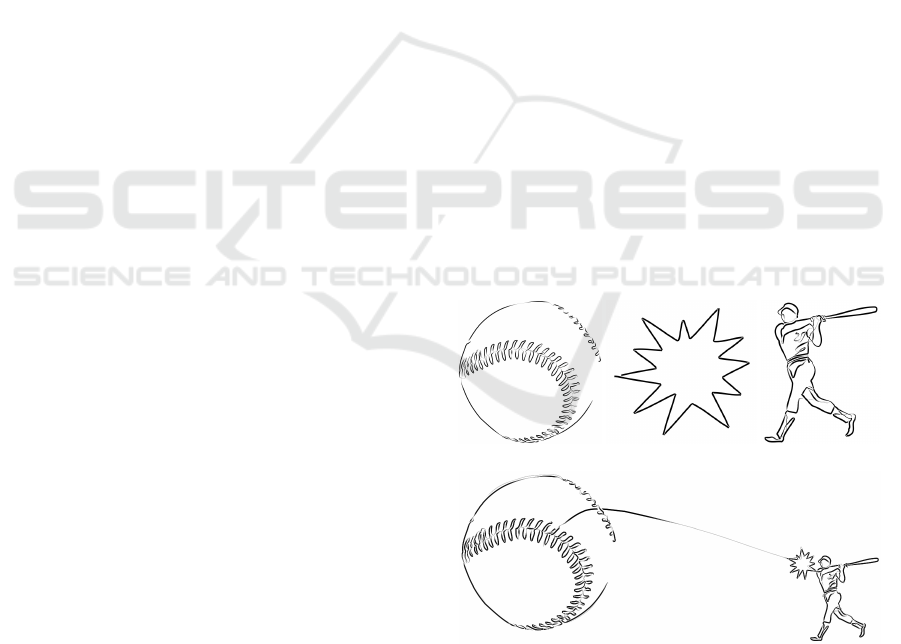
Our work aims to provide a framework for gen-
erating CLIs of individual objects (Figures 1(a), 1(b)
and 1(c)), as well as designing complex CLIs con-
(a) (b) (c)
(d)
Figure 1: (a,b,c) Continuous line illustrations of individual
objects. (d) Different objects can be combined in order to
produce more complex illustrations.
taining several parts (Figure 1(d)). Previous works
addressed the image-based automatic generation of
CLIs, while no research has been conducted thus far
on how to design such complex illustrations.
This paper is organized as follows: Previous
works relevant to our research are presented in Sec-
tion 2. An overview of our hierarchical CLI approach
is provided in Section 3, and further details are given
throughout Sections 4, 5 and 6. Results of our ap-
proach are discussed in Section 7, followed by con-
clusions and pointers to future work in Section 8.
131
J. Wong F. and Takahashi S..
Hierarchical Design of Continuous Line Illustrations.
DOI: 10.5220/0004232701310138
In Proceedings of the International Conference on Computer Graphics Theory and Applications and International Conference on Information
Visualization Theory and Applications (GRAPP-2013), pages 131-138
ISBN: 978-989-8565-46-4
Copyright
c
2013 SCITEPRESS (Science and Technology Publications, Lda.)
2 RELATED WORK
As was mentioned earlier, previous works focused on
the automatic generation of CLIs from input images.
The first of these works was given in (Bosch and Her-
man, 2004), where a continuous line drawing was cre-
ated by first obtaining a point distribution based on
the image intensity, and then solving an instance of
the traveling salesman problem (TSP) over the set of
points. This approach was later extended in (Kaplan
and Bosch, 2005) by making use of modern image
stippling techniques, in order to obtain a point dis-
tribution that better approximated the image. These
works aimed to produce CLIs that resembled the ap-
pearance of Morales’ works (Morales, 2005), achiev-
ing a type of half-toning technique based on a non-
intersecting continuous line. Work on how to generate
self-intersecting CLIs that portray the contours of the
image instead of its shading was proposed recently
in (Wong and Takahashi, 2011). In this approach, a
graph is created from edges detected in the image,
and then a CLI is modeled after an Eulerian path in
this graph, resulting in illustrations that are more sim-
ilar in nature to those of Lindsay (Lindsay, 2010). Our
work builds up on this last approach for creating line
illustrations that portray several objects.
CLIs also share a relationship with labyrinths and
mazes. For example, the labyrinth-like structures pro-
posed in (Pedersen and Singh, 2006) are, in essence,
CLIs as well. Their method is based on the evolution
of curves into an organic labyrinth pattern, through
the iterative application of forces. CLIs can also be
found in the solutions of picture mazes. The method
in (Wong and Takahashi, 2009) introduced an itera-
tive cycle growing and merging procedure for creat-
ing maze solution paths that approximated the shape
and shading of an image.
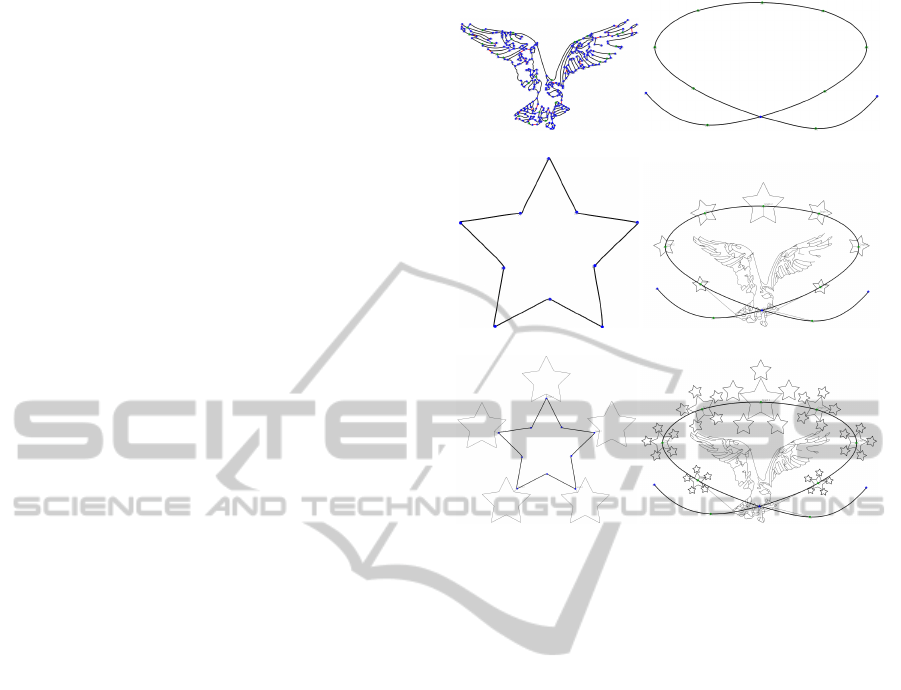
3 METHOD OVERVIEW
The proposed framework takes a set of graphs as
input, which represent the many objects or silhou-
ettes that will compose the final line illustration (Fig-
ures 2(a), 2(b) and 2(c)). In order to create these
graphs, our prototype system allows users to provide
a number of images in order to automatically derive
a graph from each of them as described in (Wong
and Takahashi, 2011). Alternatively, users can de-
sign their own graphs by tracing rough sketches, after
which our system will derive the graphs from them.
Users then specify one of these graphs as a root graph
(Figure 2(b)), and assign a series of child graphs to
any of its vertices with a click of the mouse (Fig-
(a) (b)
(c) (d)
(e) (f)
Figure 2: Method overview. (a,b,c) A set of basis graphs is
specified by the user. These graphs can be either (a) image-
derived or (b,c) user-generated. (b) A root graph is desig-
nated, and (d) several child graphs are assigned to its ver-
tices. (e) A child graph can also contain its own set of chil-
dren. (f) Moreover, a child graph can be referenced by dif-
ferent vertices of its parent, automatically propagating any
changes in the child graph to all vertices pointing to it.
ure 2(d)). Child graphs can also contain their own set
of children in order to portray more complex objects
(Figure 2(e)), and they can also be translated, rotated
or scaled relative to their parents.
After the graph assignment phase, a CLI is gen-
erated in a top-down manner, starting with the root
graph and then proceeding with the graphs located at
deeper levels. We attempt to preserve the coherence
of the CLI across hierarchical levels, that is, assigning
a child graph to a vertex should only affect the shape
of the final CLI at that location, but have no impact
on the endpoints nor on the orientation of the CLI as
a whole. Also, we exploit the hierarchical relation-
ships between the graphs in order to achieve a variety
of visual effects along the line.
4 HIERARCHICAL CLI DESIGN
As mentioned earlier, our system generates CLIs
composed of several objects by specifying hierarchi-
GRAPP2013-InternationalConferenceonComputerGraphicsTheoryandApplications
132
cal relationships between different graphs that repre-
sent each of these objects. In this section, we describe
the underlying structure used to model these hierar-
chical relations in our line illustrations.
4.1 The Hierarchical Graph
The input to our framework is a set of user-specified
basis graphs G = {G
1
(V
G
1
,E
G
1
),...,G
n
(V
G
n
,E
G
n
)},
where V
G
i
and E
G
i
are the sets of vertices and
edges of graph G
i
, respectively. The relationship be-
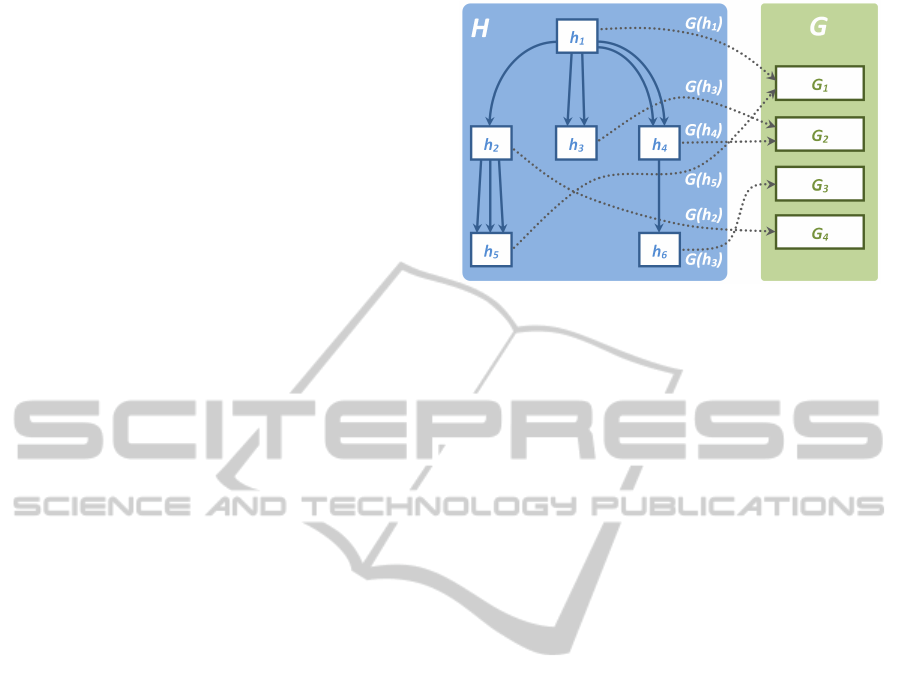
tween these graphs is modeled as a directed graph
H(V
H
,E
H
), which we refer to as the hierarchical
graph of the CLI (Figure 3). Each vertex h ∈ V
H
contains a pointer to a basis graph G(h) ∈ G, while
each directed edge e
h
= (h
p
,h
c
) ∈ E
H
, between a
parent vertex h
p
and a child vertex h
c
, encodes in-
formation needed in order to model the relationship
between the parent graph G(h
p
) ∈ G and the child
graph G(h
c
) ∈ G. The information stored in each
edge e
h
∈ E
H
includes:
• The position, rotation angle and scaling of G(h
c
)
relative to G(h
p
).
• A pair of endpoint vertices v
p
(e
h
) ∈ V
G(h
p
)
and
v
c
(e
h
) ∈ V
G(h
c
)
, through which G(h
p
) and G(h
c
)
are connected.
• The type of relation established between G(h
p
)
and G(h
c
) (Section 4.2).
We allow any number of edges e
h
= (h
p
,h
c
) ∈ E
H
between any two vertices h
p
,h
c
∈ V
H
as seen in Fig-
ure 3. In other words, a parent graph G(h
p
) can be
assigned the same child graph G(h
c
) at many of its
vertices. This allows us to modify G(h
c
) by assigning
its own set of children to it, and have the changes be
automatically reflected in all other vertices in G(h
p
)
that also have a reference to G(h
c
) (Figure 2(f)).
4.2 Hierarchical Relation Types
Users can specify one of two relation types between
parent and child graphs: single link and multiple link
relations. In single link relations, a child graph is con-
nected to its parent by inserting a linking edge that
connects a vertex v
c
(e
h
) in G(h
c
) directly with an-
other vertex v
p
(e
h
) in G(h
p
). In multiple link rela-
tions, several linking edges are inserted between the
neighbors of v
p
(e
h
) ∈ G(h
p
) and a number of vertices
in G(h
c
), one for each neighbor of v
p
(e
h
). In other
words, the child graph is linked to its parent through
several edges, traced between the neighbors of its as-
signed vertex in the parent and different vertices in the
child graph. The assigned vertex v
p
(e
h
) in these cases
Figure 3: A diagram of a hierarchical CLI graph.
is not drawn, but replaced instead by the child graph
in the final CLI.
By default, linking edges in our system are traced
between the assigned vertex v
p
(e
h
) (or its neighbors)
and the vertex (or vertices) in the child graph that is
closest to v
p
(e
h
), while taking the position, rotation
and scaling of G(h
c
) relative to G(h
p
) into account.
However, our system also allows users to modify link-
ing edges in order to connect them at specific vertices
in the child graph.
5 CLI COMPUTATION
Once the overall hierarchical structure of the CLI has
been designed, the next step is to compute the CLI
itself. This section explains how to obtain CLIs from
both a general or a hierarchical graph.
5.1 Single Graph to CLI
A CLI can be modeled as an Eulerian path in a given
graph G(V
G
,E
G
). For such a path to exist, it is nec-
essary for G to be Eulerian or semi-Eulerian, i.e.,
it should contain at most two vertices of odd de-
gree (Gross and Yellen, 2005). Assuming G is Eule-
rian or semi-Eulerian, an Eulerian path can be found
in it by using Hierholzer’s or Fleury’s algorithm (Hi-
erholzer and Wiener, 1873; Fleury, 1883).
In (Wong and Takahashi, 2011), we developed a
semi-Eulerization technique that inserts, removes and
duplicates graph edges systematically, in order to re-
duce the number of odd-vertices in the graph, while
avoiding visual artifacts in our CLIs such as the exces-
sive retracing of edges. We also proposed a modifica-
tion to Fleury’s algorithm that attempts to avoid un-
natural changes in line curvature. Fleury’s algorithm
for semi-Eulerian graphs basically works as follows:
1. Set the current vertex u as one of the odd vertices.
HierarchicalDesignofContinuousLineIllustrations
133

(a) (b) (c) (d)
Figure 4: CLI coherence across hierarchical levels. (a) A diamond-shaped graph is converted into (b) a CLI. (c) A CLI
generated after assigning the same graph to its central vertex. Although the new CLI has the same endpoints, the overall
orientation followed by the line is different. (d) This orientation can be preserved as much as possible with our approach.
2. Select a non-bridge
1
edge e = (u, v) ∈ E
G
.
3. Traverse to from u to v and remove e from G.
4. Repeat from Step 2 until no edges remain in G.
5. The Eulerian path is given by the order in which
vertices were visited.
This algorithm was modified in Step 2 by match-
ing the edges adjacent to u, in a way that minimizes
the total difference in orientation between each pair
of matched edges. Edge e is set as the edge matched
to the previously traversed one, while enforcing the
non-bridge condition during the matching process.
Arbitrary endpoints p ∈ V
G
and q ∈ V
G
, can be
specified for an Eulerian path by first inserting a fic-
titious edge (p,q) to G and then Eulerizing the graph
until no odd vertices remain in G. Removing edge
(p,q) will convert G from Eulerian to semi-Eulerian,
after which the path can be found by applying our
modified Fleury’s algorithm.
5.2 Hierarchical Graph to CLI
Before creating a CLI from the hierarchical graph H,
first we need to transform each basis graph accord-
ingly. For each edge (h
p
,h
c
) ∈ E
H
, the transformation
matrix A(h
c
) for a child graph G(h
c
) is given by
A(h
c
) = A(h
p
)T(h
c
)R(h
c
)S(h
c
) (1)
where T(h
c
), R(h
c
) and S(h
c
) are the translation, ro-
tation and scaling matrices of G(h
c
) relative to G(h
p
).
Computing a CLI from H can then be achieved
by combining all graphs into a single one by insert-
ing linking edges accordingly, semi-Eulerizing the re-
sulting graph, and finally computing an Eulerian path
as described in Section 5.1. This approach, however,
might introduce unwanted changes in the CLI as de-
scribed in the next section.
1
A bridge is an edge whose removal would disconnect
the graph into two different components.
5.3 Coherence Across Hierarchy Levels
Although a CLI can be obtained from a hierarchical
graph by following the strategy in Section 5.2, this
could result in changes to the overall structure of the
CLI each time a graph is assigned or transformed rel-
ative to its parent as shown in Figure 4. This becomes
an issue if we would like to generate several CLIs with
the same orientation and endpoints, e.g., for making
CLI-based keyframe animations. The problem is due
to the process not considering the hierarchical rela-
tionships when computing the Eulerian path. This can
be alleviated by taking the following steps:
1. Compute an Eulerian path in the root graph.
2. Modify each child graph according to this path.
3. Obtain a set of paths that collectively traverse
through all edges of the child graph.
4. Insert each of these paths into the Eulerian path of
the parent accordingly.
The path in Step 1 can be obtained by applying the
process described in Section 5.1. The remaining steps
are explained throughout the rest of this section.
5.3.1 Child Graph Modification
An Eulerian path of a parent graph G(h
p
) can traverse
through a vertex v ∈ V
G(h
p
)
any number of times in
different directions. For example, if v has four neigh-
bors v
1
,v
2
,v
3
,v
4
∈ V
G(h
p
)
, the path could first traverse
through v from v
1
to v
3
and then from v
2
to v
4
. Let
us suppose that G(h
p
) and G(h
c
) are related through
an edge e
h
= (h
p
,h
c
) ∈ E
H
with a multiple link rela-
tion, and that v = v
p
(e
h
) in this example. This means
that, if we replace v for G(h
c
), then the path should
first enter G(h
c
) from a vertex u
1
∈ V
G(h
c
)
, which
is connected to v
1
through a linking edge, and then
exit it through a vertex u
3
∈ V
G(h
c
)
, which is con-
nected to v
3
. The second time the path visits G(h
c
), it
should enter it from a vertex u
2
and leave it through
GRAPP2013-InternationalConferenceonComputerGraphicsTheoryandApplications
134
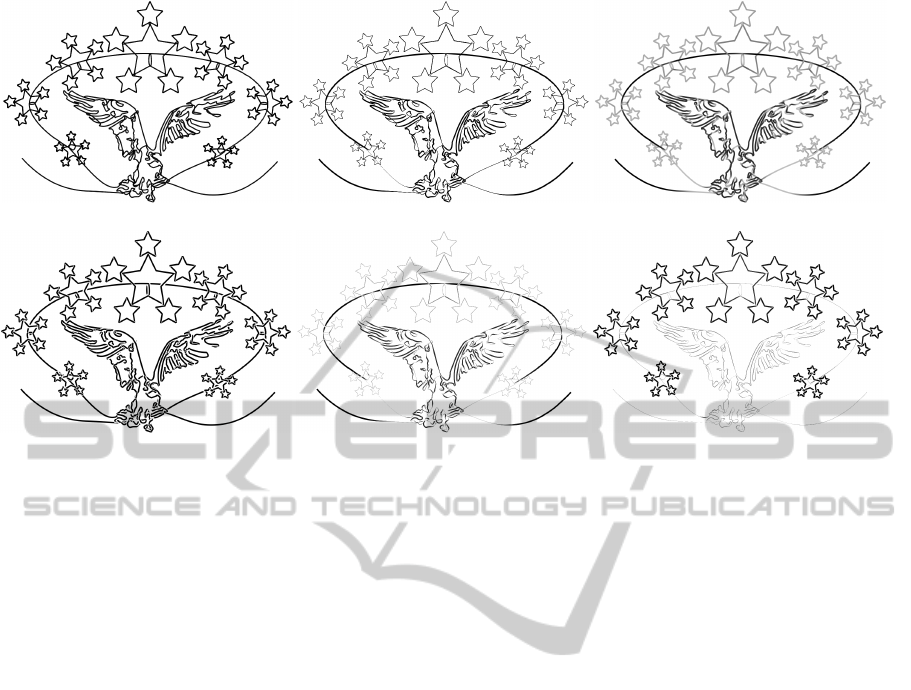
(a) No effects (b) Variable width (c) Variable intensity
(d) Halos (e) Width + intensity + halos (f) Inverted hierarchical level factor
Figure 5: Hierarchy-based visual enhancements. (a) A CLI drawn with uniform thickness and color. The CLI can be rendered
with (b) variable width, (c) variable intensity or (d) halos along the line. (e) These enhancements can be combined for
obtaining CLIs with multiple effects. (f) The way in which the hierarchy influences each effect can be controlled freely.
a vertex u
4
. In this case, the way in which the path
traverses through v defines a set of endpoint pairs
Q = {(u
1
,u
3
),(u
2
,u
4
)} for graph G(h
c
).
If G(h
c
) has only one pair of endpoints (p,q)
assigned to it, the graph is not modified. Oth-
erwise, if two or more endpoint pairs Q =
{(p
1
,q
1
),...,(p
n
,q
n
)} are assigned to G(h
c
), we per-
form a process similar to the one described in Sec-
tion 5.1 for specifying arbitrary endpoints for the
paths. We insert several fictitious edges (p
i
,q
i
) into
G(h
c
), Eulerize the graph, and then remove all edges
(p
i
,q
i
) from G(h
c
), thus making the vertices in Q the
only odd vertices of the graph.
5.3.2 Covering a Graph with a Set of Paths
The goal now is to compute a set of paths P =
{P(p
1
,q
1
),...,P(p
n
,q
n
)} for each (p
i
,q
i
) ∈ Q, so
that P covers all edges in G(h
c
). We employ a com-
bined version of Fleury’s and Hierholzer’s algorithm
in order to achieve this. Hierholzer’s algorithm for a
semi-Eulerian graph G(V,E) consists in the follow-
ing (Hierholzer and Wiener, 1873):
1. Obtain a path P(s,t) between the two vertices of
odd degree s,t ∈ V in G.
2. For a vertex v ∈ P(s,t) with adjacent edges
(u,v) /∈ P(s,t), compute a cycle C(v) by starting at
v and traversing only through edges not included
in P(s,t) until returning to v.
3. Insert C(v) into P(s,t) at vertex v ∈ P(s,t).
4. Return to Step 2 until P(s,t) covers all edges in G.
In other words, a path between the two odd ver-
tices is computed first, and then the Eulerian path is
finished by appending cycles to the path until it con-
tains all edges in G. The algorithm can be modified
for our purposes in the following manner:
1. Copy G(h
c
) into a graph G
0
(h
c
).
2. For each (p
i
,q
i
) ∈ Q, insert a set of directed edges
{(q
i
, p
j
),(q
i
,q
j
) | i 6= j} in G(h
c
).
3. Find a path P(p
i
,q
i
) by partially applying the ex-
tended Fleury’s algorithm (Section 5.1) from p
i
until reaching q
i
in G(h
c
).
4. Remove all edges (u, v) ∈ P(p
i
,q
i
) from G
0
(h
c
)
whose removal will not disconnect G
0
(h
c
).
5. Copy G
0
(h
c
) into G(h
c
).
6. Repeat from Step 2 for the next (p
i
,q
i
) ∈ Q.
7. For a vertex v ∈ P(p
i
,q
i
) with adjacent edges
(u,v) /∈ P, find a cycle C(v) by using the extended
Fleury’s algorithm from v and traversing through
edges not included in P until returning to v.
8. Insert C(v) into P(p
i
,q
i
) at vertex v.
9. Repeat from Step 7 for different P(p
i
,q
i
) ∈ P until
P covers all edges in G(h
c
).
Essentially, we have applied Hierholzer’s algo-
rithm for multiple pairs of odd vertices, and replaced
both the initial path and subsequent cycle computa-
tions by the extended Fleury’s algorithm, so that the
HierarchicalDesignofContinuousLineIllustrations
135

final path tends to avoid drastic changes in curvature.
The insertion of directed edges in Step 2 is performed
in order to fulfill the non-bridge condition during the
edge selection step of Fleury’s algorithm. Note these
edges are not inserted in G
0
(h
c
), whose purpose is to
ensure the graph connectivity in the next iteration.
5.3.3 Inserting the Paths into the Eulerian Path
The next step is to insert the set of computed paths for
G(h
c
) into the Eulerian path of its parent graph G(h
p
).
This is done by replacing all instances of v
p
(e
h
) in
the Eulerian path for the appropriate computed paths.
In this way, we can assign several child graphs to a
parent graph, without changing the overall structure
of the final CLI.
6 CLI RENDERING
Several strategies for rendering CLIs were proposed
in (Wong and Takahashi, 2011), such as trimming the
line segments of the Eulerian path, the inclusion of
curl and cusp features, among others. We extend this
work, by providing visual CLI enhancements based
on the hierarchical structure of our CLIs.
More specifically, we allow users to vary the
thickness and intensity of the line according to the hi-
erarchy. Edges of graphs at higher levels can be ren-
dered thicker (Figure 5(b)) and darker (Figure 5(c))
than those at lower levels, or vice-versa. In order to
achieve this, a hierarchical value is first assigned to
each point in the CLI, based on the level of its ba-
sis graph in the hierarchy, and then width and inten-
sity values for each point are computed according to
it. These values are interpolated along the neighbor-
hood of points in the CLI where the hierarchical level
changes, in order to achieve smooth transitions in the
thickness and intensity of the line. A triangle strip
is then created by computing points separated by half
of the specified width from each of the CLI points at
directions perpendicular to the line orientation, while
modulating the intensity of the line based on the pre-
viously computed values.
We also incorporate depth-dependent halos (Ev-
erts et al., 2009) in our CLIs, allowing the viewer to
better perceive the self-intersections in the line (Fig-
ure 5(d)). The depth of each point contained in the
CLI is given by its hierarchical level, thus portraying
lines at higher hierarchies as if traced on top of those
at lower levels. Multiple visual enhancements can be
applied to any of our CLIs, as shown in Figure 5(e),
and the way in which each effect is influenced by the
hierarchy of the CLI can be adjusted as well, allowing
Table 1: Computation times of CLI generation.
Figure 6(c) Figure 6(d) Figure 7(b)
Path Computations
2
0.167s 1.260s 0.762s
Path Mergings
3
0.123s 0.331s 0.055s
Rendering 0.108s 0.488s 0.303s
Total 0.398s 2.079s 1.120s
Number of Graphs 11 26 4
Total Edge Count 292 4514 3094
2
Time spent in semi-Eulerization and Eulerian path computations.
3
Time spent in merging paths of child graphs with the Eulerian paths of their parents.
us to emphasize edges at higher or lower levels as we
like (Figure 5(f)). Linking edges in our approach are
drawn as Catmull-Rom splines (Catmull and Rom,
1974), and are rendered thinner, lighter and at lower
depths than other edges, in order to keep them from
standing out in the illustration.
7 RESULTS AND DISCUSSION
Our prototype system was implemented in C++ on an
Intel Core 2 Duo E6550 2.33 Ghz CPU with 2 GB
of RAM. Table 1 summarizes the computation time
statistics for generating some of the CLI examples
presented in this paper by using this setup. As can
be seen, generating a CLI takes just a few seconds,
even for hierarchical graphs that contain a large total
number of edges. Several results of our approach can
be seen in Figures 1, 5, 6 and 7.
Figures 5(a), 6(a), 6(b) and 7(a) portray CLIs with
uniform thickness and color, while Figures 5(e), 6(c),
6(d) and 7(b) show their respective versions after ap-
plying the hierarchy-based enhancing effects intro-
duced in Section 6. As can be seen, these effects
greatly improve the visualization and aesthetics of our
CLIs. This is better appreciated in Figure 6(d), where
the musical note on top of the tree is clearly visible
and the depth perception of the grass is enhanced,
as opposed to its regular CLI version shown in Fig-
ure 6(b). The same can be said of Figure 7(b), in
which the buildings give the illusion of being located
far away, while the bridge gives the impression of be-
ing placed nearer to the viewer. Our hierarchical CLIs
are good for designing logos such as the one shown in
Figures 6(a) and 6(c), and can also be used for por-
traying text as a single line (Figure 7(c)).
8 CONCLUSIONS
A framework for designing complex continuous line
illustrations that portray different objects with a sin-
gle line has been proposed in this paper. We employed
an approach based on the use of a hierarchical graph
GRAPP2013-InternationalConferenceonComputerGraphicsTheoryandApplications
136
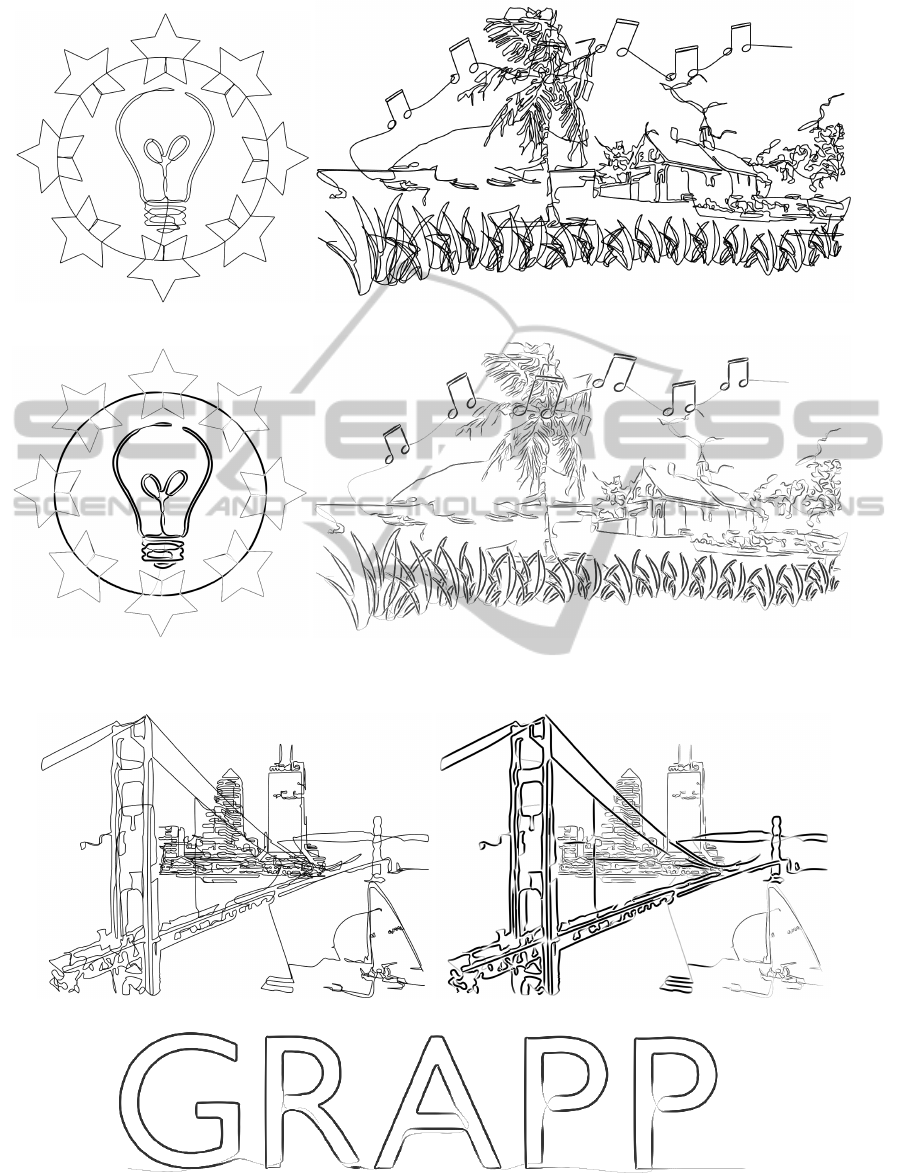
(a) (b)
(c) (d)
Figure 6: Hierarchical CLI results generated with our approach.
(a) (b)
(c)
Figure 7: More hierarchical CLI results.
HierarchicalDesignofContinuousLineIllustrations
137

that models the relationships between different basis
graphs, which represent the objects portrayed in the
final illustration. We have given detailed explanation
as to how to obtain a CLI from one of such hierar-
chical graphs, while at the same time preserving the
coherence of the CLI independently of the number of
graphs specified in the hierarchical graph structure.
Visual enhancements based on the hierarchy of the
CLI can also be achieved in our approach.
Our CLIs often seem to contain either too few or
too many features in them, due to the image-to-graph
conversion process employed in our approach being
based on edge detection techniques, which are prone
to subdetection and overdetection of edges. Although
our system allows users to modify the set of detected
edges prior to generating a graph, this is a particu-
larly daunting task for a large number of edges. The
amount of line thickness variation supported by our
system is also limited, resulting in visual artifacts ap-
pearing along the line as the thickness increases. This
could be alleviated to some extent by applying tech-
niques for avoiding and correcting folds in skeletal
strokes to our CLIs (Hsu et al., 1993; Asente, 2010).
As future work, we would like to apply this ap-
proach for generating CLI-based animations, as well
as to incorporate ideas from previous works (Bosch
and Herman, 2004; Kaplan and Bosch, 2005; Wong
and Takahashi, 2009) for producing illustrations that
portray both the contours and the shading of the im-
age. We also would like to explore ways to effectively
include color into our illustrations, as well as to allow
the placement of text along the line (Surazhsky and
Elber, 2000; Maharik et al., 2011).
REFERENCES
Asente, P. J. (2010). Folding avoidance in skeletal strokes.
In Proceedings of the Seventh Sketch-Based Interfaces
and Modeling Symposium, pages 33–40. Eurographics
Association.
Bosch, R. and Herman, A. (2004). Continuous line draw-
ings via the traveling salesman problem. Operations
Research Letters, 32(4):302–303.
Catmull, E. and Rom, R. (1974). A class of local interpo-
lating splines. In Computer Aided Geometric Design,
pages 317–326.
Everts, M. H., Bekker, H., Roerdink, J. B. T. M., and Isen-
berg, T. (2009). Depth-dependent halos: Illustrative
rendering of dense line data. IEEE Transactions on
Visualization and Computer Graphics, 15(6):1299–
1306.
Fleury, M. (1883). Deux problemes de geometrie de situa-
tion. Journal de Mathematiques Elementaires, pages
257–261.
Fritz, L. L. (2001). 250 Continuous-Line Quilting Designs
for Hand, Machine & Long-Arm Quilters. C&T Pub-
lishing, Inc.
Gross, J. L. and Yellen, J. (2005). Graph Theory and Its
Applications, Second Edition (Discrete Mathematics
and Its Applications). Chapman & Hall/CRC.
Hierholzer, C. and Wiener, C. (1873). Ueber die
M
¨
oglichkeit, einen Linienzug ohne Wiederholung und
ohne Unterbrechung zu umfahren. Mathematische An-
nalen, 6(1):30–32.
Hsu, S. C., Lee, I. H. H., and Wiseman, N. E. (1993). Skele-
tal strokes. In Proceedings of the 6th annual ACM
symposium on User interface software and technol-
ogy, pages 197–206. ACM.
Kaplan, C. S. and Bosch, R. (2005). TSP Art. In Proceed-
ings of Bridges 2005, Mathematical Connections in
Art, Music and Science, pages 301–308.
Lindsay, R. A. (2010). Rachel Ann Lindsay - illustrator.
http://www.rachelannlindsay.com/.
Lohman, S. (2009). LineArtGallery.com.
http://www.lineartgallery.com/.
Maharik, R., Bessmeltsev, M., Sheffer, A., Shamir, A., and
Carr, N. (2011). Digital micrography. ACM Transac-
tions on Graphics, 30(4):100:1–100:12.
Morales, J. E. (2005). Virtual Mo.
http://www.virtualmo.com/.
Nicola
¨
ıdes, K. (1990). The Natural Way to Draw. Houghton
Mifflin Company, Boston, Massachusetts, USA.
Pedersen, H. and Singh, K. (2006). Organic labyrinths and
mazes. In NPAR ’06: Proceedings of the 4th inter-
national symposium on Non-photorealistic animation
and rendering, pages 79–86. ACM.
Sable, P. (2009). Single line artwork by Pamela Sable.
http://www.pameline.com/.
Slater, G. (2001). Geoff Slater: Contemporary artist.
http://www.geoffslater.com/.
Surazhsky, T. and Elber, G. (2000). Arbitrary precise orien-
tation specification for layout of text. In Proceedings
of the 8th Pacific Conference on Computer Graphics
and Applications, pages 80–86. IEEE Computer Soci-
ety.
Wong, F. J. and Takahashi, S. (2009). Flow-based auto-
matic generation of hybrid picture mazes. Computer
Graphics Forum, 28(7):1975–1984.
Wong, F. J. and Takahashi, S. (2011). A graph-based
approach to continuous line illustrations with vari-
able levels of detail. Computer Graphics Forum,
30(7):1931–1939.
GRAPP2013-InternationalConferenceonComputerGraphicsTheoryandApplications
138
