
Diagnosing Chronic Obstructive Pulmonary Disease
with Artificial Neural Networks using Health Expert Guidelines
Maria Ang
´
elica de Oliveira Camargo-Brunetto
1
and Andr
´
e R. Gonc¸alves
2
1
Computer Science Department, State University of Londrina, Londrina, Paran
´
a, Brazil
2
School of Electrical and Computer Engineering, University of Campinas, Campinas, S
˜
ao Paulo, Brazil
Keywords:
Decision Support System, Artificial Neural Networks, COPD, Multilayer Perceptron, Radial Basis Function,
Least Mean Squares.
Abstract:
Chronic Obstructive Pulmonary Disease (COPD) is characterized by airflow limitation and the spirometry is
one of the tests that can be used to detect such disease. However there is a great problem related to the different
ways of interpreting the values provided by spirometric devices, regarding different guidelines and reference
values. Artificial Neural Networks (ANN) can be used to help with tasks of diagnosis as that. This work
presents the modeling and analysis of three ANN models to classify subjects with COPD, based on different
sets of variables: a set of observed measures from spirometry and a set of interpreted values according to the
guideline proposed by the American Thoracic Society. The results shown that it is possible to achieve a good
accuracy in the diagnosis of COPD using ANNs, besides these features set conducted the COPD identification
problem to a nearly linearly separable classification problem.
1 INTRODUCTION
According to the Global Initiative for Chronic Ob-
structive Lung Disease (GOLD), Chronic Obstructive
Pulmonary Disease (COPD) is a disease state char-
acterized by airflow limitation that is not fully re-
versible. In (Group, 2004), it is reported that COPD
is placed just after cardiovascular and neoplastic dis-
eases as a leading cause of death and morbidity. It
also implies a high rate of medical services, as well as
hospitalization, frequently, for a long time (Lenfant,
1998).
Diagnosing and monitoring progression of COPD
is commonly done by spirometry, considered the gold
standard for such tasks. However, differences in the
definition of COPD and consensus statements make it
difficult diagnosing, as pointed out by (Nathell et al.,
2007). In this paper, the authors reported that the
use of the European Respiratory Society Guidelines
(ERS) has proved to be more effective in detecting pa-
tients with COPD than other guidelines, as the GOLD
COPD-criteria and the NICE COPD-criteria. The au-
thors also show how the COPD diagnosis is highly
dependent on the which guidelines are used for defin-
ing the disease.
Artificial Neural Networks (ANN) have been
commonly used as classifiers or predictors in several
fields of knowledge, including biomedicine. They
can be applied in clinical medicine, physiological
sign processing and medical image processing. Pas-
sold et al. (Passold et al., 1996) resume the ben-
efits of ANN applied in biomedicine in three main
points: (i) Simulation of human reasoning in diagno-
sis, based on a given data set; (ii) Learning ability in a
self-organized way; and (iii) High performance when
compared to statistical methods. The task of diagnos-
ing diseases, which present some level of difficulty for
human consensus, has been successfully solved using
ANN (Zhou and Jiang, 2003), (Wadie et al., 2006),
(Yan et al., 2006), and (Mehrabi et al., 2009).
In this context, the aim of this article is to study
three ANN models to classify subjects with COPD,
based on different sets of variables: a set of observed
measures from spirometry and a set of interpreted val-
ues according to the guideline proposed by the Amer-
ican Thoracic Society, that is commonly included in
the software provided by many spyrometers.
The remaining of the paper is structured as fol-
lows: Section 2 presents related work, Section 3 de-
scribes the ANN modeling. The performance of each
model is analyzed in Section 4. Conclusions and fu-
ture work are presented in Section 5.
207
de Oliveira Camargo-Brunetto M. and R. Gonçalves A..
Diagnosing Chronic Obstructive Pulmonary Disease with Artificial Neural Networks using Health Expert Guidelines.
DOI: 10.5220/0004234102070214
In Proceedings of the International Conference on Health Informatics (HEALTHINF-2013), pages 207-214
ISBN: 978-989-8565-37-2
Copyright
c
2013 SCITEPRESS (Science and Technology Publications, Lda.)

2 RELATED WORKS
Fontenla-Romero et al. (Fontenla-Romero et al.,
2005) presented a new method to classify sleep ap-
nea as: obstructive, central or mixed. However, this
classification method requires to analyze a large num-
ber of variables during a long time. So, the inputs of
the neural network were pre-processed by applying a
discrete wavelet transformation on the samples, aim-
ing to reduce and to fix the number of inputs of the
classifier.
Basically, the authors used wavelets to extract fea-
tures from the recorded signals, that become the input
of a feed-forward ANN in order to do the classifica-
tion. Three learning algorithms were used. Conjugate
Gradient Method was employed to adjust the weights
and the quadratic mean error as the cost function. A
similar algorithm, adds a regularization term to avoid
hyper-training. Finally, a learning algorithm uses a
Bayesian framework and a cross-entropy error func-
tion. The latter showed to be the best choice, with an
accuracy of 83.78%±1.90%.
Er and Temurtas (Er and Temurtas, 2008) present
a comparative study for the realization of the COPD
diagnosis using multilayer neural networks. The
authors applied two different Multilayer Perceptron
(MLP) structures: one with one hidden layer and the
other with two hidden layers. The COPD dataset
was taken from the Diyarbakir Chest Diseases Hos-
pital from Southeast of Turkey. The dataset con-
tains 155 samples, where 55 are COPD and 100 nor-
mal. They analyzed 38 features from laboratory ex-
amination. Accuracy of 93.14% was obtained for an
MLP ANN with one hidden layer and backpropaga-
tion algorithm with momentum constant. Using the
Levenberg-Marquardt learning algorithm, the accu-
racy achieved was 94.46%. Best results were obtained
using MLP with two hidden layers, where the accura-
cies for same learning algorithms were 95.43% and
96.08%.
Mehrabi et al (Mehrabi et al., 2009) used a
MLP and a Radial Basis Function Neural Network
(RBFNN) to classify patients with COPD and Con-
gestive Heart Failure (CHF). They analyzed 266 pa-
tients, being 129 with CHF and 137 with COPD. It
was considered 42 clinical variables. A ten-fold cross
validation was used to assess the generalization of the
classification models and the results obtained were:
MLP sensitivity of 83.9% and specificity of 86%, with
AUC (Area under the ROC curve) of 0.889 ±0.002;
RBFNN sensitivy of 81.8% and specificity of 88.4%,
with AUC of 0.924 ±0.01.
Er et al (Er et al., 2010) analyzed several classi-
fiers in order to classify patients among the follow-
ing chest diseases: COPD, Pneumonia, Asthma, Tu-
berculosis and Lung Cancer Diseases. The following
models were used: MLP (with one and two hidden
layers), without and with momentum; Probabilistic
Neural Network, Generalized Regression Neural Net-
work, Learning Vector Quantization and RBFNN. A
sample of 357 patients was analyzed, where 71 with
COPD, 50 with Tuberculosis, 60 with Pneumonia, 44
with asthma, 32 with lung cancer, and 100 normal.
It was used 38 variables as input for all ANN mod-
els. For the COPD diagnosis, the best results were
obtained with MLP with two hidden layers and Prob-
abilistic Neural Network, with accuracy of 88.73%.
The results achieved with the application of ANN
as classifiers of diseases have encouraged researchers
study and to apply such models to help with tasks of
COPD diagnosis. COPD is a chronic disease that re-
quires constant care as well as knowledge of its sever-
ity, that is normally done by spirometry. Normally,
the devices that perform such exam have softwares
that provide different reference values and guidelines
to identify the degree of normality of the subject.
Since COPD diagnosing is highly dependent on the
guideline used for detecting it, ANN could be an al-
ternative to help health care professionals to classify
subjects with COPD.
3 ANN MODELING FOR COPD
IDENTIFICATION
This research considered three ANN models based
on supervised learning: a linear ANN using the
LMS algorithm, a Multilayer Perceptron with back-
propagation algorithm and a Radial Basis Function
Neural Network. A detailed description of each one
is presented in Section 3.3. The physiologic measures
used for this study were obtained from pulmonary
function test and performed at the Physiotherapy Pul-
monary Laboratory at State University of Londrina,
Brazil.
3.1 Obtaining the Physiological
Measures
The pulmonary function test is composed of several
exams that provide information about the pulmonary
capacity of a subject. It is composed of spirome-
try, ventilometry, and measures of the inspiratory and
expiratory pressures. The spirometry measures the
volume, capacity, and pulmonary flow, from respi-
ratory maneuver and compares them with reference
values of normality to the evaluated population. For
HEALTHINF2013-InternationalConferenceonHealthInformatics
208

all volumes and capacities measured by the spirom-
etry, there are reference tables, which predict values
are based on regression equations. Several guidelines
and normality standards have been proposed by scien-
tific societies e.g. ATS (American Thoracic Society),
ERS (European Respiratory Society), ALATS (Amer-
ican Latin Thoracic Society), and others. Nowadays,
the spirometry has been used in the respiratory phys-
iotherapy as a complementary exam and has been
showed very helpful to physiodiagnosis and to plan
a therapeutic program. The spirometer used in this
work provides a few options of reference values, and
the ATS pattern was selected by the healthcare pro-
fessional that did the exam (Azeredo, 2002).
The obtained values by spirometry provide rich in-
formation about the pulmonary function, helping to
identify and to qualify the severity of several venti-
latory disturbs that are observed by changes in the
spirometric values. It must be remembered that the
interpretation of the results is highly dependent on
the guideline used. The physiological measures used
in this study were: Forced Vital Capacity (FVC),
Forced Expiratory Volume at the first minute (FEV1),
Pick Expiratory Flow (PEF), Forced Expiratory Flow
(FEF), Maximum Voluntary Ventilation (VVM), Min-
imum Inspiratory Pressure (MIP), and Maximal Ex-
piratory Pressure (MEP). Besides those measures, the
variables gender, age, and body mass index were also
taken into account.
3.2 Identifying Inputs and Output
Variables
The physiological measures used were taken from
222 patients, being 80 with COPD (declared by phys-
iotherapists that work in rehabilitation program with
them based on clinical exams and spirometry). The
clinical and spirometry data derived two datasets for
training and testing of different ANN models con-
sidered in our experiments. The first dataset (S1)
was created with the following variables as input:
age, gender, body mass index, FVC(o), FEV1(o),
PEF(o), FEF 25-75 %(o), Maximal Ventilatory Vol-
ume (MVV(o)), Maximal Inspiratory Pressure (MIP
(o)), and Maximal Expiratory Pressure (MEP(o)).
The notation (o) means the obtained values by the
spirometry. The second dataset (S2) was defined by
the quotient between the measured and the expected
value for a normal subject (considering its gender and
age) following normality equations proposed by ATS,
being each input pattern composed of five variables:
FVC (%), FEV1(%), PEF(%), FEF25-75%(%), and
MVV(%). The input variables were normalized to
values between 0 and 1, including the variables age,
gender (binary digits 0 and 1) and body mass index.
As all ANN models used in this research are based
on supervised learning, the output answer of each in-
put is also included in the pattern representation. Two
classes were defined: Normal subject and COPD sub-
ject, represented by the binary digits 0 and 1, respec-
tively.
3.3 ANN Architectures Analyzed
To devise this research three different ANN architec-
tures were designed to perform the classification task,
namely: Linear Neuron with the Least Mean Square
(LMS) learning algorithm, Multilayer Perceptron and
Radial Basis Function ANN. This section describes
the modeling of each architecture and the results de-
scribing the performance of the ANNs are presented
in the next section.
Methodology for the Learning Process. For the
ANNs performance evaluation, a ten-fold cross-
validation method was used. Data was divided into
ten folds and the training was repeated ten times.
Each time, we applied nine folds for ANN training
and the remaining fold for validation. The final accu-
racy was obtained by the average results over the ten
validation folds.
For all ANNs, the initial values of the synap-
tic weights were set to random values between
[-0.05,0.05].
To obtain a proper number of epochs for the ANNs
training, the following methodology was used: ini-
tially it was established an arbitrary upper bound for
the number of epochs. Then, for each epoch, it was
computed the mean square error (MSE) of the out-
puts, for the training set as well as for the validation
one. Analyzing the MSE curve of validation and the
MSE curve of training it was possible to determine
if the number of epochs was suitable or should in-
crease. Nevertheless, if during the training an indica-
tive of overtraining is detected (by analyzing the MSE
curve of validation), the training is promptly stopped.
This approach pointed out that an upper bound for the
number of training epochs equal to 100 was sufficient
for training the three studied ANNs, considering our
datasets.
3.3.1 Linear ANN
This ANN is composed of only one linear neuron,
which output is given by the result of the linear com-
bination of synaptic weights and inputs, plus bias.
Here, this linear ANN was trained via the Least Mean
DiagnosingChronicObstructivePulmonaryDiseasewithArtificialNeuralNetworksusingHealthExpertGuidelines
209

Squares (LMS) algorithm developed by Widrow and
Hoff (Widrow and Hoff, 1960).
3.3.2 Multilayer Perceptron
The Multilayer Perceptron (MLP) is one of the most
studied ANN models. Its importance comes from the
addition of hidden layers and the use of a nonlinear
activation function (typically a sigmoid function) that
allows the ANN deal with problems which classes are
non-linearly separated. Both MLPs have one input
layer, one hidden layer and one output layer. The
number of neurons used at the input layer is the same
of the number of variables (10 to the S1 and 5 to the
S2) plus one for the bias. MLPs with different num-
bers of neurons in the hidden layer were tested, vary-
ing from 2 to 20, and that one with better performance
was selected. Evaluation criteria for the classifiers’
performance is presented in Section 3.4.
Training and Testing the MLPs. During the train-
ing phase, weights and bias of each MLP are updated
according to the scaled conjugate gradient (SCG)
method (Møller, 1993). SCG belongs to the class of
Conjugate Gradient Methods (CGMs) and has been
shown to be considerably faster than standard back-
propagation and other CGMs (Møller, 1993). Another
important advantage is that SCG is fully automated
including no user dependent parameters. The activa-
tion function used was the sigmoid logistic.
3.3.3 Radial Basis Function
A Radial Basis Function Neural Network (RBFNN)
is composed of an input layer, a hidden layer, and an
output layer. Just as in the two previous ANN models,
at the input layer, the number of neurons is equal to
the number of features. The hidden layer consists of
an arbitrary number of RBFs (e.g. Gaussian RBFs),
being each one defined by a center position and a dis-
persion parameter (σ). The output layer is formed by
neurons that promote a linear combination of the ac-
tivations of the hidden layer neurons.
As for the previous ANNs, we designed two Ra-
dial Basis Function (RBF) networks for the classifi-
cation of the sets S1 and S2, with input layer with 10
and 5 neurons, respectively, plus bias.
Training and testing the RBFNN. The RBFNN
training process was that one implemented by the
MATLAB Neural Network toolbox, which consists
of: (i) starting with no one neuron, the network is sim-
ulated; (ii) the input vector with the greatest error is
selected; (iii) a neuron is added to the hidden layer
with weights equal to that input vector and; finally,
(iv) the output layer weights are redesigned to min-
imize error. So, an upper bound value for the num-
ber of hidden layer neurons must be provided. Look-
ing for a better performance, a grid search procedure
was performed, varying the number of hidden neurons
from 5 to 30.
The values of the dispersion parameter σ were set
in an arbitrary way, receiving changes and combina-
tions at each simulation.
3.4 Evaluating Classifiers’ Performance
Four performance metrics were taken into considera-
tion in our analysis, namely: area under curve (AUC),
specificity, sensitivity and, accuracy.
AUC is obtained by the integration of the Receiver
Operating Characteristics (ROC) curve over a set of
thresholds considered. ROC is a technique to visual-
ize, organize and analyze the classifier performance
by means of the False positive rate and True positive
rate relation, given a set of thresholds. Since AUC is a
portion of the area of the unit square, its value will al-
ways be between 0 and 1.0. AUC also has important
statistical properties and is related to other metrics,
such as Gini coefficient (Fawcett, 2006).
Sensitivity and specificity are one approach to
quantifying the separation ability of the classifier.
While the former is the proportion of true negatives
that are correctly identified by the test, the latter de-
scribes the proportion of true negatives that are cor-
rectly identified by the classifier.
Accuracy, in turn, is defined by the ratio of the
number of correct classifications to the number of pat-
terns tested.
Simulation results for MLP and RBFNN were
obtained using MATLAB R2010b Neural Network
Toolbox, whereas the linear ANN with LMS algo-
rithm was implemented by the authors on the same
platform.
4 RESULTS AND DISCUSSION
This section presents the results for simulations of the
three ANNs modeled. The results are presented in
terms of mean and standard deviation over 30 inde-
pendent runs. These results were obtained, consider-
ing a lower bound of acceptance of 0.5, i.e., if a lower
bound of 0.5 is established, outputs from 0.5 on are
classified as “1”.
HEALTHINF2013-InternationalConferenceonHealthInformatics
210

4.1 Results of Linear ANN
Tables 1 and 2 present the results for dataset S1 and
S2, respectively. The best results are those with high-
lighted background.
It was observed, from Table 1, that values of learn-
ing rate µ outside [0.01;0.7] decrease the performance
of the ANN, but inside this interval, the performance
keeps stable, achieving the best AUC equal to 0.971
(± 0.04), with µ = 0.5.
Table 1: Means and standard deviations of the four metrics
evaluated from the results of Linear ANN with dataset S1,
using different values for parameter µ.
µ AUC Accuracy Spec. Sens.
0.01
0.968 94.71% 89.29% 97.78%
(±0.04) (±4.45%) (±11.27%) (±4.43)
0.1
0.971 95.50% 91.29% 97.87%
(±0.04) (±4.03%) (±10.26%) (±3.53%)
0.3
0.965 95.79% 92.08% 97.88%
(±0.04) (±4.08%) (±9.85%) (±3.58%)
0.971 96.03% 92.88% 97.82%
0.5
(±0.04) (±3.69%) (±8.84%) (±3.71%)
0.7
0.957 93.64% 88.92% 96.29%
(±0.05) (±5.36%) (±12.65%) (±5.57%)
0.9
0.826 73.04% 77.08% 70.76%
(±0.16) (±18.15%) (±26.75%) (±32.56%)
Although the results of linear ANN for the dataset
S2 were stable for all values for the parameter µ an-
alyzed (Table 2), it is possible to observe a high fre-
quency of decrease in terms of accuracy and sensitiv-
ity. Conversely, we can observe an increase in terms
of specificity.
Table 2: Means and standard deviations of the four metrics
evaluated from the results of Linear ANN with dataset S2,
using different values for parameter µ.
µ AUC Accuracy Spec. Sens.
0.01
0.970 94.51% 96.00% 91.88%
(±0.03) (±4.41%) (±5.09%) (±9.97%)
0.1
0.965 94.19% 95.21% 92.38%
(±0.04) (±4.52%) (±5.43%) (±10.21%)
0.970 94.85% 95.73% 93.29%
0.3
(±0.04) (±4.45%) (±5.60%) (±8.57%)
0.5
0.968 94.13% 94.62% 93.25%
(±0.03) (±4.55%) (±5.85%) (±8.75%)
0.7
0.969 94.57% 95.01% 93.79%
(±0.04) (±4.48%) (±5.43%) (±8.64%)
0.9
0.968 94.41% 94.69% 93.92%
(±0.03) (±4.40%) (±5.85%) (±8.14%)
According to these good results achieved by the
linear model, it is possible to infer that with both sets
of selected variables, S1 and S2, lead to a nearly lin-
early separable classification problem.
4.1.1 Results of MLP
Tables 3 and 4 present the results obtained by the Mul-
tilayer Perceptron with different number of hidden
neurons using datasets S1 and S2, respectively. The
best results are those with highlighted background.
As mentioned in Section 3.3, MLPs with different
numbers of neurons in the hidden layer were tested,
varying from 2 to 20. Nevertheless, we present the
results for those that led to the best performances.
Table 3: Means and standard deviations of the four metrics
evaluated from the results of MLP with dataset S1, consid-
ering different numbers of hidden neurons.
hidden
AUC Accuracy Spec. Sens.
neurons
5
0.963 95.21% 91.42% 97.34%
(±0.04) (±4.12%) (±9.04%) (±4.37%)
6
0.965 95.28% 91.29% 97.53%
(±0.04) (±3.91%) (±9.90%) (±3.97%)
7
0.963 95.16% 91.00% 97.51%
(±0.04) (±4.44%) (±10.73%) (±4.00%)
8
0.960 94.86% 90.12% 97.51%
(±0.05) (±4.51%) (±11.38%) (±3.92%)
0.966 95.63% 92.17% 97.58%
9
(±0.04) (±3.99%) (±9.21%) (±4.27%)
We can see that MLP also has produced good and
stable results for both datasets. While a more com-
plex model, with 9 neurons, presented the best perfor-
mance for dataset S1, a simpler one, with 3 neurons,
achieved the best results for dataset S2.
Table 4: Means and standard deviations of the four metrics
evaluated from the results of MLP with dataset S2, consid-
ering different numbers of hidden neurons.
hidden
AUC Accuracy Spec. Sens.
neurons
0.965 95.14% 95.97% 93.67%
3
(±0.04) (±4.33%) (±5.22%) (±8.82%)
4
0.962 94.57% 95.22% 93.42%
(±0.04) (±4.51%) (±5.62%) (±8.58%)
5
0.962 94.38% 95.32% 92.71%
(±0.04) (±4.82%) (±5.57%) (±10.25%)
7
0.956 93.85% 94.69% 92.33%
(±0.04) (±4.69%) (±6.10%) (±10.15%)
8
0.963 94.92% 95.51% 93.88%
(±0.04) (±4.18%) (±5.47%) (±9.06%)
Even presenting similar performance in terms of
AUC for both dataset S1 and S2, we can identify de-
creases in the accuracy and sensitivity in dataset S2,
when compared with results obtained with dataset S1.
On the other hand, it is possible to notice an increment
in terms of specificity.
DiagnosingChronicObstructivePulmonaryDiseasewithArtificialNeuralNetworksusingHealthExpertGuidelines
211

4.1.2 Results of RBFNN
Tables 5 and 6 present the results of some combina-
tions of values to the parameters σ, using RBFNN
with dataset S1 and S2, respectively. As informed in
Section 3.3, we performed a grid search procedure to
find out a proper number of hidden neurons, varying
from 5 to 30. For each configuration, we varied the
dispersion parameter σ from 0.1 to 10. An RBFNN
with 15 hidden neurons has shown the best results.
Due to lack of space, we omitted the results of the
other experiments.
Table 5: Means and standard deviations of the four metrics
evaluated from the results of RBFNN with dataset S1, using
different values for parameter σ.
σ AUC Accuracy Spec. Sens.
0.1
0.908 89.05% 79.71% 94.32%
(±0.06) (±6.04%) (±16.04%) (±6.49%)
0.5
0.966 95.95% 92.58% 97.84%
(±0.04) (±3.77%) (±8.87%) (±3.69%)
1.0
0.969 96.21% 92.25% 98.44%
(±0.04) (±4.02%) (±9.61%) (±3.10%)
0.971 95.93% 92.42% 97.91%
10
(±0.03) (±4.00%) (±9.41%) (±3.71%)
Regarding the results presented in Table 5, higher
values of the dispersion parameter, particularly 1 and
10, presented the best performances in terms of AUC
and sensitivity.
Table 6: Means and standard deviations of the four metrics
evaluated from the results of RBFNN with dataset S2, using
different values for parameter σ.
σ AUC Accuracy Spec. Sens.
0.968 96.24% 96.11% 96.46%
0.1
(±0.04) (±3.63%) (±4.95%) (±6.74%)
0.5
0.964 95.61% 95.21% 96.33%
(±0.04) (±4.07%) (±5.75%) (±6.63%)
1.0
0.960 95.16% 95.03% 95.38%
(±0.05) (±4.27%) (±5.78%) (±7.30%)
10
0.961 95.09% 95.05% 95.17%
(±0.05) (±4.39%) (±5.63%) (±7.62%)
As already observed in the two previous ANN
models, the RBFNN also achieved similar perfor-
mance in terms of AUC for both dataset S1 and S2,
and a slight decrease in accuracy and sensitivity in
dataset S2, when compared with results obtained with
dataset S1. (Exception for σ = 0.1). Conversely, we
notice an increment in terms of specificity.
4.2 Comparing Models
In this section we present a statistical comparative
study of the three ANN architectures analyzed. This
study is conducted only looking at the values of AUC
and sensitivity. The reason for this is that AUC carries
more information about the classifier power, whereas
sensitivity is related to false negative rate - fnr (type
II error), through sens = (1 − f nr), which quantifies
cases where a patient is diagnosed as normal when
he actually is not, being so, a dangerous diagnosis.
Therefore, classifiers with high sensitivity (low fnr)
are preferable.
We carried out a one-tailed Student t -test with
a significance of 0.05 to compare the performance
of the classifiers which found the best results (high-
lighted background in tables) and the results are pre-
sented in Table 7.
Table 7: The t-test results regarding Alg.1 – Alg.2 is shown
as “+”, “–”, or “∼” when Alg. 1 is significantly better than,
significantly worse than, or statistically equivalent to Alg.
2, respectively.
t-test result
S1 S2
AUC Sens. AUC Sens.
LMS – RBF ∼ – ∼ –
RBF – MLP ∼ + ∼ +
MLP – LMS ∼ ∼ ∼ ∼
No significant difference between linear ANN
(LMS) and MLP was found for both AUC and sen-
sitivity. It is worth mentioning that MLP is a more
complex model and require a more computational in-
tensive learning process than the least mean square
algorithm.
RBFNN also did not present significant better per-
formance when compared to MLP and linear ANN in
terms of AUC, but produced classifiers with the high-
est sensitivity. Given these results, we could say that
RBFNN seems to be the first option to apply to the
COPD identification problem.
4.3 Comparing Feature Sets
We performed a statistical comparative study of
the classifiers’ performance over the two different
datasets, S1 and S2. The former, as described in
Section 3.2, consists of normalized raw data of three
non-physiological and seven physiological measures.
The latter considers five physiological measures that
incorporate previous knowledge from health experts.
The results are presented in Table 8.
It is possible to see that all classifiers lose the ca-
pacity of reduce false negatives when using the set of
HEALTHINF2013-InternationalConferenceonHealthInformatics
212
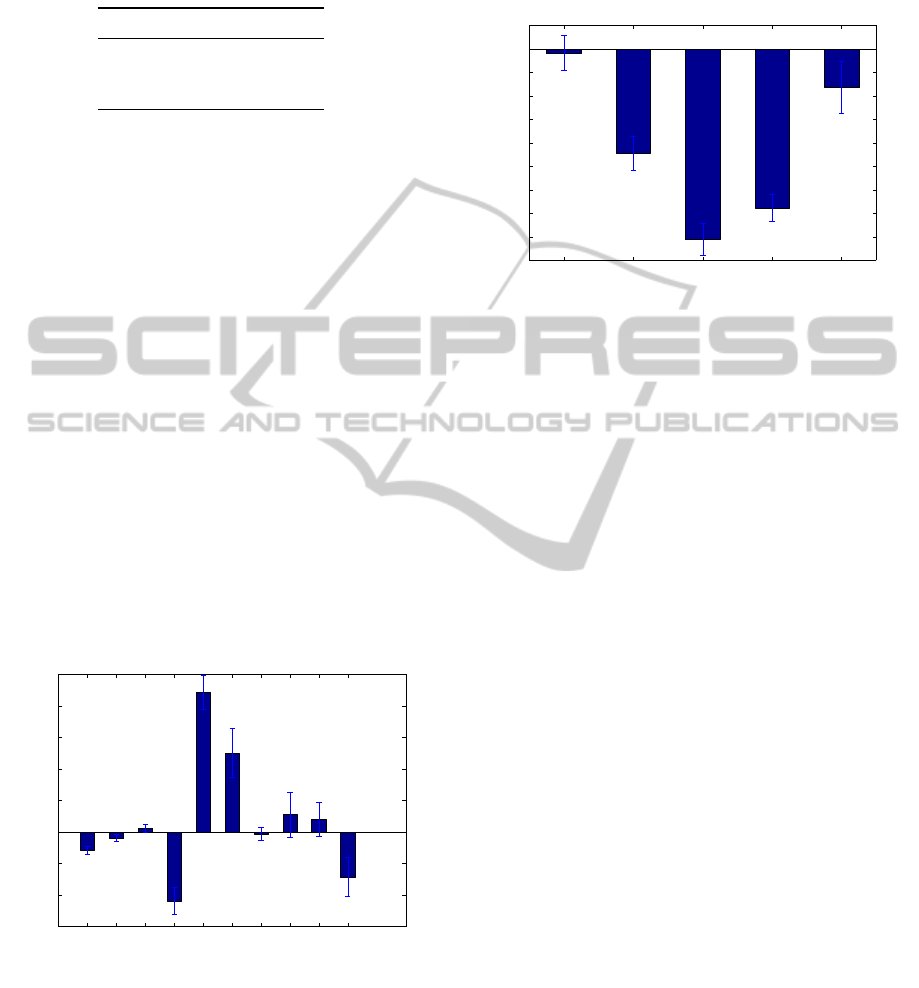
Table 8: The t-test results regarding Alg. is shown as “+”
or “∼” when the performance of the Alg. with S1 is signif-
icantly better than or statistically equivalent to the perfor-
mance when using S2, respectively.
AUC Sensitivity
LMS ∼ +
MLP ∼ +
RBF ∼ +
variables S2. One hypothesis is that using predicted
values from regression equations as reference values,
may add noise to the physiological measure, due to
residuals from the regression, which, in turn, can mis-
lead the classifier.
4.4 Identifying Discriminating
Variables
We are now interested in finding out what are the most
discriminating variables. This information could pro-
vide some clues about what physical and physiologic
characteristics have more influence in the decision
process implemented by the ANNs studied.
As the three analyzed classifiers achieved quite
similar performance, we will look at the weights of
the linear ANN learned through the least mean square
algorithm. The means and standard deviations of the
weights obtained by linear ANN for dataset S1 and
S2, based on 30 independent runs, are depicted in Fig-
ures 1 and 2, respectively.
−3
−2
−1
0
1
2
3
4
5
weights
Age
Gender
BMI
FVC(o)
FEV1(o)
PEF(o)
FEF25−75(o)
MVV(o)
MIP(o)
MEP(o)
Figure 1: Means and standard deviations of the linear ANN
weights for the S1 dataset over 30 executions.
For the dataset S1, it is possible to see that gen-
der and body mass index of a subject have a little
influence in the decision process. Additionally, the
physiologic measure FEF25-75 (o) are practically ig-
nored by the classifier, although it is worth mention-
ing its high standard deviation. On the other hand, the
most discriminating variables refer to the physiologi-
cal measures FVC (o), FEV1(o), and PEF(o).
−4.5
−4
−3.5
−3
−2.5
−2
−1.5
−1
−0.5
0
0.5
weights
FVC(%)
FEV1(%)
PEF(o)
FEF25−75(%)
MVV(%)
Figure 2: Means and standard deviations of the linear ANN
weights for the S2 dataset over 30 executions.
The only neglected variable by the linear ANN in
the S2 dataset is the physiologic measure FVC(%),
but also has a high standard deviation. That using ref-
erence measures, sometimes obtained through regres-
sion equation, to guide the physiological measures led
to a different classification problem, probably more
difficult to deal with, given the results.
5 CONCLUDING REMARKS AND
FUTURE WORK
The analysis and classification of physiological mea-
sures is not a trivial task. The complexity to develop
this kind of research includes accurate data acquisi-
tion, selection of a suitable classifier that can provide
a good representation of that patterns. This work pre-
sented results of modeling, training and testing three
different ANN architectures to identify the Chronic
Obstructive Pulmonary Disease. Our results highlight
the potential of ANNs as a support decision tool for
the problem of COPD identification.
The results showed that even simple models as the
linear neuron with LMS algorithm had a good perfor-
mance. It allows us to infer that these sets of selected
variables, S1 and S2, conduct the COPD identifica-
tion problem to a nearly linearly separable classifica-
tion problem.
Two sets of variables were considered in our anal-
ysis: one composed of normalized raw data of three
non-physiological (age, gender and body mass index)
and seven spirometric measures; and the other con-
sisting of five variables defined as the ratio of the
DiagnosingChronicObstructivePulmonaryDiseasewithArtificialNeuralNetworksusingHealthExpertGuidelines
213

spirometric measures to the expected value for a nor-
mal subject following the guideline provided by the
American Thoracic Society. It was performed as an
attempt to incorporate knowledge from health experts
to the dataset. Our results showed that, despite hav-
ing similar performance in terms of AUC, all classi-
fiers lose the capacity of reduce false negatives when
using the second set of variables.
Among the ANNs models analyzed, RBFNNs ob-
tained similar results in terms of classification power,
but better performance when looking at the classi-
fiers’ sensitivity, for both datasets. This measure tells
us that RBFNN classifiers are more likely to avoid
false negative diagnosis, i.e., cases when a COPD pa-
tient is diagnosed as normal, that may be dangerous.
Such results agree with that obtained by (Mehrabi
et al., 2009) and the performance measures obtained
in our work are slight better, even considering that
other feature set had been considered. The results
obtained with the application of ANN in the classi-
fication of diseases encourage the study of new ap-
plications of such models to help with problems of
biomedicine, pointing out the ANN as a powerful
technique to help with the understanding and diag-
nosing diseases.
In this work, ANNs were used only to identify the
presence or absence of COPD. As future work, it is
intended to apply ANN to classify the level of sever-
ity of the disease as well as to support decision on
treatment, according to this level.
ACKNOWLEDGEMENTS
This work was supported in part by the National
Council for Research and Development of Brazil. We
also thank Prof. Dr. Antonio Fernando Brunetto
(in Memoriam) by his collaboration as the expert in
COPD rehabilitation.
REFERENCES
Azeredo, C. A. C. (2002). Fisioterapia Respirat
´
oria Mod-
erna. Manole, S
˜
ao Paulo, 4 edition.
Er, O. and Temurtas, F. (2008). A study on chronic ob-
structive pulmonary disease diagnosis using multi-
layer neural networks. Journal of Medical Systems,
32:429–432.
Er, O., Yumusak, N., and Temurtas, F. (2010). Chest dis-
eases diagnosis using artificial neural networks. Ex-
pert Systems with Applications, 37(12):7648–7655.
Fawcett, T. (2006). An introduction to ROC analysis. Pat-
tern Recogn. Lett., 27(8):861–874.
Fontenla-Romero, O., Guijarro-Berdinas, B., Alonso-
Betanzos, A., and Moret-Bonillo, V. (2005). A new
method for sleep apnea classification using wavelets
and feedforward neural networks. Artificial Intelli-
gence in Medicine, 34:65–76.
Group, A. W. (2004). Update to the Latin American Tho-
racic Society (ALAT) Recommendations on Infec-
tious Exacerbation of COPD. Archivos de Bronconeu-
mologia, 40:315–325.
Lenfant, C. (1998). Estrat
´
egia global para o diagn
´
ostico, a
conduta e a prevenc¸
˜
ao da doenc¸a pulmonar obstrutiva
cr
ˆ
onica. Technical report, GOLD - Global Initiative
for Chronic Obstructive Lung Disease.
Mehrabi, S., Maghsoudloo, M., Arabalibeik, H., Noor-
mand, R., and Nozari, Y. (2009). Application of mul-
tilayer perceptron and radial basis function neural net-
works in differentiating between chronic obstructive
pulmonary and congestive heart failure diseases. Ex-
pert Systems with Applications, 36(3, Part 2):6956–
6959.
Møller, M. F. (1993). A scaled conjugate gradient algo-
rithm for fast supervised learning. Neural Networks,
6(4):525–533.
Nathell, L., Nathell, M., Malmberg, P., and Larsson, K.
(2007). COPD diagnosis related to different guide-
lines and spirometry techniques. Respiratory Re-
search, 8.
Passold, F., Garcia Ojeda, R., and Muniz Barreto, J. (1996).
Hybrid expert system in anesthesiology for critical pa-
tients. In Electrotechnical Conference, 1996. MELE-
CON ’96., 8th Mediterranean, volume 3, pages 1486–
1489.
Wadie, B. S., Badawi, A. M., Abdelwahed, M., and El-
emabay, S. M. (2006). Application of artificial neu-
ral network in prediction of bladder outlet obstruction:
A model based on objective, noninvasive parameters.
Urology, 68:1211–1214.
Widrow, B. and Hoff, M. E. (1960). Adaptive switching
circuits. In IRE WESCON Convention Record, Part 4,
pages 96–104, New York. IRE.
Yan, H., Jiang, Y., Zheng, J., Peng, C., and Li, Q. (2006). A
multilayer perceptron-based medical decision support
system for heart disease diagnosis. Expert Systems
with Applications, 30(2):272–281.
Zhou, Z.-H. and Jiang, Y. (2003). Medical diagnosis with
c4.5 rule preceded by artificial neural network ensem-
ble. IEEE Transactions on Information Technology in
Biomedicine, 2003, 7(1): 37-42, 7(1):37–42.
HEALTHINF2013-InternationalConferenceonHealthInformatics
214
