
Bio-inspired Face Authentication using Multiscale LBP
Ayoub Elghanaoui
1
, Nefissa Khiari Hili
1,2
, Christophe Montagne
1
and Sylvie Lelandais
1
1
IBISC Laboratory,University of Evry Val d’Essonne, 40 Rue du Pelvoux, 91020, Evry Cedex, France
2
TSIRF Laboratory, ENIT, University of Tunis El Manar, BP-37 Le Belvédère, 1002, Tunis, Tunisia
Keywords: Face Recognition, Local Binary Pattern, Bio Inspired Processing, Difference of Gaussian Decomposition.
Abstract: In this paper, we propose a new approach to recognize 2D faces. This approach is based on experiments
performed in the field of cognitive science to understand how people recognize a face. To extract features,
the image is first decomposed on a base of wavelets using four-level Difference Of Gaussians (DOGs)
functions which are a good modeling of human visual system; then different Regions Of Interest (ROIs) are
selected on each scale, related to the cognitive method we refer to. After that, Local Binary Patterns (LBP)
histograms are computed on each block of the ROIs and concatenated to form the final feature vector.
Matching is performed by means of a weighted distance. Weighting coefficients are chosen based on results
of psychovisual experiments in which the task assigned to observers was to recognize people. Proposed
approach was tested on IV² database and experimental results prove its efficiency when compared to
classical face recognition algorithms.
1 INTRODUCTION
Human face recognition remains one of the most
active areas in security and surveillance applications
since it is non-invasive and requires less user
cooperation. Most classical approaches for face
recognition are holistic appearance-based ones such
as Eigenfaces and Fisherfaces (Belhumeur et al.,
1997). On another hand, local feature-based
approaches, like Gabor (Li and Jain, 2005) are
believed to achieve high accuracy. Both of them
perform well in controlled environments; however,
their performances drastically drop when variability
like quality, pose and illumination occur. Therefore,
new solutions are being suggested to overcome these
challenges. Many of them were based on combining
conventional algorithms and brought quite good
results (Mellakh et al., 2009); (Zhang and Jia, 2005);
(Su et al., 2009). Since around 2005, a lot of studies
in the field of face recognition used successfully the
“Local Binary Patterns (LBP)” (Huang et al., 2011).
Now, results of face recognition algorithms are
almost around the same values. Improving these
results is the goal of new methods. So we propose to
explore the work of some psychologists to help the
development of automatic algorithm based on
textural and multispectral analysis.
The rest of the paper is organized as follows. In a
first part we present the bio-inspired work on which
we were based to build our method. Then we give
some indications about the data and the evaluation
protocol we use to evaluate the proposed algorithm.
The third part describes the proposed bio-inspired
face authentication. Experimentations and
comparative results are reported in the fourth part.
Finally, we conclude and give some ideas for future
works.
2 WHY A BIO-INSPIRED
APPROACH?
Recently Sinha et al. proposed to take into account
the knowledge about the ways people recognize each
other (Sinha et al., 2006). They detailed nineteen
important results regarding face recognition by
human. In former studies, Gosselin and Schyns
proposed a bio-inspired technique called “Bubbles”
to reveal the use of information in recognition tasks
(Gosselin and Schyns, 2001). To this end, they run a
set of experiments on participants (human observers)
that had to identify or categorize a set of faces based
only on randomly revealed portions of these face
images.
182
Elghanaoui A., Khiari Hili N., Montagne C. and Lelandais S..
Bio-inspired Face Authentication using Multiscale LBP.
DOI: 10.5220/0004235601820188
In Proceedings of the International Conference on Bio-inspired Systems and Signal Processing (BIOSIGNALS-2013), pages 182-188
ISBN: 978-989-8565-36-5
Copyright
c
2013 SCITEPRESS (Science and Technology Publications, Lda.)
To build the stimuli presented to the observers,
Gosselin et al. started by using a Laplacien Pyramid
that decomposes an image into six frequency bands
in the Fourier domain leading to six scales in the
spatial domain (figure 1b). Revealed portions of
faces were then obtained by randomly sampling the
filtered images with gaussian functions, called
Bubbles. After all the observers have answered to
the stimuli that were present during the experiment,
it was possible to analyze where the information
leading observers to give a correct answer was.
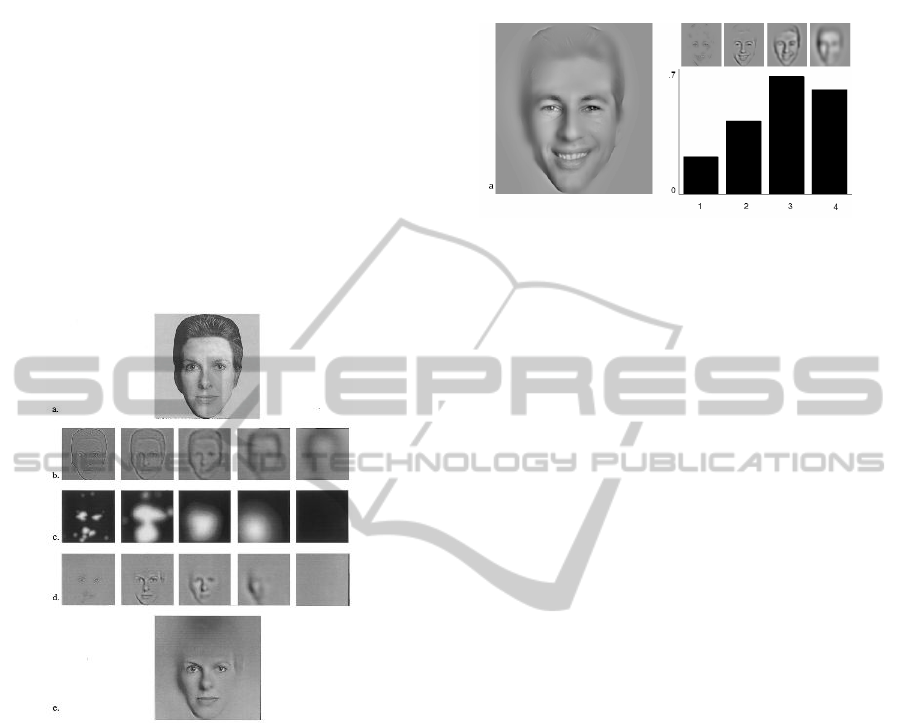
Figure 1c shows, for each scale, these areas. Then in
figure 1d, we see what parts of the face have been
useful, at each scale, for the recognition task. Figure
1e is a reconstruction of the five scales of figure 1d.
Figure 1: Application of Bubbles; a) Initial image; b) Five
different scales of a) ; c) Bubbles applied to each scale; d)
Revealed information of b) by the bubbles of c). e)
Stimulus resulting by integrating pictures in d) (Gosselin
and Schyns, 2001).
To revel which frequency bands were the most
discriminative for face recognition (achieving at
least 75% of successful recognition by observers),
Schyns et al., (2002) run a study on the proportions
of face area that was efficient in each of the five
frequency bands already sampled by Bubbles
(Figure 2). Results demonstrated that the third scale
was the most discriminative followed narrowly by
the fourth one. It also has been noticed that the fifth
scale did not contribute in any of the identification
nor the categorization tasks.
Furthermore, experiment results confirmed that
most of the face regions were important for
recognition. Specifically, the region of eyes was the
most important one as it is present in all scales,
followed by the mouth then the nose.
Figure 2: Left: Significant regions for recognition task.
Right: bars indicate the proportion of significant pixels in
the four first scales (Schyns et al., 2002).
3 THE IV² DATABASE AND THE
EVALUATION PROTOCOL
In biometric studies, it is very crucial to have a big
set of data on which the efficiency of proposed
algorithms can be evaluated. Some databases are
available but they don’t offer enough data either in
number or in variability. The IV² database was
designed with the aim of proposing multiple test
situations to allow evaluation with regard to
variability well known to be critical for the
biometric systems performance, such as pose,
expression, illumination and quality (Figure 3). The
IV² database has been realized during the Techno
Vision program and has been supported by the
French Research Ministry in collaboration with the
French Ministry of Defense.
The publicly available IV² database (http://
lsc.univ-evry.fr/techno/iv2/PageWeb-IV2.html)
allows monomodal and multimodal experiments
using face data (2D and 3D face images, 2D
stereoscopic face images and infrared iris images). It
contains 315 subjects with one session data where
77 of them also participated to a second session.
From this database, a subset of 52 subjects,
distributed as a development set, constitutes also the
training set.
As a closing stage of the IV² project, an
evaluation campaign was performed involving iris
recognition, 2D and 3D-face recognition and also
multimodal recognition. In the 2D-Face evaluation
(Petrovska et al., 2008), the strategy of having “one
variability” at a time was adopted in order to
evaluate how challenging variability - related to
illumination, expression, quality or multi-session
images - can be for the biometric systems.
Bio-inspiredFaceAuthenticationusingMultiscaleLBP
183
In this evaluation campaign a set of more than 15000
images were tested through four experiments. The
first three experiments are monosession (all images
were collected in a unique session). Experiment 1
includes neutral faces and small expression
variations. Experiment 2 tests illumination variations
and Experiment 3 tests quality variation. Whereas
Experiment 4 includes multi-session images, that
were collected in three different sessions.
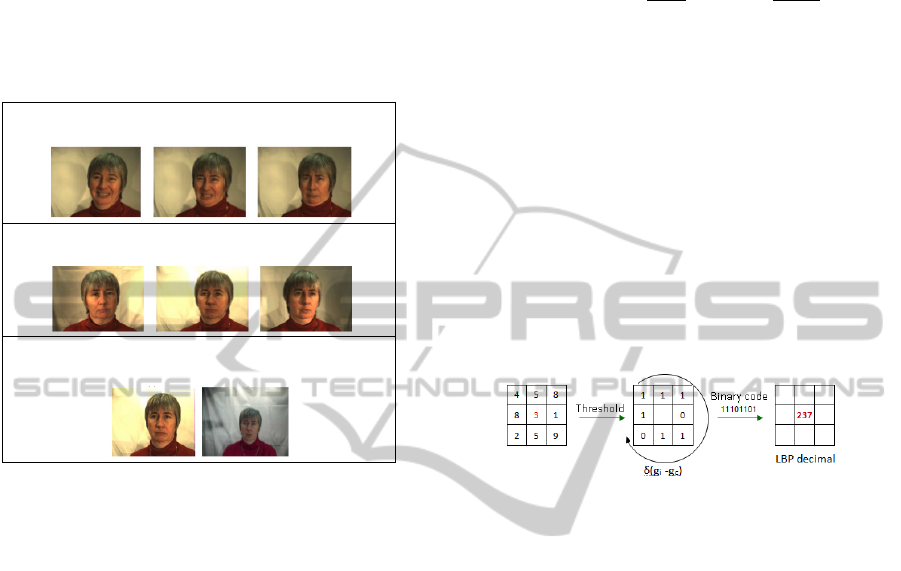
Expression variability
(1.a) (1.b) (1.c)
Illumination variability
(2.a) (2.b) (2.c)
Quality variability
(3.a) High quality DVCAM (3.b) low quality WEBCAM
Figure 3: Examples of variability related to (1.a-c)
expression, (2.a-c) illumination and (3.a-b) quality.
Five appearance based methods were evaluated
on the IV² database. Details about the algorithms are
given in (Mellakh et al., 2009) and comparative
results are shown in Table 4.
4 PROPOSED METHOD
The proposed method is based on four steps. First,
wavelet decomposition is performed. Then, Regions
Of Interest (ROIs) are selected on each scale, related
to Gosselin’s analysis (Gosselin et al., 2001). Then
LBP operator is computed on each filtered image.
Finally, matching is performed by computing a
weighted distance between request and stored
images. Weighting coefficients were set according to
the importance of scales and areas. In the next,
theoretical background is presented before detailing
the proposed approach.
4.1 Difference of Gaussians (DOG)
Rodieck and Stone showed that the responses of the
retinal ganglion cells could be modeled by a
Difference Of Gaussians function (DOGs) (Rodieck
& Stone, 1965. To go in the same direction and, at
the same time, explore Gosselin and Schyns results
we used a DOGs filter instead of Laplacien Pyramid.
The DOG’s filter formula in image plane is given by
(1) :
,
(1)
with C
1
, C
2
, σ and a are fixed constants following
psycho-visual experiments (C
1
=1.8, C
2
=0.8,
σ²=2.25) as shown by Schor et al. (1983); a is the
scale of the DOG.
4.2 Local Binary Patterns (LBP)
The original LBP operator was first used in texture
analysis in 1999 (Pietikäinen and Ojala, 1999). It is a
simple yet effective non parametric descriptor that
labels the pixels of an image by thresholding a 3
3
neighborhood of each pixel with the center value
and considering the results as a binary number called
Local Binary Pattern (see figure 4).
Figure 4: An example of LBP operator (P=8, R=1).
Ojala et al. later made an extension of the
original operator to allow any radius and any
number of pixels in the neighborhood (Ojala et al.,
2002). The notation LBP
P,R
denotes an LBP with a
neighborhood of P equally spaced sampling points
on a circle of radius R. It can be expressed in
decimal form for a given pixel at (x
c
, y
c
) as:
,
,
(2)
where i runs over the P neighbours of the central
pixel, g
c
and g
i
are the gray-level values of the
central pixel and the surrounding pixel. g
i
is of
coordinates ((-Rsin(2πi/P), Rcos(2πi/P)) if the
coordinates of g
c
are (0,0).
(x) is 1 if x
0 and 0
otherwise. Figure 4 shows an example of an original
LBP
8,1
.
After labeling an image with an LBP operator,
the histogram of the labeled image is computed
giving an LBP operator which can be exploited as a
texture descriptor. The LBP
P,R
produces 2
P
different
binary patterns that can be formed by the P pixels in
the neighbor set. This leads to 256 patterns for
LBP
8,1
.
Some variations of the original LBP have been
BIOSIGNALS2013-InternationalConferenceonBio-inspiredSystemsandSignalProcessing
184
developped. The most known of them are the
rotation invariance LBP
RI
(Pietikäinen et al., 2000),
the uniform pattern LBP
U2
(Mäenpää et al., 2000)
and the rotation invariant uniform pattern LBP
RIU2
(Ojala et al., 2002). Recent studies (Huang et al.,
2011) demonstrated that more than 90% of the
discriminative patterns for representing faces were
uniform.
4.3 Chi-square Distance (2)
To measure similarity between two LBP histograms
H
1
and H
2
of two images I
1
and I
2
, we use Chi-
Square distance
that has been widely used in
face recognition (Huang, 2011), given by the
following formula:
,
(3)
i is the elements’ index of H
1
and H
2
.
4.4 Implementation
Here are given the different steps of the proposed
method, starting by feature extraction from 128×128
normalized face images through DOG filtering, then
LBP calculation on ROIs subdivided into blocks and
finally ending by matching by means of weighted
Chi-square distance.
4.4.1 Dog Filtering
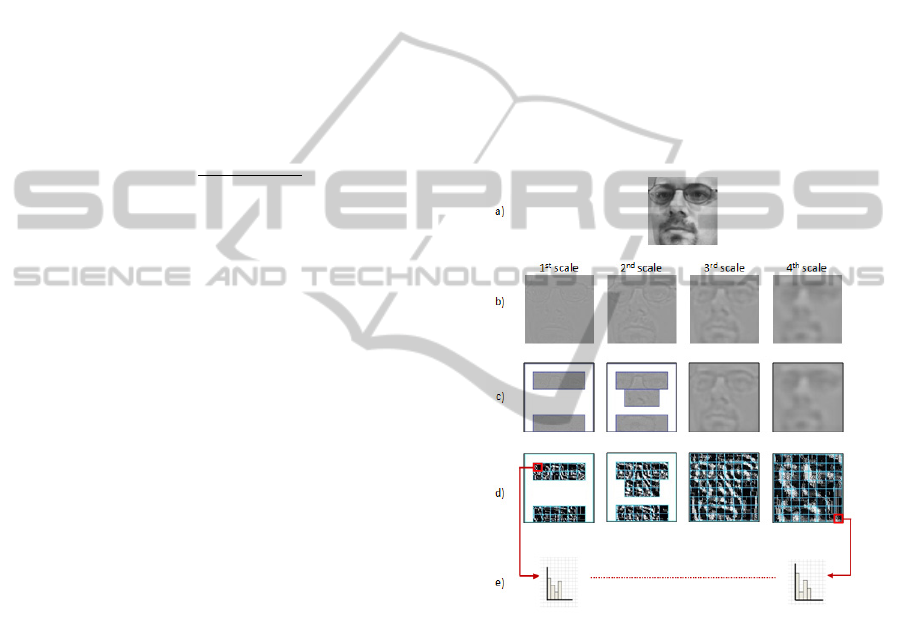
In this work, wavelets are performed through a
direct calculation in Fourier plane using the analytic
formula of the DOG (Eq. 1): each image is
decomposed at the input of the algorithm into four
frequency bands, each containing one octave. Figure
5b presents the results of such a decomposition
performed on the original image 5a. The four scales
used are equal to 1, 2, 4 and 8.
4.4.2 Regions of Interest Selection (ROIs)
The first application of the bio-inspired approach in
the proposed method consists in focusing only on
the discriminant regions of each scale, based on the
results found by Gosselin et al. (Gosselin and
Schyns, 2001).
In fact, their studies state that for the first scale,
participants focused only on the eyes and mouth
regions; for the second scale, they added the nose;
while for the third and fourth scales they used all the
face regions in the recognition task. The ROIs
selection is illustrated in Figure 5c.
4.4.3 LBP Application on ROIs
Once the regions are chosen, they are labeled with
an LBP operator then subdivided into non
overlapping sub-blocks. Histograms of the labeled
blocks are then calculated and concatenated into a
single histogram constituting the final feature vector.
This representation allows capturing both local
texture (LBP, sub-block division) and global shape
(histogram concatenation) of face. Figure 5d shows
an example of a 128×128 face image where the
ROIs of each scale are subdivided into 16×16 blocks
leading to a total of 182 blocks where LBP
histograms (of size 59 in case of LBP
U2
) are
computed then concatenated into a single feature
vector (of size 10738 in case of LBP
U2
) as illustrated
in Figure 5e.
Figure 5: Different steps of proposed method. a) Initial
image b) Result of DOG application into four scales c)
ROIs of each scale d) Application of LBP and subdivision
into blocks e) Histogram computation on each block and
concatenation of all histograms to get the final vector.
4.4.4 Matching by Weighting ROIs and
Scales
The second application of the bio-inspired approach
in the proposed method consists in considering the
importance of each ROI and each scale in the
recognition task realized by observers in Schyns et
al. work (Schyns et al., 2002). To this end,
weighting coefficients were introduced in the Chi-
square formula given by Equation 4:
Bio-inspiredFaceAuthenticationusingMultiscaleLBP
185

,
,
(4)
where w
r
and w
s
are, respectively, the weighting
coefficient of each region r and of each scale s.
The assignment of weights was guided by the
findings in (Schyns et al., 2002). These findings
state that, according to regions, the eyes were the
most important followed by the mouth than the nose;
while according to scale, the third scale was the
most discriminative one, followed narrowly by the
fourth one; the first and second scales having less
influence on the recognition task.
5 RESULTS AND DISCUSSION
In this section, the influence of a non exhaustive list
of parameters related to the proposed bio-inspired
method is firstly presented. Then, a comparison with
other algorithms performed on IV² project is
brought. The results are reported with the Equal
Error Rate percentage (EER).
5.1 Choice of LBP Variant
A first set of experiments has been conducted to see
which LBP variant was the most discriminant in the
face authentication task. Three extensions of LBP
operator were tested on the four IV² experiments,
besides the original LBP. Results in table 1 are in
favor of LBP
U2
as stated in many works in the
literature (Huang et al., 2011).
Table 1: Comparison between LBP variants. Application
on 4-scale DOG filtered ROIs divided into 16×16 blocks.
5.2 Choice of Block Size and ROIs
A second set of tests was carried out to see whether
it was better to keep the filtered images at their
entirety as an input for LBP
U2
histograms
computation or to split it into blocks. Different block
sizes were tested in this experimentation. Only the
three best configurations are shown in Table 2, i.e.:
entire image, 16×16 blocks and 32×32 blocks. It can
be seen, that splitting the filtered images into blocks
improves the results sensitively.
Another set of tests was run to prove the
importance of the bio-inspired approach based on
ROIs rather than the totality of blocks on each scale.
Table 2: Results of five configurations of LBP
U2
application, including block size variation and ROIs
selection.
Results of the last two configurations in Table 2
show that significant improvements were provided
by using only blocks of ROIs. The gain in terms of
EER goes up to 8.5% in case of Experiment 3 which
deals with quality variation, when using 32×32
blocks.
5.3 Improvements by Weighting ROIs
and Scales
Four strategies of weighting in the Chi-square
distance were tested. Weights were attributed
empirically with reference to Schyns et al. studies.
The kept weighting coefficients are as follows:
According to regions: 0.6 for the eyes, 0.2 for the
mouth, 0.12 for the nose and 0.08 for the rest of
regions.
According to scales: 0.05 for first scale, 0.1 for
second scale, 0.45 for third scale and 0.4 for
fourth scale.
Table 3: Influence of the weighting strategy.
Table 3 shows that weighting both scales and
regions achieved the best results for almost all the
experiments, especially for Experiment 3 (quality
variation) where enhancement reaches 4.5% of EER
when compared to unweighted strategy.
LBP variant Exp1 Exp2 Exp3 Exp4
LBP 5.1
(±0.7)
16.2
(±1.2)
21.4
(±1.6)
16.9
(±1.5)
LBP
RI
5.9
(±0.8)
18.1
(±1.3)
22.7
(±1.6)
16.6
(±1.4)
LBP
U2
4.9
(±0.7)
16.0
(±1.2)
20.8
(±1.6)
16.5
(±1.4)
LBP
RIU2
5.9
(±0.8)
18.5
(±1.3)
23.0
(±1.7)
16.9
(±1.5)
Bloc size Exp1 Exp2 Exp3 Exp4
16
4.9
(±0.7)
17.4
(±1.3)
24.8
(±1.7)
15.0
(±1.4)
32
4.7
(±0.7)
19.7
(±1.3)
25.8
(±1.7)
16.3
(±1.4)
16
4.9
(±0.7)
16.0
(±1.2)
20.8
(±1.6)
16.5
(±1.4)
32 4.0
(±0.6)
15.8
(±1.2)
17.3
(±1.5)
17.1
(±1.5)
31.6
(±1.8)
29.2
(±1.8)
LBP image
LBP blocks
on ROI
LBP all blocks
-
7.0
(±0.8)
27.3
(±1.5)
Weighting
strategy
Exp1 Exp2 Exp3 Exp4
No weighting
4.0
(±0.6)
15.8
(±1.5)
17.3
(±1.5)
17.1
(±1.5)
Weighting
scales
4.0
(±0.6)
16.1
(±1.2)
18.1
(±1.4)
17.6
(±1.5)
Weighting ROI
4.1
(±0.7)
15.6
(±1.2)
15.7
(±1.4)
16.6
(±1.4)
16.7
(±1.4)
Weighting
scales + ROI
3.7
(±0.6)
15.2
(±1.2)
12.8
(±1.3)
BIOSIGNALS2013-InternationalConferenceonBio-inspiredSystemsandSignalProcessing
186

To summarize, the optimum parameters of the
proposed bio-inspired method are to filter the
normalized 128×128 face images by a 4-scale DOG.
Then, compute LBP
U2
histograms on each 32×32
block of the Regions Of Interest and concatenate
them into a single feature vector. Afterward, perform
matching using Chi-square distance weighting both
scales and regions.
5.4 Comparison with IV² Evaluation
Campaign
To evaluate the efficiency of the proposed
algorithm, comparison with five other algorithms
using the same IV² database and protocol is
presented in Table 4 (Mellakh et al., 2009).
According to these results, proposed algorithm
provides the best results in Experiment1 including
small expression variation. It occupies the second
place in Experiments 2 and 3 involving illumination
and quality variations; and it is placed third when
faced to multisession variation in Experiment 4.
It can be seen that proposed method outperforms
conventional algorithms, i.e. PCA1, PCA2 and
LDA, in almost experiments. Besides, when
compared to modular PCA, that makes also use of
Regions Of Interest, proposed algorithm performs
better in all Experiments.
Table 4: Comparative results between proposed algorithm
(green) and IV² first evaluation campaign ones (black).
On the other hand, it is true that both bio-inspired
LBP and LDA/Gabor are multiscale and based on
combining conventional. But it has to be underlined
that, unlike the bio-inspired LBP algorithm, which
does not include any pretreatment for the face
images nor any pretreatment phase, the LDA/Gabor
algorithm performs an anisotropic smoothing on
images, before features extraction, which proved to
be very efficient face to variabilities such as
illumination, quality and multisessions. Also it
includes a learning phase to get the projection space
(Fisherfaces) used afterwards in the test phase. That
explains why LDA/Gabor achieves the best results
for Experiments 2, 3 and 4.
6 CONCLUSIONS AND FUTURE
WORK
Through this work, a bio-inspired approach based on
psychovisual studies has been introduced for 2D-
face authentication. The approach combines LBP
U2
with multiscale DOGs. It has been proved that
considering only relevant regions and weighting
both regions and scales brought sensitive
improvements. Proposed method showed to be
robust not only in controlled environment but also
face to illumination and quality variations.
Future works are intended to investigate
pretreatment before feature extraction. Further
research would consider a learning stage to enhance
performance.
REFERENCES
Belhumeur P. N., Hespanha J. P. and Kriegman D. J.,
1997. Eigenfaces vs fisherfaces: Recognition using
class specific linear projection. In IEEE Trans. on
PAMI, 19(7):711–720.
Gosselin F. and Schyns P. G., 2001. Bubbles: a technique
to reveal the use of information in recognition tasks. In
Vision Research, Elsevier. 41:2261–2271.
Huang D., Shan C., Ardabilian M. and Wang Y., 2011.
Local Binary Patterns and Its Application to Facial
Image Analysis: A Survey. In IEEE Trans. On
Systems, Man, and Cybernetics, 41(6):765-781.
Li S. Z. and Jain A. K., 2005. Handbook of Face
Recognition. Springer.
Mäenpää T., Ojala T., Pietik¨ainen M. & Soriano M.,
2000. Robust texture classification by subsets of local
binary patterns. In Proc. 15th Inter. Conf. on Pattern
Recognition, 3: 947–950.
Mellakh A., Chaari A., Guerfi S. & all., 2009. 2D Face
Recognition in the IV² Evaluation Campaign. In Conf.
on ACIVS, Bordeaux, France.
Ojala T., Pietikäinen M., and Mäenpää T., 2002.
Multiresolution gray-scale and rotation invariant
texture classification with local binary patterns, In
IEEE Trans. on PAMI, 24(7), 971–987.
Petrovska-Delacretaz D., Lelandais S., Colineau J. & all.,
2008. The IV
2
Multimodal Biometric Database
(Including Iris, 2D, 3D, Stereoscopic, and Talking
Face Data), and the IV2- 2007 Evaluation Campaign.
In 2nd IEEE Inter. Conf. on Biometrics: Theory,
Applications and Systems (BTAS), USA.
Pietikäinen M. and Ojala T., 1999. Nonparametric texture
analysis with simple spatial operators. In Proc. on
Algorithms Exp1 Exp2 Exp3 Exp4
PCA1
6.7
(±0.8)
20.7
(±1.3)
20.1
(±1.6)
22.2
(±1.6)
PCA2
7.3
(±0.8)
21.6
(±1.4)
13.6
(±1.4)
16.3
(±1.4)
mod PCA
5.3
(±0.7)
20.7
(±1.4)
19.5
(±1.6)
20.5
(±1.5)
LDA 3.7
(±0.6)
22.5
(±1.4)
21.7
(±1.7)
19.7
(±1.5)
Proposed
method
Bio-inspired
LBP
u2
3.7
(±0.6)
15.2
(±1.2)
12.8
(±1.3)
16.7
(±1.4)
12.0
(±1.1)
8.3
(±1.1)
11.3
(±1.2)
LDA/ Gabor
Previous
Tests IV²
4.2
(±0.6)
Bio-inspiredFaceAuthenticationusingMultiscaleLBP
187

Texture Analysis in Machine Vision, 3-12. Finland.
Pietikäinen M., Ojala T. and Xu Z., 2000. Rotation-
invariant texture classification using feature
distributions. In Pattern Recognition 33: 43–52.
Rodieck R. W. and Stone J., 1965. Analysis of receptive
fields of cat retinal ganglion cells. In J. Neurophysiol.
28:833-849.
Schor C. M., Wood I., 1983. Disparity range for local
stereopsis as a function of luminance spatial
frequencies. In Vision Research 23, 1649-1654.
Schyns P. G., Bonnar L. and Gosselin F., 2002. SHOW
ME THE FEATURES! Understanding Recognition
from the Use of Visual Information. In Psychological
Science. 13(5):402-409.
Sinha P., Balas B., Ostrovsky Y. and Russell R., 2006.
Face Recognition by humans: Nineteen results all
computer vision researchers should know about. In
Proceedings of the IEEE, 94(11):1948-1962.
Su Y., Shan S. G., Chen X. L. and Gao W., 2009.
Hierarchical ensemble of global and local classifers
for face recognition. In Journal of IEEE Trans. On
Image Processing, 18(8): 1885-1896.
Zhang X. and Jia Y., 2005. Face Recognition Based on
Steerable Feature and Random Subspace LDA. In Int.
workshop on Analysis and Modeling of Faces and
Gestures (AMFG), 3723(2):170-183, Beijing, China.
BIOSIGNALS2013-InternationalConferenceonBio-inspiredSystemsandSignalProcessing
188
