
Detecting Interacting Mutation Clusters in HIV-1 Drug Resistance
Yu Zhang
Department of Statistics, The Pennsylvania State University, 325 Thomas, University Park, PA 16803, Pennsylvania, U.S.A.
Keywords: HIV-1 Drug Resistance, Bayesian Method, Interaction Mapping.
Abstract: Understanding the genetic basis of HIV-1 drug resistance is essential for antiretroviral drug development.
We analyzed drug resistant mutations in HIV-1 protease and reverse transcriptase under 18 drug treatments.
The analysis is challenging because there is a large number of possible mutation combinations that may
jointly affect drug resistance. The mutations are also strongly correlated, imposing inference difficulties
such as multi-colinearity issues. We applied a novel Bayesian algorithm to the drug resistance data. Our
method efficiently identified clusters of mutations in HIV-1 protease and reverse transcriptase that are
strongly and directly associated with drug resistance. In addition to marginal associations, we detected
strong interactions among mutations at distant protein locations. Most identified protein positions are cross-
resistant to several drugs of the same types. The effects of interactions are mostly negative, suggesting a
threshold mechanism for the genetics underlying HIV drug resistance. Our method is among the first to
produce detailed structures of marginal and interactive associations in HIV-1 drug resistance studies, and is
generally suitable for detecting high-order interactions in large-scale datasets with complex dependencies.
1 INTRODUCTION
Human Immunodeficiency Virus (HIV) is a
retrovirus causing the acquired immunodeficiency
syndrome (AIDS). There are two major types of
HIV. HIV-1 is the most common strain of the virus
that has caused global HIV infection, which is the
main therapeutic target of interest. HIV-2, on the
other hand, has relatively lower infectivity and is
mainly confined within western Africa. Upon entry
into the target cell, the viral RNA genome is reverse
transcribed into double-stranded DNA. The resulting
viral DNA is then imported into the cell nucleus and
integrated into the host genome to begin replication
anew. The development of the virus requires several
critical viral enzymes, including protease (PR),
which is essential for the life-cycle of HIV, and
reverse transcriptase (RT), which reverse transcribes
the single-stranded viral RNA genome back to
double stranded DNA copies. The drugs for HIV
treatment therefore are often targeting at these
enzymes, including several types of protease
inhibitors and reverse transcriptase inhibitors. The
drugs work by binding to the active sites of the
targeting proteins to disable their functions.
However, due to the high mutation rates of
retroviruses under selective pressure of drugs, the
enzymes can rapidly change and thus lead to drug
resistance. Due to protein structures, not all
mutations are equally important to resistant drugs.
The complicated mutation patterns are thus difficult
to interpret (Shafer, 2002); (Liu and Shafer, 2006).
By sequencing viral strains in the drug-treated-
patient isolates, the genotypic data have been
generated for two major viral enzymes: PR and RT.
Currently the Stanford HIV Drug Resistance
database (http://hivdb.stanford.edu) contains nearly
all published HIV-1 PR and RT sequences, along
with their quantified drug resistance assays. Drug
resistance of an isolate is measured by IC50 (half
maximal inhibitory concentration), which is the
concentration of a drug required for 50%
inhibition in vitro. Using these data, our goal is to
infer genotype (protein) and phenotype (drug
resistance) relationships.
Several statistical and machine learning methods
have been attempted on these data to help predicting
phenotypes from genotypes (Shafer, 2002);
(Beerenwinkel, 2002); (Ravela et al., 2003); (Liu
and Shafer, 2006); (Rhee et al., 2006); (Saigo et al.,
2007). However, prediction provides little insight on
the genetic basis of drug resistance, and often their
results are inconsistent when analyzing the same
input data (Ravela et al., 2003); (Liu and Shafer
34
Zhang Y..
Detecting Interacting Mutation Clusters in HIV-1 Drug Resistance.
DOI: 10.5220/0004238800340043
In Proceedings of the International Conference on Bioinformatics Models, Methods and Algorithms (BIOINFORMATICS-2013), pages 34-43
ISBN: 978-989-8565-35-8
Copyright
c
2013 SCITEPRESS (Science and Technology Publications, Lda.)

2006). In recent years, advanced statistical methods
have been developed to particularly study the
genotype-phenotype relationships, including the
BVP model (Zhang et al., 2010) and the GKRR
model (Hinkley et al., 2011). The BVP model is a
Bayesian partitioning algorithm that recursively
infers the dependence and conditional independence
structures of mutations to drug resistance. BVP
however requires pre-screening of a handful of
amino acids that are likely to be associated with the
phenotypes, and thus is not directly applicable to the
original protein data of hundreds of amino acids.
The GKRR model stands for generalized kernel
ridge regression, which is a penalty-based regression
method. Their approach can detect main and pair-
wise interaction of mutations in regression setting,
but it is computationally prohibitive to detect higher
order interactions. Penalty-based regression also
may not produce consistent results in dependent
data.
In this paper, we develop a new Bayesian
algorithm to analyze the HIV-1 drug resistance data.
The algorithm is called BEAM3 (Zhang, 2011),
which was originally developed for genome-wide
disease association studies. Distinct from most
existing approaches, BEAM3 has three main
features: 1) it is computationally efficient and
statistically powerful for detecting both marginal
and joint associations of multiple variables in large
datasets; 2) it automatically and sufficiently
accounts for unknown strong dependence among
variables, such that only the direct association with
phenotypes are reported, while indirect associations
are filtered to improve the mapping resolution; and
3) it outputs a detailed graphical structure of how
variables interact and jointly affect phenotypes.
Previous comprehensive simulation studies have
shown that BEAM3 outperforms many existing
popular methods (Zhang, 2011). The datasets for
disease association studies and HIV-1 drug
resistance share similar properties. First, both studies
involve genotypic data as predictors. Second, both
studies identify genotype-phenotype relationships,
with possibly complicated interactions. Third, in
both studies, the genotype data are strongly
correlated. We therefore believe that BEAM3 is
suitable for the HIV-1 drug resistance analysis.
Below we briefly introduce the BEAM3 method
and describe how it is applied to the HIV-1 drug
resistance data. We then present the results of our
analysis on PR and RT genes under a variety of drug
treatments. Our method detected many strong
associations and interactions between protein
mutations and drug resistance, and we found high-
degree of cross-resistance of mutations to various
drugs of the same type. We further constructed
interaction graphs for PR and RT. Our analysis
suggested a threshold model of the genetic
mechanism for HIV-1 drug resistance. We conclude
with discussion of extensions of our method for
HIV-1 drug resistance studies.
2 MATERIAL AND METHODS
2.1 Datasets and Pre-processing
From the Stanford HIV Drug Resistance database,
we downloaded the protein sequences of HIV PR
and RT isolates and their assayed IC50 values by
PhenoSense (Monogram Biosciences, South San
Francisco, CA) under treatments of 7 PR drugs
(ATV, IDV, LPV, NFV, RTV, SQV, TPV) and 11
RT drugs (3TC, ABC, AZT, D4T, DDC, DDI, TDF,
FTC, DLV, EFV, NVP), respectively. For PR gene,
there are 11731 phenotypes (IC50 of 7 PR drugs)
from 1727 isolates, and for RT gene, there are 8884
phenotypes (IC50 of 11 RT drugs) from 1033
isolates. These datasets have been previously filtered
and analyzed (Rhee et al., 2006), and thus represent
high quality data. We also downloaded the
genotype-treatment datasets for PR and RT genes,
respectively, where isolates received antiretrovials
before isolation and sequencing serve as cases, and
untreated isolates serve as controls. The bulk
datasets contain 44371 isolates (12510 cases) for PR
and 43995 isolates (18567 cases) for RT.
Each dataset contains two types of information
per isolate: the IC50 value and the protein mutations
relative to a reference sequence (consensus subtype
B obtained by aligning untreated isolates). We first
pre-processed the data to convert the IC50 values
into binary values 0 and 1 indicating non-resistant
and resistant status, respectively. The conversion is
done at the intermediate threshold levels provided in
Rhee et al. (2006), i.e., we separated the isolates into
cases and controls, where controls included isolates
susceptible to drugs, and cases included isolates
either moderately or stringently resistant to drugs.
We further converted the protein data at each amino
acid position to 0 and 1 corresponding to wild type
and mutant, respectively, relative to the consensus.
2.2 The BEAM3 Framework
BEAM3 assumes two sets of input data X
(genotypes) and Y (phenotypes). Let L denote the
number of variables in X, i.e., X=(X
1
,…,X
L
). In our
DetectingInteractingMutationClustersinHIV-1DrugResistance
35

case, L corresponds to the number of amino acids in
a protein sequence, and X
i
denotes the mutation
status at the ith amino acid in all isolates. Let N
denote the number of isolates, then X
i
is a N-dim
vector of mutation indicators, and Y=(Y
1
,…,Y
N
) is a
N-dim vector of drug resistance indicators.
Our method is a full Bayesian approach that
partitions the L amino acids in X into two non-
overlapping classes. Let I=(I
1
,…,I
L
) denote the class
memberships of the L amino acids, with I
i
=1
denoting that the ith amino acid is directly
associated with drug resistance, and I
i
=0 denoting
otherwise. Our task is then to learn from the data the
best partition of the amino acids, and our targets of
interest are those with indicators I
i
=1.
For notation simplicity, let X
(0)
and X
(1)
denote
the collection of amino acids belonging to classes 0
and 1 (I
i
= 0 or 1), respectively. The full probability
function can be expressed in the form:
Pr(X,Y) = Pr(X
(1)
|Y)Pr(X
(0)
|X
(1)
,Y)Pr(Y) (1)
Since we assume that class 0 amino acids X
(0)
are not
directly associated with drug resistance (Y) given the
directly associated class 1 amino acids X
(1)
, we can
drop Y from Pr(X
(0)
|X
(1)
,Y), and our model becomes
Pr(X,Y) = Pr(X
(1)
|Y)Pr(X
(0)
|X
(1)
)Pr(Y)
(2)
= [Pr(X
(1)
|Y)/Pr(X
(1)
)]Pr(X)Pr(Y)
It is seen that both Pr(X) and Pr(Y) are invariant with
respect to any partition of X, and hence our model is
proportional to the ratio Pr(X
(1)
|Y)/Pr(X
(1)
).
This ratio is essentially evaluating whether or not
the partition X
(1)
is indeed related with Y in the
conditional probabilistic sense compared to its
marginal distribution Pr(X
(1)
). In a Bayesian
framework, the complexity of the probabilistic
functions in both numerator and denominator of the
ratio are accounted for by the priors of model
parameters. Our method therefore can avoid over-
fitting the data, as the numerator function is more
complex than the denominator function.
2.3 A Graphical Implementation
We next define the detailed probability functions
Pr(X
(1)
|Y) and Pr(X
(1)
). In our case, the data are
categorical, and thus a simple choice could be the
probability functions of multinomial distributions. A
naïve usage of multinomial distributions, however,
is not efficient when the number of variables in X
(1)
is large relative to the sample size. This is because
the model complexity of saturated multinomial
distributions increases exponentially with respect to
the size of X
(1)
. To reduce model complexity and
thus improve the power of our method, we introduce
an auxiliary variable G=(V, E), where G is an
undirected acyclic graph with nodes (V) representing
a finer partition of amino acids in X
(1)
, and edges (E)
connecting the nodes representing “interaction”
(joint association) between sets of amino acids in
X
(1)
. There are two major advantages provided by
this additional graph variable G. First, the model
complexity of Pr(X
(1)
|Y) can be drastically reduced
relative to saturated models and thus improves
power. Second, G represents an interaction graph for
“causative” drug resistant mutations, which can be
used for model interpretation and future hypothesis
testing of genetic interactions towards drug
resistance. As an example, if a graph G
reconstructed from the data consists of nodes
V={{3,6}, {7}, {9}, {11}} and edges E={{3,6}-{7},
{3,6}-{9}}, we can interpret the model as that amino
acids at positions 3, 6, 7, 9, 11 are directly
associated with drug resistance, while other
positions are not. In addition, amino acids {3,6,7}
are jointly associated with drug resistance, so are
{3,6,9}. Amino acid {11} is marginally associated
(independent of others), while {7} and {9} are
conditionally independent given {3,6}.
We rewrite Pr(X
(1)
|Y) as Pr(X
(1)
,G|Y), where the
latter can be decomposed by chain rules as a product
of marginal and conditional probability functions for
nodes and edges in G. In particular,
Pr(X
(
1
)
,G|Y)
(3)
=
v
V
Pr(X
v
|Y)
{
u~
v
}
E
Pr(X
{
u
,v
}
|Y)/Pr(X
u
|Y)Pr(X
v
|Y)
where {u~v}
E denotes the pairs of connected
nodes u and v in the graph. We then specify each
probabilistic function Pr(X
v
|Y) as the ratio between
Pr(X
v
,Y) and Pr(Y) by using multinomial
distributions for each. We further integrate out
multinomial parameters using Dirichlet priors. In
similar ways, we rewrite Pr(X
(1)
) as
Pr(X
(1)
) =
G*
Pr(X
(1)
,G*)
(4)
which again utilizes a graphical structure, but the
graph G* is different from G and is used to capture
the dependence among amino acids in X
(1)
. Since
Pr(X
(1)
) is in the denominator in (2), we marginalize
out G* to improve the convergence of our method.
For the priors of indicator vector I, we assign
independent Bernoulli priors to each indicator
variable I
i
, where the Bernoulli parameter is set at
0.05/L by default. For the priors of graph G, we
assign a Pitman-Yor process prior (Pitman and Yor,
1997) to the number of nodes in the graph, and
assign a Bernoulli prior to each edge between two
nodes (for presence or absence of the edge) with
BIOINFORMATICS2013-InternationalConferenceonBioinformaticsModels,MethodsandAlgorithms
36

default parameter 0.1. We further enforce that G is
acyclic by letting the priors of cyclic graphs be 0.
Our final model is written as
Pr(X,Y) Pr(X
(1)
,G|Y) /
G*
Pr(X
(1)
,G*) Pr(I)
(5)
based on which we infer G and I from the data by
Markov Chain Monte Carlo (MCMC) algorithms.
More details of (5) can be found in Zhang (2011).
2.4 Markov Chain Monte Carlo
Our algorithm starts from a random partition of
amino acids and a random graph on X
(1)
. We update
the membership variable I of each amino acid
iteratively, and if the membership is changed, we
further update graph G. At each step, we update I
i
conditioning on the other parameters (I
-i
,G
-i
), where
the subscript “-i” indicates the corresponding
variables excluding X
i
. Let I
new
denote the new
partition variable with I
-i
fixed but I
i
=0 or 1. Let
X
(1)
new
denote the new set of variables in class 1,
including all variables (excluding X
i
) previously in
X
(1)
, and also include X
i
if I
i
=1. We sample the
values of I
i
from the following marginalized
probability function that is proportional to
G
Pr(X
(1)
new
,G|Y) /
G*
Pr(X
(1)
new
,G*)Pr(I
new
)
(6)
Here, the marginalization is done over all possible
graphs G that includes X
i
and the fixed subgraph G
-i
.
After updating I
i
, and if its value is 1, we sample a
new graph G
new
by adding X
i
to the subgraph G
-i
according to the probability function
Pr(X
(1)
,G
new
|Y,G
-i
) /
G*
Pr(X
(1)
,G*)
(7)
On the other hand, if the value of I
i
is 0, we simply
remove X
i
from graph G. We repeat the above
procedure until the algorithm converges, and then
collect posterior samples of I and G. We exclude
samples from the first few iterations as burn-in.
Our method outputs two types of results. One is
the posterior probability of association with drug
resistance at each amino acid position. The
probabilities are represented as a summation of two
quantities: marginal association probability and joint
association probability. Here, marginal association
means that the amino acid is related with drug
resistance independently of other amino acids, where
joint association means the amino acid is
“interacting” with other amino acids and they jointly
affect drug resistance. We put a quotation mark on
interaction because mathematical definition of
interaction is not given in our context, and it is more
appropriate to say joint association. The second type
of results output by our method is a graphical
structure of how amino acids “interact” to affect
drug resistance, where “interactions” are represented
by edges between nodes. For simplicity, we only
output marginal posterior modes of nodes and edges.
3 RESULTS
3.1 Drug Resistant Positions
We ran our program on the 18 datasets of 11 PR and
7 RT drug treatments. Each dataset contains treated-
patient isolates of one drug. We first pre-processed
the data as described in Methods, and we ran our
program on each dataset for 100 burn-in iterations
followed by 100 sampling iterations. Running time
of the algorithm ranges from a few minutes to one
hour, depending on the complexity of the true
association structure in each dataset. The protein, the
drug, and the number of cases and controls in each
dataset are summarized in Table 1.
Table 1: Summary of HIV-1 drug datasets (*estimated
number of positions associated with drug resistance).
Gene Drug # Case # Control k*
PR
ATV 603 410 25.7
IDV 888 734 34.7
LPV 787 535 30.0
NFV 1055 620 33.7
RTV 930 660 30.8
SQV 745 895 30.2
TPV 215 529 9.1
RT
3TC 651 287 6.1
ABC 524 239 8.0
AZT 508 425 21.4
D4T 467 469 13.6
DDC 275 215 4.1
DDI 449 487 11.0
FTC 118 49 3.5
TDF 198 357 7.3
DLV 420 549 4.1
EFV 429 553 8.8
NVP 510 489 8.3
We output the posterior probabilities of each
amino acid position associated with drug resistance.
Using these probabilities, we first estimated the
number of positions showing direct association with
drug resistance by summing the posterior
probabilities over all amino acids. Unlike
conventional approaches, our method sufficiently
accounts for variable dependence, and hence our
estimates are accurate and reliable (Zhang 2011). As
shown in the last row of Table 1, we observed fairly
consistent results in PR gene. There are ~30 amino
acids out of 99 in PR sequence that are associated
with drug resistance for 6 different PR inhibitors.
DetectingInteractingMutationClustersinHIV-1DrugResistance
37
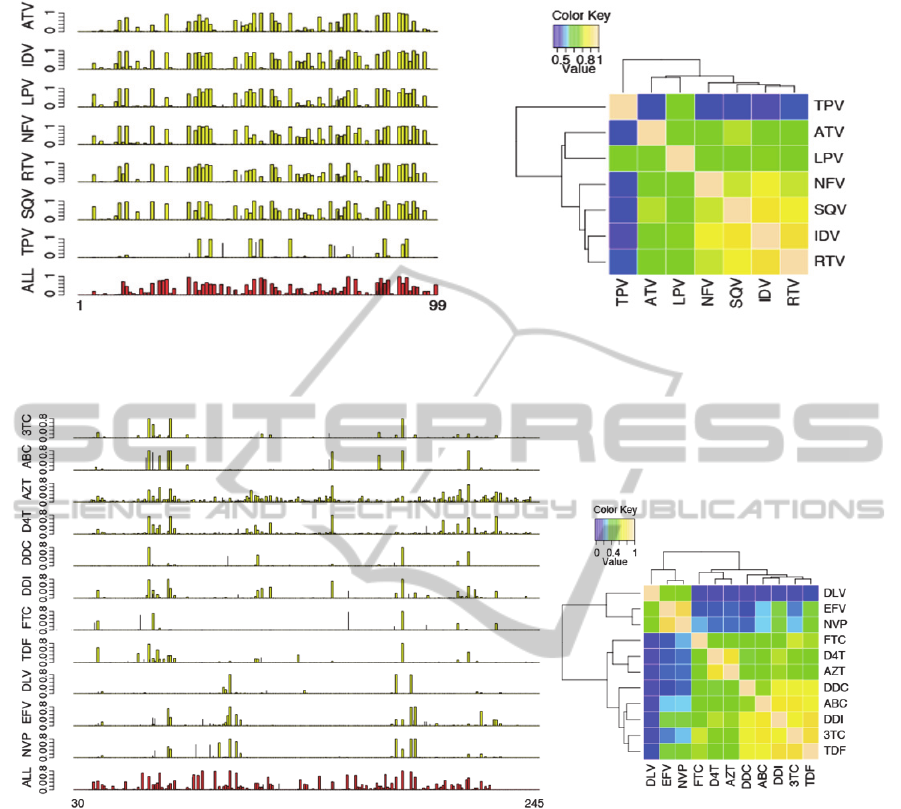
Figure 1: Left: posterior probability (y-axis) of drug resistance per amino acid position (x-axis) in protease. The bottom plot
shown in red is obtained from the bulk dataset with all 7 PR drugs combined and additional isolates. Right: heatmap of
correlation of PR drug resistance association posterior probabilities.
Figure 2: Left: posterior probability (y-axis) of drug resistance per amino acid position (x-axis) in reverse transcriptase. The
bottom plot shown in red is obtained from the bulk dataset with all 11 RT drugs combined and additional isolates. Right:
heatmap of correlation of RT drug resistance association posterior probabilities.
The only exception is TPV, for which we
estimated only 9.1 positions with direct association.
This is likely due to its relatively smaller sample
size. For RT gene, interestingly, we observed
uniformly smaller number (~8) of associated
positions than in PR gene, despite of the fact that
there are more (~245) amino acids in the RT
sequence (although there are 560 positions in RT,
nearly all mutants are found between positions 40-
240). In addition, our method suggested that most of
the associated positions work together to jointly
resist drugs.
We show in Figures 1 the position-specific
association probabilities for drug resistance in PR.
The drug resistant positions are strikingly consistent
across 6 out of 7 PR inhibitors (except for TPV).
The consistency of the detected positions is known
as cross-resistance to multiple drugs (Rhee et al.,
2006). We further show in Figure 1 the heatmap of
pairwise correlation between PR drugs calculated
from their position-specific association probabilities.
We observed in the hierarchical tree that 6 PR drugs
(except for TPV) formed a main cluster, and within
which (NFV, SQV, IDV, RTV) were more closely.
The relationships, however, were likely a result of
the sample size effects of the PR datasets, because
TPR, ATV, and LPV have the smallest sample sizes
among the 7 PR drugs.
We next show in Figure 2 the results for RT
gene. Again, we observed strong cross-resistance
BIOINFORMATICS2013-InternationalConferenceonBioinformaticsModels,MethodsandAlgorithms
38
patterns. Among the 11 RT drugs, 3 (DLV, EFV,
NVP) are nonnucleoside RT inhibitors (NNRTI)
shown at the bottom of Figure 2, while the other 8
RT drugs are nucleoside RT inhibitors (NRTI).
Interestingly, the 3 NNRTIs share a common cross-
resistance pattern that is quite different from the
cross-resistance pattern of the 8 NRTIs. It is further
observed that the posterior probabilities of D4T and
AZT were slightly but consistently different from
the other NRTIs. These results, together, suggested
three different resistance patterns in RT drugs. The 3
clusters of RT drugs are also seen in the correlation
heatmap in Figure 2, in which FTC appeared to be
an outlier due to its small sample size. In addition to
the individual drug datasets, we have also run our
method on the bulk genotype-treatment datasets for
PR and RT. The results are shown in the bottom of
Figures 1 and 2, respectively. From the bulk
datasets, we estimated that there are 29.7 amino acid
positions in PR associated with drug resistance,
which is similar to the numbers obtained from the
individual PR drug datasets. In contrast, we
estimated 32.4 drug resistant positions from the bulk
RT dataset, much greater than those obtained from
the individual RT drug datasets. The results from the
bulk datasets also suggested that RT has greater
diversity of drug resistance patterns than PR does.
3.2 Correlations and Interactions
We next evaluated the correlation and interaction of
the mutation events across amino acids in each
protein. Given the high-degree of cross-resistance
for HIV-1 drugs of the same types, we focused on
analyzing the bulk genotype-treatment datasets for
PR and RT, respectively, which contained many
more samples and thus provided more power.
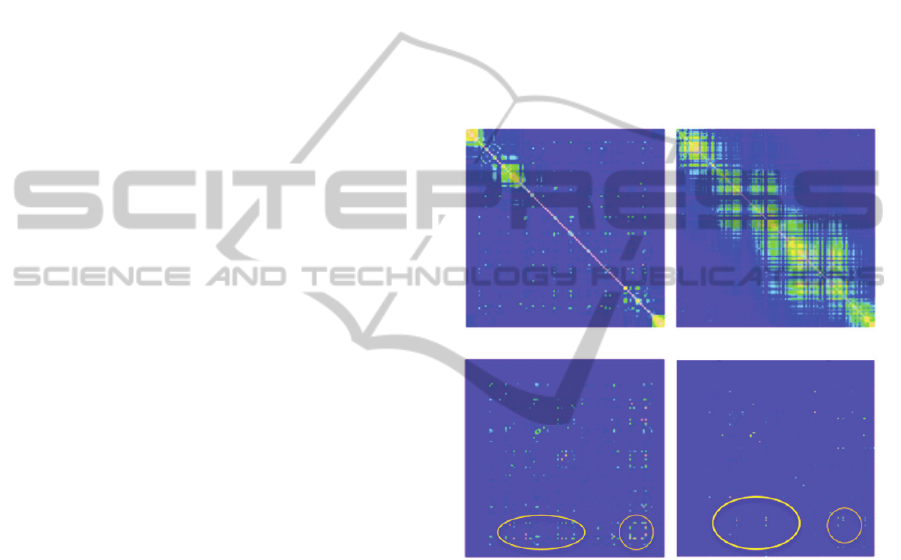
As shown in Figure 3(ab), both PR and RT
demonstrated very strong local correlation of
mutation events, with some distant correlations as
well. The banded pattern of local correlation is due
to the duplication and selection process of HIV-1
viruses. Given the strong correlation of mutation
events, it is statistically challenging to pinpoint the
precise positions of drug resisting mutations. Our
method automatically accounts for strong correlation
among variables, and thus is able to identify the true
interacting locations for drug resistance. As shown
in Figure 3(cd), we highlighted some strong
interaction hotspots between pairs of amino acids,
including both local and distant interactions. Note
that the distribution of interaction hotspots is very
different from the distribution of strong correlations,
suggesting that the interactions detected by our
method are not confounded by correlation.
We further show in Figure 4 the interaction
graphs reconstructed by our method. These graphs
provide detailed landscapes of how amino acids
work together to resist drugs. The graphs are
reconstructed such that each node represents an
amino acid position with total (marginal+interacting)
posterior probability of drug resistance >0.3, and
each edge represents an interaction with posterior
probability >0.3. The threshold 0.3 is chosen such
that the numbers of nodes included in the graph is
close to the numbers (k) in Table 1. To our best
knowledge, previous analyses of these datasets have
not revealed such detailed relationships.
(a) |Correlation| for PR (b) |Correlation| for RT
(c) Interaction for PR (d) Interaction for RT
Figure 3: (a, b): Heatmaps of the absolute Pearson
correlation coefficients between amino acids in PR and
RT, respectively. (c, d): Heatmaps of the inferred posterior
probability of pairwise interaction association in PR and
RT, respectively. Diagonals show the marginal association
probabilities. Circles highlight interaction hotspots.
For PR gene (Figure 4a), we observed two major
interacting clusters. Interestingly, the two clusters
are relatively symmetric. We draw the amino acid
positions in two colors: red and green correspond to
the left half (amino acids [1-49]) and the right half
(amino acids [50-99] of the protease sequence,
respectively. In the left cluster in Figure 4(a), there
are many left-half (red) amino acids interacting with
a few right-half (green) amino acids, whereas in the
right cluster, we observed the opposite pattern: many
right-half (green) amino acids are interacting with a
few left-half (red) amino acids. The X-ray 3D
structure of HIV-1 protease revealed that PR is
DetectingInteractingMutationClustersinHIV-1DrugResistance
39
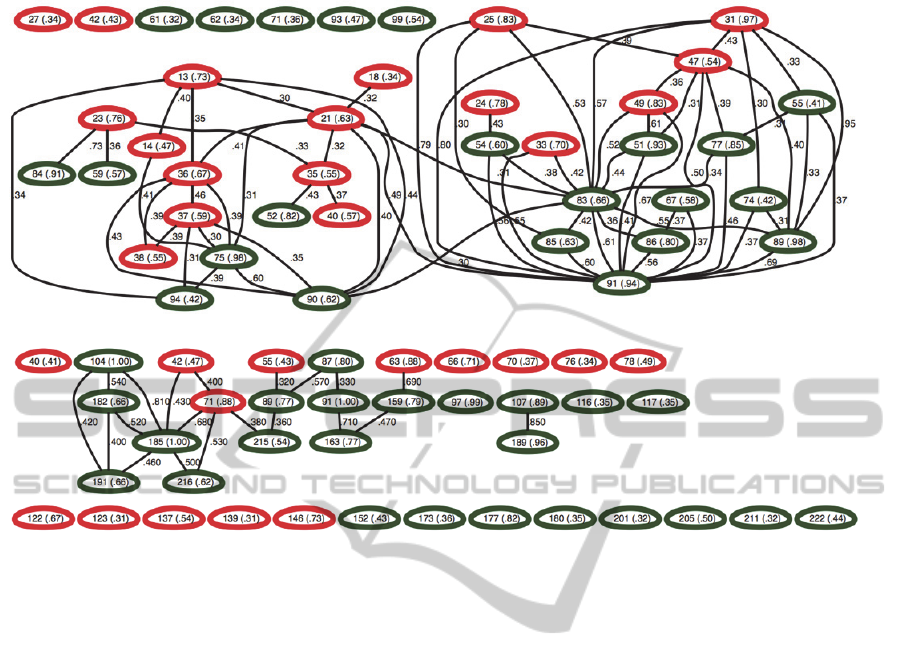
(a) Interaction graph for PR
(b) Interaction graph for RT
Figure 4: Interaction graphs constructed by our method for (a) PR and (b) RT, respectively. Within each node we show the
corresponding amino acid position along with its association probability in parenthesis. Each edge represents the joint
association between two nodes, along with interaction probabilities. In (a), red and green colors represent amino acids in the
first half [1-49] and the second half [50-99] of protease, respectively. In (b), green and red colors represent the finger and
the palm domain of reverse transcriptase, respectively.
composed of a homodimer, with each subunit
consisting of 99 amino acids. It is thus plausible that
the two clusters of interacting sites correspond to the
contact sites on the 3D structure of the two subunits
of HIV-1 protease. The subunits come together to
form a tunnel, and the active site of the protease is
located in its interior (Spinelli et al., 1991). Two
flexible flaps outside the tunnel move around to
allow proteins to enter the tunnel. Mutations at the
detected sites may have changed the way the tunnel
opens and closes, which then lead to drug resistance.
For RT gene (Figure 4b), we also draw the amino
acid positions in two colors: red and green
corresponding to the finger domain (amino acids [1-
84, 120-150]) and the palm domain (amino acids
[85-119, 151-243]) of HIV-1 reverse transcriptase,
respectively. All associated mutations we found are
within the finger and palm domains. We observed
several strong drug-resistant interactions between
the finger and palm domains, and also within the
palm domain. Interpreting these interactions based
on the current datasets, however, is difficult, because
the HIV-1 reverse transcriptase is composed of a
heterodimer: p66 and p51 (Rodgers et al., 1995).
While the p66 subunit consists of the full set of 560
amino acids, the p51 subunit only consists of 450 of
the 560 amino acids after post-translational
modification. As a result, the two subunits serve
different functions. While p66 is the catalytic
subunit with DNA polymerase and RNase H
activity, p51 is mainly responsible for stabilizing the
p66 subunit. The mutations at the detected positions
may affect the activity of either subunit, or both.
3.3 Significant Interactions and Effects
We finally used logistic regression to evaluate the
effects and the statistical significance of the detected
associations and interactions. We evaluated both
main effects and pairwise interaction effects
identified by our method. The regression terms are
those with posterior probability >0.3 from the bulk
datasets for PR and RT, respectively. To further
measure model fitting, we calculated Akaike
Information Criterion (AIC, Akaike, 1974) and
Bayesian Information Criterion (BIC, DiCiccio et al.
1997) of the main effect only model and the main +
pairwise interaction effect model.
BIOINFORMATICS2013-InternationalConferenceonBioinformaticsModels,MethodsandAlgorithms
40

Table 2: Amino acid positions with significant main and pairwise interaction effects in (a) protease and (b) reverse
transcriptase, respectively. The terms are classified by their significance levels. The minus sign indicates that the term has
negative effects to drug resistance. (c) shows the model fit using main effects only and main + interaction effect models.
(a) Protease
P-value Positions with main effects Pairs of interacting positions
0.05~0.01 (13,90), (25,91), (31,91), -(67,86), -(74,89), -(89,91)
0.01~0.001 67 -(13,94), -(18,21), (21,91), (23, 84), -(36,90),
-(51,83), (54,83), -(86,91)
<0.001 -13, -14, 24, 25, 31, 33, -36, -37, -38, -40, -42,
47, 49, 51, 55, -61, 62, -71, 74, 75, 77, 83, 85,
86, 89, -90, 91, -94, -99
(13,14), (21,36), (21,75), -(31,47), -(31,83), -(31,89),
-(33,91), (36,37), (36,38), -(47,91), -(55,91),
-(83,90), -(85,91)
(b) Reverse Transcriptase
P-value Positions with main effects Pairs of interacting positions
0.05~0.01 139, -177, 222 (71,215)
0.01~0.001 -97 -(42,185), -(104,191)
<0.001 42, 66, 70, 71, 76, -87, 91, 104, 107, 117, -122,
123, 152, -159, -163, 182, 185, 189, 191, -201,
-205, 211, -215, 216
-(42,71), -(63,159), -(71,185), -(104,182),
-(104,185), (159,163), -(182,185), -(182,191),
-(185,191), -(185,216)
(c) Model Fit
PR RT
AIC BIC AIC BIC
Main effect only 26736 27004 28736 28986
Main effect + pairwise interaction 26374 26975 28194 28548
As shown in Table 2(a,b), in both PR and RT, we
identified strong interaction effects between
mutations at different positions. Most of the detected
effects are highly significant (p-value < 0.001),
because those terms are identified by our method
with large posterior probabilities (>0.3). We further
show in Table 2(c) the comparison of the model fits
between the main effect model and the main +
interaction model. It is seen that the interaction
model has much better (smaller) AIC and BIC
values for both PR and RT. Combining all evidence
we have shown, we believe that there are strong
interactions among mutations at different positions
in the protein sequence jointly resisting drugs.
Interestingly, most interaction effects in the
regression models are negative, suggesting that the
effects of multiple mutations tend to be smaller than
their additive values. This observation may indicate
a threshold model for the genetic mechanism of drug
resistance: once the joint effects of multiple
mutations reached a threshold, it leads to a
phenotypic change (such as disabling the protein’s
active sites and resisting drugs), where additional
mutations contribute no more. We also observed
several negative main effects in both PR and RT,
indicating marginal drug susceptible positions.
4 CONCLUSIONS
We have introduced a novel Bayesian method to
analyze the complex mutation patterns for drug
resistance in HIV-1 protease and reverse
transcriptase. The important mutations identified by
our method agree with those reported in previous
studies (Johnson et al., 2008), but our results
revealed stronger cross-resistance of the detected
mutation sites, using posterior association
probabilities, than by previous studies (Rhee et al,
2006). In addition, we observed different groups of
RT drugs that showed deviation of mutation patterns
in drug resistance. The identified groups of drugs
coincided with the NRTI and NNRTI drug
categories, and within the NRTI drugs, D4T and
AZT further showed slightly but consistently
different mutation patterns from the others. The
mutation patterns for cross-resistance as well as
divergence to specific drugs revealed by our method
can shed lights on the design of new antiretroviral
drugs and on using genotypic drug resistance testing
to select optimal therapy (Rhee et al 2006). For
example, combination of drugs with the least cross-
resistance may be identified to improve the
effectiveness of HIV-1 drug treatment.
Using our method, we were able to reconstruct a
sophisticated interaction graph delineating the
detailed interaction relationships between amino
DetectingInteractingMutationClustersinHIV-1DrugResistance
41

acid positions in each protein sequence. From the
reconstructed interaction graphs, we observed
clusters of mutations at distant locations that work
together to resist drug binding. The mutation sites
within an interacting cluster are likely in close
contact in the protein folding space that jointly resist
drug binding. Our logistic regression analysis using
the identified interaction models revealed that most
identified interaction effects are statistically
significant, but have negative effects on drug
resistance. This observation may suggest a threshold
model that multiple occurrence of mutations up to a
threshold is needed to resist drug binding. In
addition, the negative main effects estimated by our
regression model also indicated positions that may
increase HIV-1 susceptibility to drugs. Follow-up
investigation of the directions and properties of
specific mutants at the identified amino acid
positions can help us truly understanding their
genetic mechanisms underlying drug resistance.
Molecular dynamics (MD) simulations (Zhang et al.
2010) can also be used to evaluate the molecular
basis of how mutations interfere with drug binding.
Previous works using the genotype-phenotype
data from Stanford HIVdb were mostly focusing on
predicting drug resistance from the genotype
information. The phenotype data were all measured
in vitro. Due to the complex disease progression and
pharmacokinetic factors, however, the phenotypes
measured in vitro may not necessarily imply
virologic failure in vivo (Shafer, 2002). Also,
predicting the failure of drug treatments does not in
general help us understanding its genetic and
molecular mechanisms, and provides little insights
to the development of optimal therapies. Our
analysis, in contrast, is not designed for predicting
phenotypes, but for identifying important mutation
sites and their interaction patterns that are directly
influencing drug resistance. Given the observed
strong correlation among mutations in PR and RT,
precisely pinpointing the causative mutations from
the genotype-phenotype data is an extremely
challenging inference problem. Our method utilizes
graphs to account for variable dependence.
Extensive simulation studies (Zhang, 2011) have
shown that our method is able to account for most
complex dependence structures and is more
powerful than existing methods to identify the true
models underlying the data. Only until recently
advanced statistical methods have been developed
for analyzing the HIV-1 drug resistance data for
detecting mutation interactions (Haq et al., 2009);
Zhang et al., 2010); (Hinkley et al., 2011). Yet those
methods do not sufficiently address the correlation
problem, and thus have limitation in their abilities to
find complex interactions.
Our analysis of the Stanford HIVdb datasets is
still preliminary. Several complications have not
been considered in our current model. For
simplicity, we only considered mutation versus wild
type at each amino acid position. An obvious
extension of the analysis is to include the specific
mutation types into our model. We can solve this
problem by introducing a dummy variable for each
type of mutants, and expanding the current datasets
of L amino acids to L
p dummy variables, where p
denotes the average number of different mutants per
position. Such an extension is straightforward,
although it requires further computing. Also, we
only considered two categories of drug resistance
levels in this study: susceptible versus intermediate
to stringent resistance. Given that the basis function
in our model is multinomial distribution, it is
straightforward to extend the current model to
include k levels of drug resistance. It is also possible
to directly include the continuous IC50 values into
our model by defining a continuous probability basis
function. In addition, the bulk datasets we analyzed
contain HIV-1 isolates from various studies of
different drug treatments. It is thus possible that
there are subpopulations in both treated and
untreated samples. Population structure and possibly
other confounding factors may bias our statistical
analysis. A remedy is to perform isolate-matching
(based on their genetic contents) between cases and
controls before running our algorithm. Alternatively,
we may design a hierarchical model for the drug
resistance of different drugs, where each mutation
can be classified as either cross-resistant or drug (or
study) specific, depending on whether the
distribution of the mutations agree across different
drug treatments (or studies). Such an analysis will
then directly reveal cross-resistant and drug-specific
mutations interconnected in a hierarchal way for
downstream use. Finally, HIV-1 integrase is another
critical protein for the HIV development. It is
desirable to further analyse the HIV-1 integrase drug
resistance data if available.
In summary, we have demonstrated the potential
of our method and the feasibility of reconstructing
the complex structure of mutation patterns in HIV-1
drug resistance datasets. Further investigation of the
growing Stanford HIVdb datasets and development
of new advanced statistical methods are warranted
for improving the potency of drugs to combat HIV
resistance. Our method is also generally applicable
to other studies for understanding the complex
phenotype-genotype relationships, such as human
BIOINFORMATICS2013-InternationalConferenceonBioinformaticsModels,MethodsandAlgorithms
42

complex disease studies and cancer studies.
ACKNOWLEDGEMENTS
This work is partially supported by grants NIH
R01HG004718 and NIH 1UL1RR033184 to YZ.
SOFTWARE
The method discussed in this paper is implemented
in the BEAM3 package and is freely available for
academic use. The package can be downloaded at:
http://stat.psu.edu/~yuzhang/software/beam3.tar
REFERENCES
Akaike H., 1974. A new look at the statistical model
identification. IEEE Transactions on Automatic
Control, 19:716–723
Beerenwinkel, N., Schmidt, B., Walter, H., Kaiser, R.,
Lengauer, T., Hoffmann, D., Korn, K., Selbig, J.,
2002. Diversity and complexity of HIV-1 drug
resistance: A bioinformatics approach to predicting
phenotype from genotype. Proc Natl Acad Sci USA,
99:8271–8276.
DiCiccio, T. J., Kass, R. E., Raftery, A., Wasserman, L.,
1997. Computing Bayes factors by combining
simulation and asymptotic approximations, J Am Stat
Assoc, 92:902-915.
Haq, O., Levy, R. M., Morozov, A. V., Andrec, M., 2009.
Pairwise and higher-order correlations among drug-
resistance mutations in HIV-1 subtype B protease.
BMC Bioinformatics, 10(Suppl 8):S10.
Hinkley, T., Martins, J., Chappey, C., Haddad, M.,
Stawiski, E., Whitcomb, J. M., Petropoulos, C., and
Bonhoeffer, S., 2011. A systems analysis of
mutational effects in HIV-1 protease and reverse
transcriptase. Nat Genet. 43:487-490.
Johnson, V. A., Brun-Vezinet, F., Clotet, B., Gunthard, H.
F., Kuritzkes, D. R., Pillay, D., Schapiro, J. M.,
Richman, D. D., 2008. Update of the drug resistance
mutations in HIV-1. Top HIV Med, 16:62–68.
Liu, T. F., and Shafer, R. W., 2006. Web resources for
HIV type 1 genotypic-resistance test interpretation.
Clin Infect Dis, 42:1608–1618.
Pitman, J., and Yor, M., 1997. The two-parameter
Poisson-Dirichlet distribution derived from a stable
subordinator. Ann Prob. 25:855-900.
Saigo, H., Uno, T., Tsuda, K., 2007. Mining complex
genotypic features for predicting HIV-1 drug
resistance. Bioinformatics, 23:2455–2462
Shafer, R. W., 2002. Genotypic testing for Human
Immunodeficiency Virus type 1 drug resistance. Clin
Microbiol Rev, 15:247–277.
Spinelli, S., Liu, Q. Z., Alzari, P. M., Hirel, P. H., Poljak,
R. J., 1991. The three-dimensional structure of the
aspartyl protease from the HIV-1 isolate BRU.
Biochimie. 73:1391-1396.
Ravela, J., Betts, B. J., Brun-Vezinet, F., Vandamme, A.
M., Descamps, D., van Laethem, K., Smith, K.,
Schapiro, J. M., Winslow, D. L., Reid, C., Shafer, R.
W., 2003. HIV-1 protease and reverse transcriptase
mutation patterns responsible for discordances
between genotypic drug resistance interpretation
algorithms. J Acquir Immune Defic Syndr, 33:8–14.
Rhee, S. Y., Taylor, J., Wadhera, G., Ben-Hur, A.,
Brutlag, D. L., Shafer, R. W., 2006. Genotypic
predictors of human immunodeficiency virus type 1
drug resistance. Proc Natl Acad Sci USA. 46:17355-
17360.
Rodgers, D. W., Gamblin, S. J., Harris, B. A., Ray, S.,
Culp, J. S., Hellmig, B., Woolf, D. J., Debouck, C.,
Harrison, S. C., 1995. The structure of unliganded
reverse transcriptase from the human
immunodeficiency virus type 1. Proc Natl Acad Sci
USA. 92:1222-1226.
Zhang, J., Hou, T. J., Wang, W., and Liu, J. S., 2010.
Detecting and understanding combinatorial mutation
patterns responsible for HIV drug resistance. Proc
Natl Acad Sci USA, 107:1321-1326.
Zhang, Y., 2011. A Novel Bayesian Graphical Model for
Genome-Wide Multi-SNP Association Mapping.
Genet Epi, 36:36-37.
DetectingInteractingMutationClustersinHIV-1DrugResistance
43
