
Infrequent, Unexpected, and Contrast Pattern Discovery
from Bacterial Genomes by Genome-wide Comparative Analysis
Daisuke Ikeda
1
, Osamu Maruyama
2
and Satoru Kuhara
3
1
Dept. of Informatics, Faculty of Information Science and Electrical Engineering, Kyushu Univ., Fukuoka, Japan
2
Div. of Applied Mathematics, Institute of Mathematics for Industry, Kyushu Univ., Fukuoka, Japan
3
Dept. of Bioscience & Biotechnology, Faculty of Agriculture, Kyushu Univ., Fukuoka, Japan
Keywords:
Peculiar Compositions, Long Patterns, Transposon, RNA, Data Sparseness, Z-score.
Abstract:
With plenty of sequences, comparative genomics is becoming important. Its basic approach is to find similar
subsequences from the sequences of different species and then examine differences in detail among found
similar parts. Instead of focusing on similar parts, this paper is devoted to find different parts directly from the
whole DNA sequences. It is challenging because the large size prohibits computationally expensive methods
and there exits so many differences in case of genome-wide comparison. To cope with this, we exploit the
algorithm in (Ikeda and Suzuki, 2009), which finds unexpected, infrequent patterns. But, found patterns
was not evaluated from the viewpoint of biology. In this paper, we show that patterns discovered by the
algorithm from bacterial genome sequences match well biological features, such as RNA and transposon.
Therefore, assuming these features as relevant regions, we compute F-measure values and show that some
species achieves about 90%, which is one order of magnitude better than patterns found by an existing method.
Thus, we conclude that the algorithm can find these infrequent, but biologically meaningful patterns from
genome-wide sequences.
1 INTRODUCTION
Compared to find similar subsequences, it is much
more difficult to find different parts from long se-
quences. In fact, existing comparison methods try
to detect some differences by focusing on regions
homologous to the sequences, instead of comparing
whole unknown sequences. In this case, we can use
computationally expensive methods because the size
of inputs is limited. The goal of this paper is to
develop a methodology for detecting differences of
genome-wide sequences directly.
To detect differentparts as patterns from two input
strings, it is natural to find contrast patterns. How-
ever, contrast patterns are frequent but expected be-
cause they are frequent in one of the input strings. On
the other hand, existing methods in comparative ge-
nomics can detect detailed, and thus infrequent, dif-
ferences but they require limited parts of the whole
sequences as input strings. Therefore, this paper fo-
cuses on contrast patterns, which are infrequent and
unexpected, directly from genome-wide sequences.
Recently, an algorithm to find exceptional patterns
in text data as peculiar compositions of frequent sub-
strings is proposed (Ikeda and Suzuki, 2009). In this
framework, a background set B of strings is assumed
to be given to the algorihtm, as well as a target set T
of strings. For two strings x and y, we say that a com-
position w = x· y is peculiar if each of x and y is more
frequent in B than in T and conversely w = xy is more
frequent in T. From the definition, a discovered xy
is exceptional in the sense that the frequency f
T
(xy)
of xy in T is much larger than f
B
(xy) although f
B
(x)
and f
B
(y) are much larger than f
T
(x) and f
T
(y). In
other words, the observed frequency f
T
(xy) is much
larger than the expected frequency, which is defined
by f
S
(x) · f
S
(y), where x and y are frequent in the
background set. We can find peculiar compositions
which can not be found by z-score (Ikeda and Suzuki,
2009). However, the significance of found peculiar
compositions was not verified from the view point of
genome informatics (Ikeda and Suzuki, 2009).
The main contribution of this paper are threefold.
Firstly, we show that most of found peculiar com-
positions appear in specific regions, such as RNA
and transposon, given the whole genome sequences
of bacteria as the target and background sets. Sec-
ondly, we quantitatively evaluate found peculiar com-
308
Ikeda D., Maruyama O. and Kuhara S..
Infrequent, Unexpected, and Contrast Pattern Discovery from Bacterial Genomes by Genome-wide Comparative Analysis.
DOI: 10.5220/0004241203080311
In Proceedings of the International Conference on Bioinformatics Models, Methods and Algorithms (BIOINFORMATICS-2013), pages 308-311
ISBN: 978-989-8565-35-8
Copyright
c
2013 SCITEPRESS (Science and Technology Publications, Lda.)

Table 1: List of DNA sequences used in experiments.
Name Accession # Role GC% Length (bp)
E. coli NC 000913 Background 50.8 4,639,675
M. tuberculosis NC 000962 Train 65.6 4,411,532
B. subtilis NC 000964 Train 43.6 4,214,630
B. fragilis NC 003228 Train 43.2 5,205,140
G. metallireducens NC 007517 Test 59.6 3,997,420
C. welchii NC 008261 Test 28.4 6,513,368
H. pylori NC 012973 Test 39.2 1,576,758
positions by F-measure. F-measure values of pecu-
liar compositions are one order of magnitude larger
than those of substrings extracted by z-score crite-
ria. Thirdly, we develop how to set parameters so that
the evaluation value becomes high using training data,
and then verify these parameters using test data.
2 RELATED WORK
Putting some limitations on the syntax of patterns,
contrast pattern finding methods are expected to
find infrequent patterns (Beißbarth and Speed, 2004;
Huang et al., 2003; Ji et al., 2005). However, some
domain specific knowledge is necessary to define
such a word properly.
To find infrequent patterns, or under-represented
patterns, scores based on statistical testing have also
been extensively studied (Apostolico et al., 2000;
Horng et al., 2002; Leung et al., 1996; Marschall and
Rahmann, 2009; Schbath, 1997; Robin et al., 2005),
such as z-score and χ
2
-score. These scores assume
a probabilistic model and, to find infrequent patterns,
use the deviation of frequencies of candidate patterns
from their expected frequencies. However, mining al-
gorithms based on statistical testing suffer from the
data sparseness problem, which is an appearance of
Zipf’s law. Therefore, it is important to decide appro-
priate lengths of subsequences. However, it is difficult
to decide an appropriate length since subtle changes
on the length make large difference on the number of
candidate patterns.
3 EXPERIMENTS
3.1 Data Sets
The data sets used in our experiments are whole DNA
sequences of 7 bacteria (Table 1). We use the whole
DNA sequence as input data.
As the common background set for all experi-
ments in this section, we choose E. coli since it is a
Table 2: Trained parameters achieving highest F
1/4
values,
and corresponding precisions and recalls, for training se-
quences.
#
θ
B
η precision recall F
1/4
NC 000964 1.9 8 0.8047 0.1534 0.6438
NC
003228 2.4 6 0.7567 0.1345 0.5949
NC
000962 1.9 7 0.4199 0.0327 0.2476
well-studied species. As a training target data, we use
B. subtilis, which is another popular bacterium. In
addition to that, we use B. fragilis and M. tuberculo-
sis because we have already found that the length and
GC content of a target sequence affect found pecu-
liar compositions from preliminary experiments and,
compared to B. subtilis, B. fragilis has a similar GC
content and a longer length while M. tuberculosis a
larger GC content and a similar length.
3.2 Training Parameters
FPCS requires three parameters θ
T
, θ
B
and η. We set
θ
T
= 2, which is the minimum integer greater than 1,
because it is shown that the least influential parame-
ter among these parameters is θ
T
(Ikeda and Suzuki,
2009). To decide other two parameters, we caluculate
F
β
=
(1+ β
2
) · P· R
β
2
· P+ R
,
where P and R denote precision and recall, respec-
tively, and both of them are defined by positions of
features on target sequences.
We choose β = 1/4 for F
β
which weighs precision
four times as much as recall although F-measure typ-
ically means F
1
, which puts weight on precision and
recall equally. However, our goal is not to find these
features but to show that found peculiar compositions
match biological features. To this end, precision val-
ues are desired to be high while we do not need high
recall values.
Table 2 shows trained parameters, where RNAs
are considered as relevant features for B. subtilis and
B. fragilis, and transposons for M. tuberculosis. From
genetic maps, like 1, we find that relevant features are
different. This is because GC-content of M. tubercu-
losis is much larger than those of the other sequences.
Infrequent,Unexpected,andContrastPatternDiscoveryfromBacterialGenomesbyGenome-wideComparativeAnalysis
309

Table 3: Evaluation values on parameter sets for test target
sequences, where “*” stands for the highest F
1/4
for each
target sequence.
θ
B
θ
T
η
precision recall F
1/4
H. pylori
1.6 2 2 0.5066 0.1133 0.4207
1.7 2 2
0.5789 0.0936 0.4436
*1.8 2 2
0.6467 0.0799 0.4563
1.9 2 2
0.6614 0.0681 0.4372
2.0 2 2
0.7035 0.0605 0.4330
C. welchii
2.7 2 6 0.9654 0.3685 0.8814
2.8 2 6
0.9655 0.3663 0.8807
*2.9 2 6
0.9690 0.3608 0.8816
3.0 2 6
0.9744 0.3487 0.8814
3.1 2 6
0.9797 0.3316 0.8787
G. metallireducens
1.5 2 7 0.5020 0.2114 0.4645
1.6 2 7
0.5350 0.1789 0.4789
*1.7 2 7
0.5698 0.1351 0.4791
1.8 2 7
0.6080 0.1037 0.4727
1.9 2 7
0.6187 0.0768 0.4372
From this table, two values for θ
B
are the same and
the other value is much larger while all values for η
are similar This difference comes from the length of
target sequences. In case of M.tuberculosis, we have
lower values for F
1/4
, compared to other sequences.
This may be because trasnposons moves and thus they
are not preserved well compared to RNAs which play
important roles commonly in different species.
3.3 Test Tuned Parameters
Table 3 shows evaluation valuesfor some values to the
parameters. For H. pylori, we choose much smaller
values for η since it is much shorter than B. subtilis
while we choose similar values for θ
B
. In the case
that the size of the target sequence is too small, the
value of η have much more influence on F
1/4
than θ
B
.
We choose similar (resp. larger) values than those for
B. subtilis since G. metallireducens (resp. C. welchii)
is similar (resp. longer) than B. subtilis. From GC-
contents of target sequences, RNA related features are
relevant for H. pylori and C. wlechii, and transposons
for G. metallireducens. From the table, we find that
findings about size and GC-content are confirmed us-
ing test target seqquences.
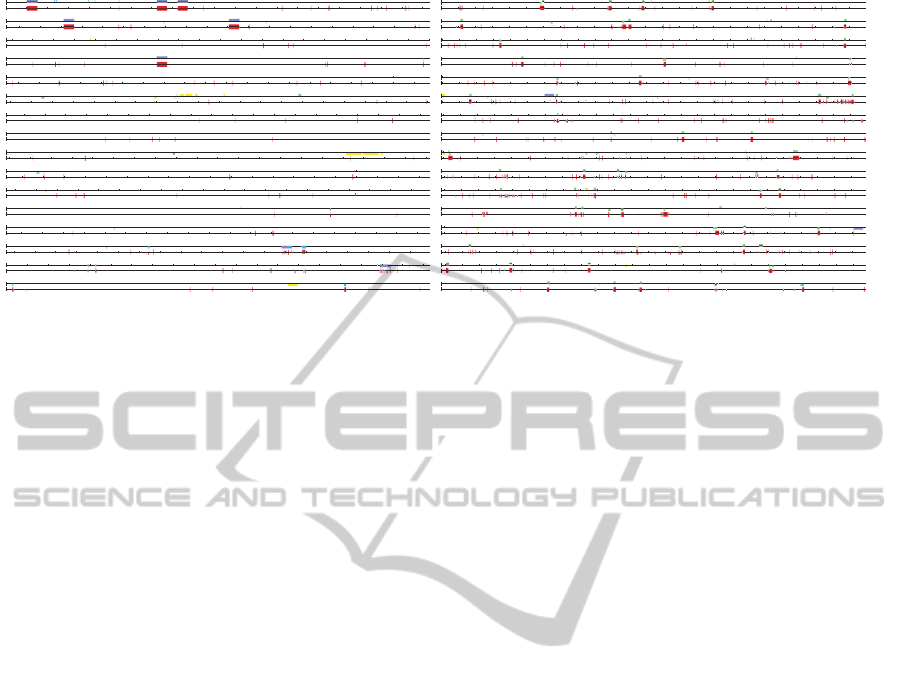
From Figure 1, we see that found peculiar com-
positions from C. welchii (left-hand side) match well
to RNA related features (red regions) and those from
G. metallireducens (right-hand side) to transposons
(green ones).
From these test data, we conclude that we can
set θ
B
and η, according to the size of a target set,
Table 4: F
1/4
values, where extracted patterns are substrings
with length N whose z-scores are less than “threshold” and
RNA, transposon, and phage are relevant features.
Data N threshold #
F
1/4
NC 000913 6 -30.0 58 0.0753
NC 000913 6 -33.0 9 0.0182
NC 000913 9 -4.20 177 0.0053
NC 000913 9 -4.29 18 0.0005
NC 000964 6 -30.0 11 0.0329
NC 000964 6 -32.0 2 0.0197
NC 000964 9 -5.0 75 0.0055
NC 000964 9 -5.2 16 0.0011
and found peculiar compositions match RNAs (resp.
transposons) if GC-content of the target set is similar
to (resp. larger than) that of B. subtilis.
3.4 Comparison with z-score
In this section, we compare with another criteria to
find infreqeunt, unexpected patterns. As such a crite-
ria, we choose z-score, which is usually defined over
substrings with fixed length.
A z-score for a substring w is defined as z(w) =
( f(w)− E(w))/N(w), where f(w) is the observed fre-
quency of w in a given data, E(w) its expected value
of w under an assumed probabilistic model, and N(w)
a normalization factor of ws (Parida, 2007). Now we
assume the Bernoulli model, that is, each letters oc-
curs independetly, and probabilities of four letters are
estimated from the target set.
We use all of RNA, transposon, and phage as rel-
evant features to evaluate F
1/4
values (see Table 4).
Among all of the substrings with length N, it is nec-
essary to extract some substrings whose z-score val-
ues are small. As a threshold value for the extraction
is given in “#” column, and the next column is the
number of substrings obtained by the threshold value.
From this table, we see that F
1/4
values by z-score cri-
teria are one order of magnitude lower than those by
FPCS.
4 CONCLUSIONS
We have confirmed that most of found substrings
found by FPCS (Ikeda and Suzuki, 2009) match
RNAs and transposons very well. Unlike many ex-
isting methods to find regulatory regions, we just give
two DNA sequences to FPCS. The only thing we have
to do is to set three parameters, and we have devel-
oped how to set them, according to the size of give
input sequences.
It is a challenging and important future work
BIOINFORMATICS2013-InternationalConferenceonBioinformaticsModels,MethodsandAlgorithms
310
100
00
00
200
0000
300
0000
100
00
00
200
0000
30000
00
100
00
00
200
00
00
300
00
00
1000000
200
00
00
3000000
Figure 1: Gennetic maps of the whole DNA sequences of C. welchii (left-hand side) and G. metallireducens (right-hand side)
with two tracks, where RNAs, transposon, and phage are colored in blue, green and yellow, respectively, on the above track,
and found peculiar compositions are colored in red on the below track.
to conduct experiments on other species. Peculiar
compositions found in bacterial DNA sequences are
densely-located even when they are not included in
known biological features. We believe that such re-
gions are worth investigating and thus this is also an
important future work.
ACKNOWLEDGEMENTS
This work was supported by JSPS KAKENHI Grant
Number 24300059.
REFERENCES
Apostolico, A., Bock, M. E., Lonardi, S., and Xu, X.
(2000). Efficient Detection of Unusual Words. J. of
Comput. Biol., 7(1/2):71–94.
Beißbarth, T. and Speed, T. P. (2004). GOstat: Find Sta-
tistically Overrepresented Gene Ontologies within a
Group of Genes. Bioinformatics, 20(9):1464–1465.
Horng, J.-T., Huang, H.-D., Huang, S.-L., Yang, U.-C., and
Chang, Y.-C. (2002). Mining Putative Regulatory El-
ements in Promoter Regions of Saccharomyces Cere-
visiae. In Silico Biology, 2(3):263–273.
Huang, H.-D., Chang, H.-L., Tsou, T.-S., Liu, B.-J., Kao,
C.-Y., and Horng, J.-T. (2003). A Data Mining
Method to Predict Transcriptional Regulatory Sites
Based on Differentially Expressed Genes in Human
Genome. J. of Info. Sci. and Eng., 19(6):923–942.
Ikeda, D. and Suzuki, E. (2009). Mining Peculiar Compo-
sitions of Frequent Substrings from Sparse Text Data
Using Background Texts. In Proc. of ECML PKDD,
pages 596–611.
Ji, X., Bailey, J., and Dong, G. (2005). Mining Minimal
Distinguishing Subsequence Patterns with Gap Con-
straints. In Proc. of ICDM, pages 194–201.
Leung, M.-Y., Marsh, G. M., and Speed, T. P. (1996). Over-
and Underrepresentation of Short DNA Words in Her-
pesvirus Genomes. J. of Comput. Biol., 3(3):345–360.
Marschall, T. and Rahmann, S. (2009). Efficient Exact Mo-
tif Discovery. Bioinformatics, 25(12):i356–i364.
Parida, L. (2007). Pattern Discovery in Bioinformatics:
Theory & Algorithms. Chapman & Hall/CRC.
Robin, S., Rodolphe, F., and Schbath, S. (2005). DNA,
Words and Models: Statistics of Exceptional Words.
Cambridge University Press.
Schbath, S. (1997). An Efficient Statistic to Detect Over-
and Under-represented Words in DNA Sequences. J.
of Comput. Biol., 4(2):189–192.
Infrequent,Unexpected,andContrastPatternDiscoveryfromBacterialGenomesbyGenome-wideComparativeAnalysis
311
