
Drowsiness Detection by Electrooculogram Signal Analysis in Driving
Simulator Conditions for Gold Standard Signal Generation
N. Rodríguez-Ibáñez
1
, P. Meca-Calderón
2
, M. A. García-González
3
, J. Ramos-Castro
3
and M. Fernández-Chimeno
3
1
Biomedical Engineer at Ficosa International S.A, Can Magarola,
Ctra. C-17 km 13. E-08100 Mollet del Valles, Barcelona, Spain
2
Software Engineer at Idneo Technologies S.L, Pol. Ind. Can Mitjans, 08232, Viladecavalls, Barcelona, Spain
3
Group of Biomedical and Electronic Instrumentation of the Department of Electronic Engineering of the Technical
University of Catalonia (UPC), Barcelona, 08034, Spain
Keywords: Drowsiness Detection, Gold Standard, Driver Monitoring, Electrooculogram, Electroencephalogram.
Abstract: Detection of drowsiness while driving is a leading objective in advanced driver assistance systems. This
work presents a new index to assess the alertness state of drivers based on the EOG dynamics derived from
a polysomnography device. More than 15 hours of laboratory tests were analyzed in order to detect
drowsiness while doing cognitive activities. The proposed method has a sensitivity of 92, 41% and a VPP of
93,41% in detecting drowsiness. The results show that the proposed index may be promising to assess the
alertness state of real drivers.
1 INTRODUCTION
Drowsiness is one of the main causes of vehicle
accidents. A recent study showed that 20% of
crashes and 12% of near-crashes were caused by
drowsy drivers (NHTSA VSR, 2006). The morbidity
and mortality associated with drowsy-driving
crashes are high, perhaps because of the higher
speeds involved combined with delayed reaction
time (Faber, 2004).
Driver behaviour monitoring, and the reliable
detection of drowsiness and fatigue is one of the
leading objectives in the development of new
Advanced Driver Assistance Systems (ADAS). Of
the use of biomedical signal analysis to detect
drowsiness in real vehicles appears the need of an
objective gold standard to compare with the selected
signals, in this case thoracic effort. The most
objective signal to assess the sleep onset phase is
Electroencephalography (EEG). The problem
associated to this signal is that, in real environments
(i.e. vehicles) the actual devices used in hospital
environment to acquire de data presents artefacts due
to vibration and movements of the vehicle that
masks the real EEG signal.
The aim of this work is validate the EOG signal
as a new Gold Standard and the EOG acquisition
device as a good quality device to ensure the optimal
quality of the data. The EOG signal is a highly
robust to artifacts signal related to EEG valuable to
compare with our drowsiness detection index based
on thoracic effort variability (TEDD) in real
environments. (Rodríguez-Ibáñez, 2011)
2 PRIOR WORK
2.1 EEG and EOG Signals as Gold
Standard
During active wakefulness (i.e., when the person is
awake and pursuing normal activities), the EEG is
characterized by high frequencies (i.e., 16 to 25 Hz)
and low voltage (i.e., 10 to 30 microvolts). EOG
readings during wakefulness exhibit Rapid Eye
movements (REM).
During relaxed wakefulness (i.e., when a person
is awake but has his or her eyes closed and is
relaxed), the EEG is characterized by a pattern of
alpha waves with a frequency of 8 to 12 Hz and an
amplitude of 20 to 40 microvolts. EOG readings
57
Rodríguez-Ibáñez N., Meca-Calderón P., García-González M., Ramos-Castro J. and Fernández-Chimeno M..
Drowsiness Detection by Electrooculogram Signal Analysis in Driving Simulator Conditions for Gold Standard Signal Generation.
DOI: 10.5220/0004241500570063
In Proceedings of the International Conference on Biomedical Electronics and Devices (BIODEVICES-2013), pages 57-63
ISBN: 978-989-8565-34-1
Copyright
c
2013 SCITEPRESS (Science and Technology Publications, Lda.)

show slow, rolling movements (Roehrs, 2011),
increase of blinking frequency and lots of saccadic
response at the transition to NREM sleep onset
(Dinges, 2005).
2.2 EEG and EOG Signals Acquisition
in Real Driving Environments
The most important handicap in the field of
drowsiness detection in real driving environments is
the fact that the filtration of the low amplitude
biomedical signals in order to eliminate vibration
and movement artifacts is a very complex work that,
in most cases, also affects the original signal of
interest.
Hundreds of real vehicle tests have been made in
the last three years with the objective of finding a
biomedical signal robust to artifacts and also related
to sympathetic-vagal system to provide drowsiness
information in real vehicle tests.
The EEG signal has always been the most
objective signal to define drowsiness in laboratory
conditions but in real vehicle tests the EEG signal
presents several problems as artefacts and the fact
that the EEG codifications Rechtschaffen & Kale’s
method (Rechtschaffen & Kale, 1968) is only
recommended with closed eyes. According to the
EEG-EOG studies there is a relation between EEG
waves and EOG patterns that allows generating an
objective Gold Standard signal for drowsiness
detection from EOG signal.
For the first real vehicle tests the EEG and EOG
signal was acquired with a Bitmed eXim Pro
polysomnography device. The EOG signal quality
was good before and after filtering the vehicle
vibrations and movement artifacts but the EEG
signal was lost in the filtering process due to the fact
that the frequency of the vibrations was the same
frequency that the waves of interest (theta and alpha
waves).
Following this results, currently we have focused
on find new devices that avoids the problem of the
artifacts in EEG signal. Two different tests have
been made in real vehicle with two different
polysomnography devices:
- Nicoletta wireless device
- Bionic EEG holter that provides active electrode
technology
Although both systems show improvements in the
EEG signal quality it hasn’t enough quality to
extract the drowsiness information. The filtering
solution had the same problems that with other
polysomnography devices.
Taking in to account this results and the fact that
the EEG and the EOG signals are physiologically
related we recommend the use of EOG data as Gold
Standard in real vehicle tests. This work proposes
different indexes based on slow eye movement’s
detection, blinking frequency and saccade
movement’s inhibition.
3 MATERIALS AND METHODS
3.1 Measurement Protocol
The participants in the test were 17 male and 6
female with ages between 20 and 29 years and no
clinical conditions. These tests were designed and
performed in laboratory conditions.
To perform these tests the setup was equipped
with a biomedical monitor (Bitmed eXim Pro,
BitMed) and a webcam. The biomedical signals
selected as significant for this test were the external
observer (video), Electrooculography (EOG) and
thoracic effort. The thoracic effort signal was
measured in all cases using an inductive band
located at the middle trunk above the diaphragm.
The EOG signal was measured with four
Electromyography (EMG) single electrodes: two
were located in the outer cantus of each eye in the
case of the horizontal EOG setup, and two more
electrodes located in the upper part and in the lower
part of the right eye (Fig. 1). The EOG and the
respiratory signal were sampled at 100 Hz.
Figure 1: EOG instrumentation.
Video signal was recorded to generate the
external observer variable.
3.2 Test Design
The test was designed to classify the different eye
movements and set a level of eye activity or eye
inactivity (related to drowsiness). The test setup
consists of a vehicle seat and a 19’’ inches monitor
in front so the subject of the tests can see the
patterns classification video seated on the vehicle
BIODEVICES2013-InternationalConferenceonBiomedicalElectronicsandDevices
58
seat. The test has two parts:
a) Patterns classification part.
Once the subjects are seated and connected to the
acquisition systems the first part starts and they were
asked to watch a 5 minutes video with the objective
of follow the point on the video movements of the
point in the screen represents the movement of the
eye for the following patterns of interest:
- Saccadic movement
- Compensation movements
- Blinking
- Fixed gaze
- Seeking movements
- Slow Eye Movements (SEM)
The monitor has to be no more than 15 cm far from
the face of the subject.
b) Drowsiness state classification part
The subject rest relaxed in the seat for over 20
minutes with eyes open.
3.3 Patterns Classification
The patterns selected as indicative of drowsiness
where the following:
3.3.1 Saccadic Movement
Saccadic movements are defined as rapid symmetric
eye movements with the objective of constantly
change the retinal focus from one point to the next
point in the visual path.
There is a linear relation between the size of the
saccade and the velocity of the ocular movement.
The mean duration of saccadic movements ranges
between 30 and 120 ms.
In an awaken state these movements are mostly
voluntary and they are used to redirect the gaze to
the point of interest of the scene. In fatigue and
drowsy states the saccadic speed decreases (Galley,
1989, 1993, 1998; Sirevaag & Stern, 2000) and the
latent period between saccades increases.
3.3.2 Compensation Movement
Compensation movements are reflex movements
that imply the coordination of both eyes. These
movement works as an object fixation mechanism
while moving head or body. The most important is
the Vestibulo-Ocular Reflex (VOR) with a response
time of 16ms.
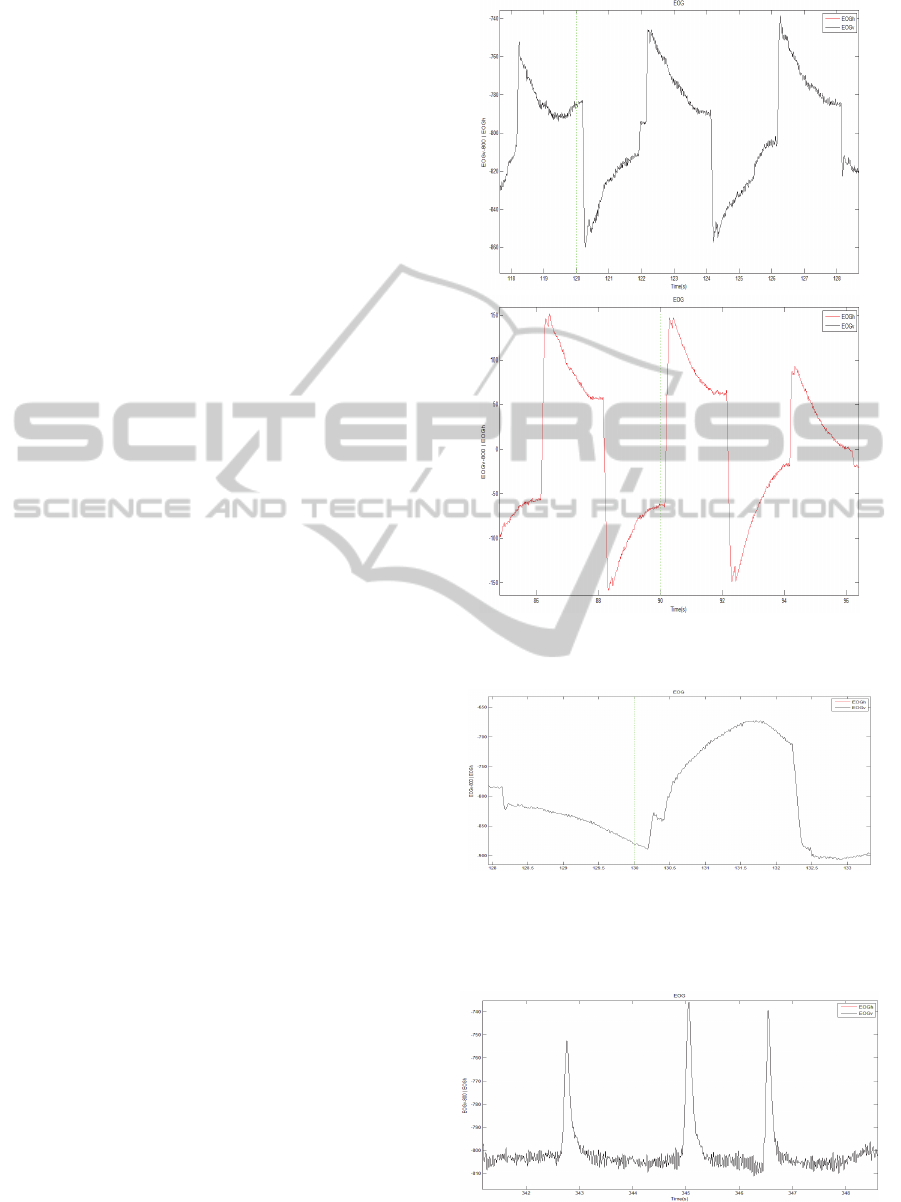
Figure 2: EOGv saccades (black) and EOGh saccades in
red. Filter: band-pass 0.2-30Hz.
Figure 3: Compensation movement in EOGv signal.
Band-pass filter 0.2-30Hz.
3.3.3 Blinking
Figure 4: Blinking pattern on EOGv signal. Band-pass
filtering 0.2-30Hz.
DrowsinessDetectionbyElectrooculogramSignalAnalysisinDrivingSimulatorConditionsforGoldStandardSignal
Generation
59
Blinking is the rapid closing and opening of the
eyelid that provides moisture to the eye by irrigation
using tears and a lubricant that the eyes secrete. The
mean frequency of blinks in a normal subject is 12
to 19 blinks per minute. This frequency can be
influenced by internal or external factors. Fatigue
and drowsiness decreases the blinking rate and
increases the percentage of eye closure time.
3.3.4 Fixed Gaze
The fixed gaze or ocular movement fixation can be a
characteristic pattern of interest in one point or low
cognitive activity depending on the duration of the
pattern. In a normal context the fixed gaze duration
ranges between 200ms and 350ms with open eyes.
In phases of fatigue or drowsiness the fixed gaze
time can reach 3 seconds becoming an ocular lost of
activity (Salthouse and Ellis, 1980); (Viviani, 1990).
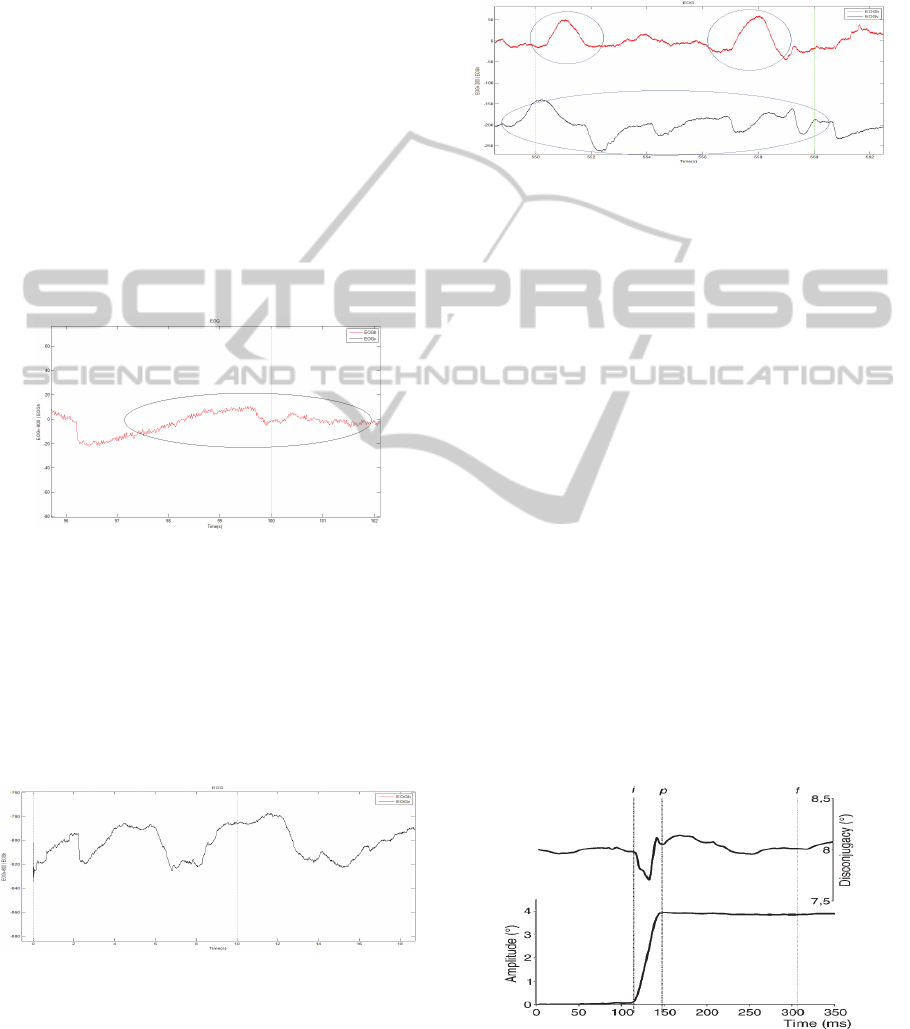
Figure 5: EOGh fixed gaze pattern. Ban-pass filter 0.2-
30Hz.
3.3.5 Seeking Movements
Seeking movements are coordinated movements
between two eyes with the porpoise of follow slow
visual stimuli. Their function is to stabilize the
dynamic visual image in the retina with velocities
between 1 and 30º/s.
Figure 6: Seeking movement in EOGv signal. Band-pass
filter 0.2-30Hz.
3.3.6 Slow Eye Movements (SEM)
Slow eye movements are eye movements with
duration between 1 and 3 seconds mostly detected in
the horizontal component of the EOG. This
movement is characteristic of drowsiness states. Its
characteristic of sleep onset with eyes closed but this
pattern can also be seen with open eyes in drowsy
drivers fighting for not to fall sleep.
Figure 7: SEM. Band-pass filtering 0.2-30Hz.
3.4 Drowsiness Indicators
Awaken estate has been defined as a state of high
activity and information interchange between the
subject and the environment (Phase 0), Fatigue as a
state of lack of energy and motivation (Phase 1) and
drowsiness as a state related to the sleep onset. Only
some of the EOG patterns explained have direct
relation with the sleep onset:
Blinking – An increase of the blinking frequency in
addition to an increase of the percentage of eye
closure are indicative of sleep onset.
Saccade – The number of saccades and the detection
of fixations combined can be an index to estimate
the ocular activity assuming saccades as activity and
fixation as no activity. There is a direct relation
between the reaction time of the subject and the
velocity of the saccade movement.
Slow Eye Movements (SEM) – During the transition
of awake to sleep is very common the appearance of
slow eye movements (SEM), like pendulum low
frequency (0.1-1hz) movements in the horizontal
line of the eye.
Figure 8: Determination of the beginning and the final of
the saccade movement. Binocular motor coordination
during saccades and fixations while reading: A magnitude
and time analysis (Vernet et al., 2011).
BIODEVICES2013-InternationalConferenceonBiomedicalElectronicsandDevices
60
4 EOG SIGNAL PROCESSING
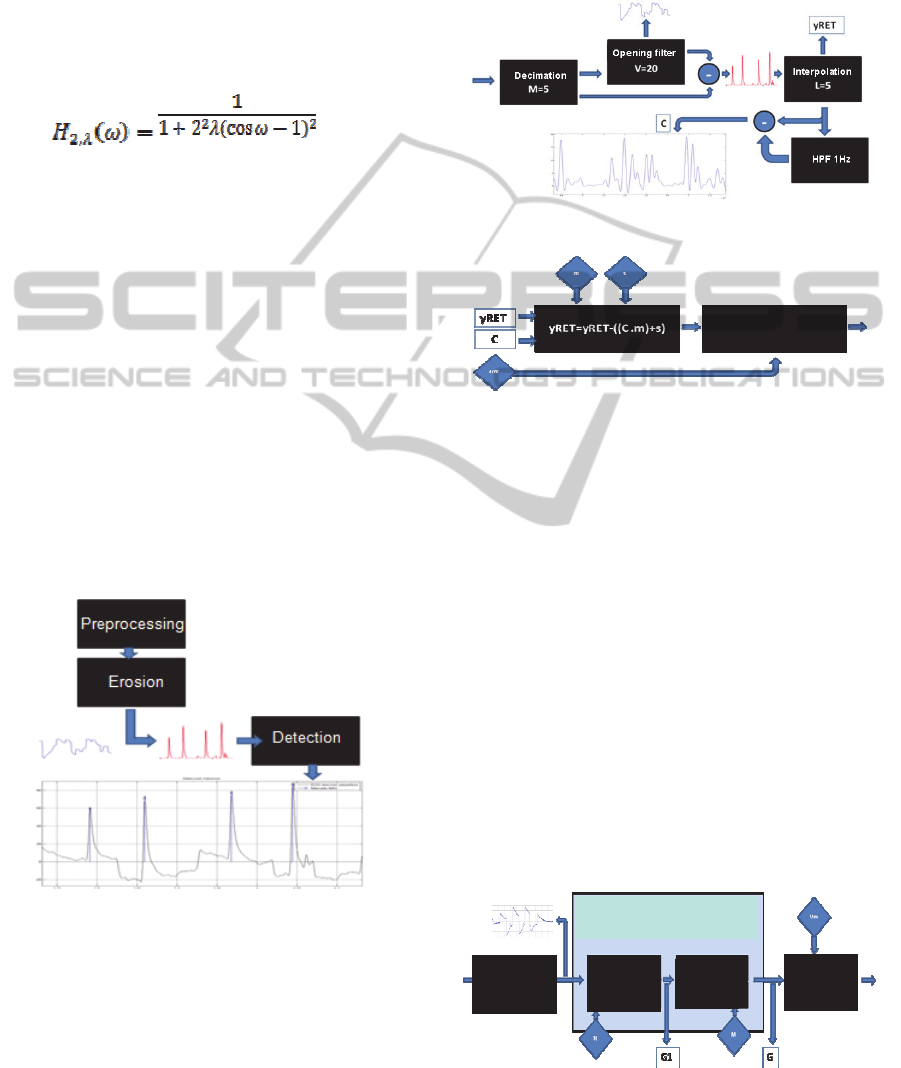
4.1 Preprocessing
A non-linear filter preprocessing of the signal has
been done. The filter used was a non linear filter
derived from the Hodrick-Prescott (1) filter with the
objective of removing repeated oscillations in the
signal. Cutoff frequency at -6dB.
(1)
In secondly a band pass filter has been done. The
high pass filter at 0.1 Hz filtered the baseline
eliminating the electrode polarization effects and the
movement artifacts. The low pass filter at 30Hz
eliminated the Electromyogram (EMG) artifacts of
the signal.
4.2 Processing
As seen in the literature, the most representative
EOG patterns used to estimate the sleep onset are
saccade, blinks and slow eye movements. This
investigation was focused on the analysis of blinking
and saccade patterns as explained below.
4.2.1 Blinking Detectors
The analysis was divided in two blocks (Fig.9):
erosion and detection.
Figure 9: Block diagram of the blinking detection
algorithm.
First the signal passes the erosion block, where
the abrupt swings are eliminated (Fig.10). Then the
filtered signal passes to the blinking detection
module.
The objective of the erosion module is to stand
out the blinking patterns from the rest of artifacts
and saccade oscillations with the interpolation of the
obtained “yRET” signal and its posteriors
calculation of the very low frequency oscillations
obtaining “FPA 1Hz” signal. Finally the “FPA 1Hz”
signal is subtracted from the “yRET” signal to
obtain C signal.
Figure 10: Erosion block.
Peak detection
Figure 11: Detection block.
In the detection block C signal is processed with
the objective of stand out the low frequency
oscillations to avoid remaining artifacts. Finally the
subtraction of yRET signal from C is done and the
detection of peaks with a fixed threshold ‘Um’ gives
the resultant signal with the blinks detected.
4.2.2 Saccade Detectors
The saccade detection algorithm developed analyzes
the horizontal EOG signal with an adaptation of the
known Murty-Rangaraj method based on the
detection of QRS segment in EKG signal (Rangaraj,
2002).
As shown in the picture below (Fig. 12) the
analysis is divided in three blocks: The
preprocessing block explained in E.1, The Murty-
Rangaraj adaptation block and the saccade detection
block.
Figure 12: Block diagram of the saccade detection
algorithm.
Preprocessing
Murty Rangaraj adaptation
Quadratic
Derivate
MA,
M samples
Detection
DrowsinessDetectionbyElectrooculogramSignalAnalysisinDrivingSimulatorConditionsforGoldStandardSignal
Generation
61
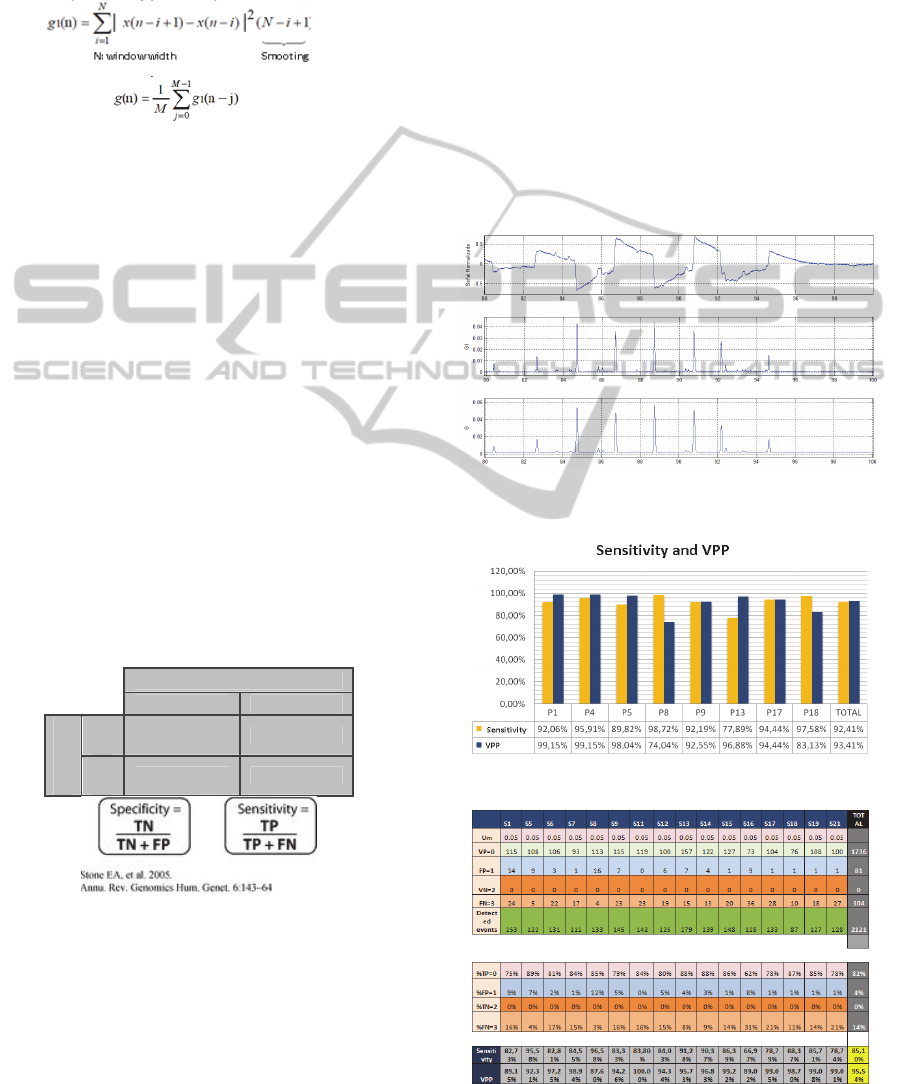
Murthy-Rangaraj method consists in a pre-
filtering of the signal followed by and estimation of
the first weighted quadratic derivate (2). The
resulting signal was later filtered with a moving
average filter (3) in order to smooth the obtained
result.
(2)
(3)
Next step was the maximum and minimum
identification of the signal in order to detect the
position of the saccade using a fixed threshold.
5 STATISTICAL ANALYSIS
For each minute of recording, the phases obtained by
the EOG different drowsiness detection algorithms
were compared the GS signal, in this case a
combination of three external observers evaluating
minute by minute the state of the subject using a
video recording of the tests. To estimate the
sensitivity and specificity of the different EOG
methods a match signal was calculated having the
number of false positives, false negatives, true
positives and true negatives.
According to Table 1 (Stone EA, 2005),
sensitivity (Sens) and specificity (Spec) for each
phase is defined as:
Table 1: Sensitivity and Specificity definition.
Gold Standard
PHASE 0 PHASE 2
EOG index
PH0
TN FN
PH2
FP TP
being the Sensitivity the proportion of actual
positives which are correctly identified as such
giving information about how good is the detection
algorithm, and the Specificity the proportion of
negatives which are correctly identified.
6 RESULTS
The results for the analysis of the EOG signal with
de blinking detection algorithm shows positive
results with a sensitivity of 92,41% and a VPP of
93,41% (Figure 14) comparing the results of the
algorithms with the Gold Standard. The results with
the saccade detection algorithms shows also good
results but, in this case, it has to be improved with a
module that allows the detection of the beginning
and the final of the saccade pattern in order to
improve the pattern detection, yet the results are
very promising for drowsiness detection porpoises
with sensitivity values of 85,1% and VPP values of
95,4% (Figure 15).
Figure 13: Example of the saccade detection in horizontal
EOG.
Figure 14: Blinking detection algorithm results.
Figure 15: Saccade detection algorithm results.
BIODEVICES2013-InternationalConferenceonBiomedicalElectronicsandDevices
62

7 CONCLUSIONS
The results confirmed the viability of the sleep onset
detection using related to drowsiness patterns in the
EOG signal as blinking frequency and saccade
movements’ appearance. Some misdetection of the
algorithms may be due to the inter-subject variability
mostly regarding the shape of the saccade pattern.
Future work will be focused in the improvement
of the saccade detection algorithm by including the
detection of initiation and end of the saccade pattern
in order to make more specific the detection and
accurate the calculation of the variable velocity of
the saccade.
The future objective is to use the EOG signal as
Gold Standard in vehicle tests replacing the EEG
signal that shows low quality signal in real
environments.
ACKNOWLEDGEMENTS
This work has been partially funded by the Spanish
MINISTERIO DE CIENCIA E INNOVACIÓN.
Proyecto IPT-2011-0833-900000.Healthy Life style
and Drowsiness Prevention-HEALING DROP.
REFERENCES
P. Meca Calderón, (Jun 2011). “Estudio de la viabilidad de
la señal de EOG como indicador de somnolencia”.
PFE. Master Oficial en Enginyeria Biomèdica.
Department of Electronic Engineering of the
Technical University of Catalonia (UPC)
NHTSA VSR, (2006) "Chapter 3: objective 2, what are
the environmental conditions associated with driver
choice of engagement in secondary tasks or driving
while drowsy?
Faber, J., (2004) “Detection of different levels of vigilance
by EEG pseudospectra”, Neural Network World vol.
14, no. 3-4, pp. 285–290.
Rodríguez-Ibáñez N., García-González M. A., Fernández-
Chimeno M., Ramos-Castro J., (2011). “Drowsiness
detection by thoracic effort signal analysis in real
driving environments” Conf Proc IEEE Eng Med Biol
Soc., 2011:6055-8.
Timothy Roehrs, Ph.D., and Thomas Roth, Ph.D., (Feb 25,
2011). "Sleep, Sleepiness, and Alcohol Use". National
Institute on Alcohol Abuse and Alcoholism of the
National Institutes of Health”
Dinges D. F., Mallis M. M., Maislin G., Powell J. W.,
(2005) Evaluation of techniques for ocular
measurement as an index of fatigue and the basis for
alertness management.
Rechtschaffen A., Kales A., (1968). A manual of
standardized terminology, technique and scoring
system for sleep stages of human subjects los Angeles:
Brain information services/Brain research institute,
UCLA; 1-12.
Galley, N., (1989). Saccadic eye movement velocity as an
indicator of (de)activation. A review and some
speculations. Journal of Psychophysiology, 3, 229-
244.
Galley, N. (1993). The evaluation of the electrooculogram
as a psychophysiological measuring instrument in the
driver study of driver behaviour. Ergonomics, 36,
1063-1070.
Galley, N., (1998). An enquiry into the relationship
between activation and performance using saccadic
eye movement parameters. Ergonomics, 40, 698-720.
Rangaraj R., (2002) ‘Biomedical Signal Analysis, A Case
Study approach’, IEEE Press Series in Biomedical
Engineering.
Salthouse and Cl Ellis, (1980), Determinants of eye-
fixation duration. Am J Psychol. Jun;93(2):207-34.
Sirevaag, E. J. & Stern, J. A., (2000). Ocular measures of
fatigue and cognitive factors. In R. W. Backs & W.
Boucsein (Eds.), Engineering Psychophysiology (pp.
269-288). Mahwah, NJ: Lawrence Erlbaum
Associates.
Stone E. A, Cooper G. M., Sidow A., 2005.Trade-offs in
detecting evolutionarily constrained sequence by
comparative genomics. Annu. Rev. Genomics Hum.
Genet. 6:143–64.
Vernet et all. (2011) Guiding Binocular Saccades during
Reading: A TMS Study of the PPC, Front Hum
Neurosci. 2011; 5: 14. Published online 2011 February
7. doi: 10.3389/fnhum. 2011.00014.
Viviani P., (1990). Eye movements in visual search:
Cognitive, perceptual and motor control aspects, in
Eye movements and their role in visual and cognitive
processes. Kowler E. Editor. Elsevier Science,
Amsterdam. p. 353-394.
DrowsinessDetectionbyElectrooculogramSignalAnalysisinDrivingSimulatorConditionsforGoldStandardSignal
Generation
63
