
Inspired Sinewave Technique to Non-invasive Lung Function Testing
An Introduction and Update of Recent Developments
Phi Anh Phan
1
, Sara Ffrench-constant
2
, Andrew Farmery
1
and Clive E. W. Hahn
1
1
Nuffield Division of Anaesthetics, University of Oxford, level 6 West Wing, John Radcliffe Hospital,
OX 3 9DU, Oxford, U.K.
2
Somerville College, University of Oxford, OX2 6HD, Oxford, U.K.
Keywords: Inspired Sinewave Technique, Non-invasive Lung Function Test, Medical Device.
Abstract: Inspired Sinewave is a novel technique to measure dead space, alveolar volume, and pulmonary blood flow
noninvasively. In this paper, we describe a brief introduction to the principle of the technique, which
involves forcing inspired concentrations to oscillate sinusoidally and measuring responding expired
concentrations. Then, we give some updates to the recent developments of the device. These include
accuracy and robustness studies of the device on bench lungs and volunteers, and study of lung volume
change from sitting to supine. The success of these studies is a big step forward to make this novel device a
useful clinical tool. The paper concludes with a description of future work.
1 INTRODUCTION
Lung function testing is essential to the diagnosis of
how the lung works in health and disease. Even
though the use of spirometry with simple volume
and flow measurements remains the cornerstone,
respiratory function testing has now advanced to
involve sophisticated analyses of volume, flow,
airway pressure and expired breath (King, 2011).
Predominantly in the research domain, these
techniques include forced oscillation technique,
multiple breath nitrogen washout, optical coherence
tomography, surface tomography methods (King,
2011), and inspired sinewave technique, etc. These
new techniques will likely improve the
understanding of airways disease and benefit the
development of new treatments.
The inspired sinewave is such a technique,
aiming at providing measurements of dead space,
alveolar volume, pulmonary blood flow, and lung
inhomogeneity simultaneously, non-invasively, and
without patients’ cooperation. By forcing the
inspired concentrations of O
2
and N
2
O to oscillate
sinusoidally with very low amplitudes (3-5%) and
low mean for N
2
O (3%), lung parameters can be
estimated from the responding amplitudes and
phases of the expired concentrations. The larger the
lung parameters, the greater are the attenuations of
the expired oscillations.
Historically, the technique was originated from
Zwart’s idea of using forced inspired sinusoids of
halothane and acetylene in the 1970s, to measure the
average ventilation-to-blood flow ratio
PA
QV
/
and the pulmonary blood flow
P
Q
(Zwart et al.,
1976); (Aart Zwart et al., 1978).
Hahn and collegues extended this idea to the use
of more patient safe gases such as O
2
and low
concentration of N
2
O (3% mean) (Hahn et al.,
1993); (Hahn, 1996). They also extended the simple
continuous lung model used by Zwart to more
complicated models, including dead space, multiple
compartments, and tidal ventilation, which allow
estimations of dead space, alveolar volume, blood
flow and inhomogeneity simultaneously from the
experimental sinewave data (Gavaghan & C. E. W.
Hahn 1996; Whiteley et al. 2000).
Preliminary clinical studies with both animals
(Williams et al., 1994); (Williams et al., 1996);
(Williams et al., 1998) and healthy volunteers
(Williams et al., 1997) showed close argeements
between the inspired sinewave technique and other
techniques including single breath CO
2
for
measuring dead space, whole-body plethysmography
and multiple N
2
washout for measuring alveolar
volume, and thermal dilution for measuring
plumonary blood flow. These studies verified the
potential benefits of the inspired sinewave technique
148
Phan P., Ffrench-constant S., Farmery A. and E. W. Hahn C..
Inspired Sinewave Technique to Non-invasive Lung Function Testing - An Introduction and Update of Recent Developments.
DOI: 10.5220/0004241601480152
In Proceedings of the International Conference on Biomedical Electronics and Devices (BIODEVICES-2013), pages 148-152
ISBN: 978-989-8565-34-1
Copyright
c
2013 SCITEPRESS (Science and Technology Publications, Lda.)
200 250 300 350 400 450 500
20
22
24
26
28
30
32
34
36
38
Time (sec )
Gas Con centrati o n ( % )
286 287 288 289 290 291 292 293 294
28
30
32
34
36
38
Time (sec)
Gas Concentration (%)
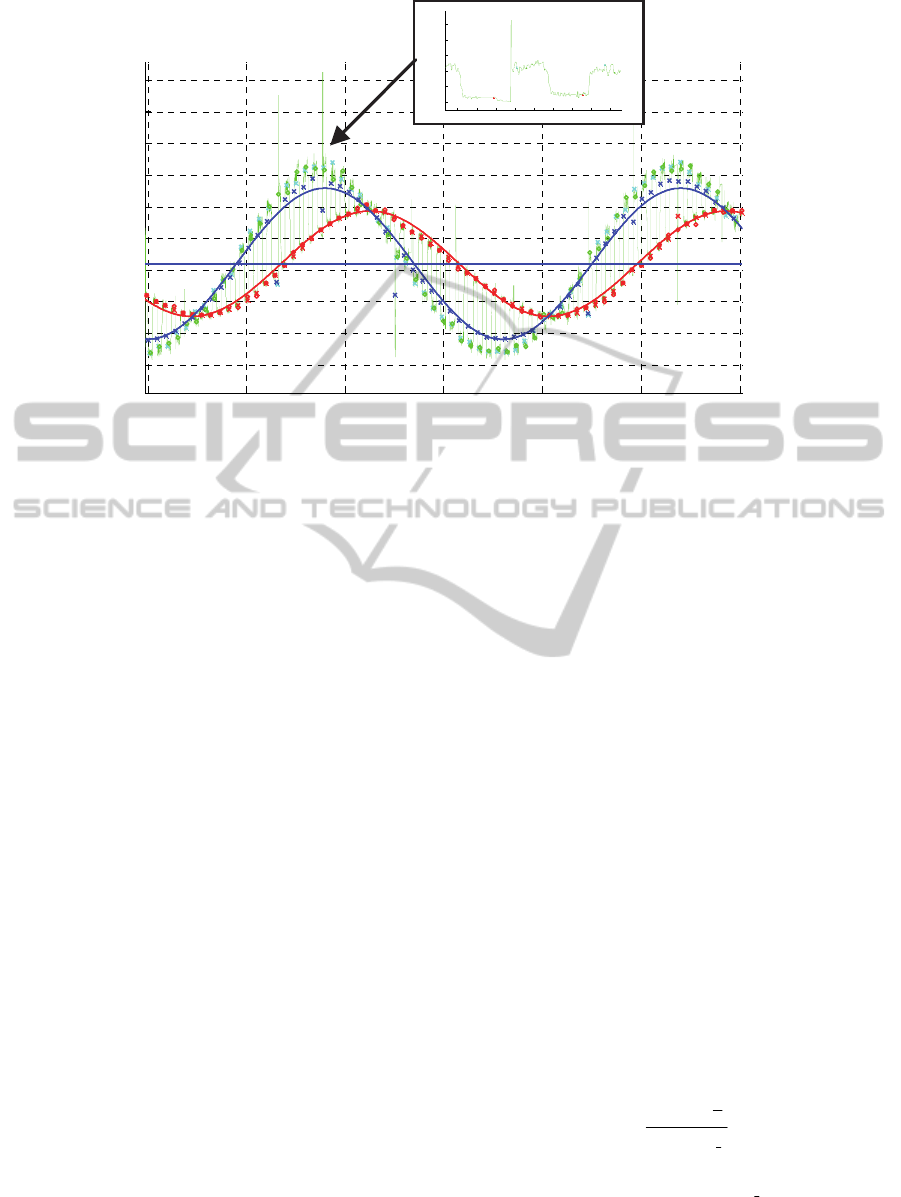
Figure 1: An example of O
2
concentration signal collected in an inspired sinewave lung function test. Green line is the
measured O
2
signal. Blue marker and line are the mixed inspired concentration and sinewave. Red marker and line are the
end-expired concentration and sinewave. The more attenuated the end-expired concentration, the greater the dead space,
lung volume, or pulmonary blood flow.
to noninvasively and simultanesously measure lung
function.
The early protype of the device, with which the
above studies were carried out, included a pre-
mixing gas delivery system and a mass spectrometer
for gas analysis. This hardware was cubersome and
hindered the progress of making the device a useful
clinical tool by the bedside and in the intensive care
environment.
A large effort has been made in the past ten years
was to find suitable technoligies and designs to
miniaturise the hardware components. This was not
entirely successful until recently when
manufacturers started making mass flow controllers
and infrared sensors that were small, accurate, and
fast enough for our purpose. These technologies
have been adapted into the our later prototype, and
futher enhanced from manufacturing settings by our
custom software algorithms (Farmery and Hahn,
2000); (Farmery and Hahn, 2001). This is the
foundation of our current prototype apparatus, which
will be described in the next section.
2 METHOD
2.1 Theory
Fig 1 shows an example of O
2
signal in an inspired
sinewave test. The signal jumps from 1 sinewave to
another between inspirations and expirations as
displayed by the red and green lines. Many lung
models can be used to estimate dead space, alveolar
volume and pulmonary blood flow from this signal.
The simplest one is the continuous lung model, more
complicated ones include the tidal one-compartment
model and the tidal multiple-compartment model.
The more complicated the model, the greater the
accuracy and insight can be retrieved. However, the
computational complexity also increased. In this
introduction paper, we will present the simplest
continuous model. Interested readers can refer to
(Gavaghan and Hahn, 1996); (Whiteley et al., 2000)
for more complicated models.
In the continuous model, the lung is considered
similar to the fish gills, in which air flows
continuously through a chamber where gases
exchange with blood occurs, as shown in Fig 2. The
dead space ventilation
D
V
is estimated as:
rrVV
DD
(1)
where
r
r
is the breathing rate per minute, and the
dead space
D
V is estimated by the Bohr method:
I
E
E
E
TD
FF
FF
VV
(2)
where
T
V is the tidal volume,
I
F
is the mixed
inspired concentration,
E
F is the end expired
InspiredSinewaveTechniquetoNon-invasiveLungFunctionTesting-AnIntroductionandUpdateofRecent
Developments
149

concentration,
E
F
is the mixed expired
concentration.
Figure 2: The continuous lung model. The inspired
ventilation is branched into two parts: the alveolar
ventilation
A
V
which goes through an alveolar chamber,
and the dead space ventilation
D
V
which bypass the
alveolar chamber.
The alveolar ventilation is estimated as:
rrVVV
DTA
(3)
The mass balance equation for O
2
is:
dt
tdF
VVtFVtFV
A
AOAAIA
2
(4)
where
A
V : is the alveolar volume,
0,
2
sin
III
Ft
T
FtF
: is the inspired
sinusoidal concentration, with
T
the period,
0,I
F
the
mean inspired.
2
O
V
: the oxygen consumption rate,
tF
A
: the alveolar concentration,
tF
E
the end
expired concentration. At steady state,
0,
2
sin
AAA
Ft
T
FtF
, with
the
phase difference between the inspired and expired
sinewaves,
0,A
F
the mean alveolar
It has been shown from the oxygen-haemoglobin
association curve that at high partial pressure of
oxygen in the blood pO
2,
oxygen saturation sO
2
is
approximately unchanged (Williams et al., 1997).
The oxygen consumption rate
2
O
V
is therefore
approximately constant when a sinusoidal inspired
O
2
concentration is applied. The steady-state
solution of
tF
A
in (4) is:
0,
2
2
2
sin
2
1
A
A
A
I
A
Ft
T
V
V
T
F
tF
N
2
O MFC
O
2
MFC
LabVIEW
Data Acquisition
Matlab Analysis
LabVIEW
Controller
Ventilator
%N
2
O
%O
2
Flow
Dead space
Lung volume
Blood flow
Gases Delivery
Bench
Lung
FS
G
A
Figure 3: Layout of the Inspired Sinewave Device. The
gases delivery system employs mass flow controllers
(MFCs) to inject O
2
and N
2
O into the breathing circuit.
Real-time data is read by the flow sensor (FS) and the
mainstream gas analyzer (GA) and fed to LabVIEW and
Matlab for estimation of dead space, lung volume and
pulmonary blood flow.
Table 1: Experiment 1 – Robustness of dead space
estimation.
Setup 1 Setup 2 Setup 3
Deadspace
108ml 208ml 258ml
Alveolar Volume
2.6L 2.6L 2.6L
(a) Actual bench lung parameters
Setup 1 Setup 2 Setup 3
Deadspace
110 ± 10ml 206 ± 8ml 260 ± 8ml
Alveolar Volume
2.71 ± 0.14L 2.72 ± 0.14L 2.48 ± 0.16L
(b) Estimations using the proposed method
Estimations of dead spaces and alveolar volumes of 3 different
bench lung setups. Values are mean ± 95% confidence.
Therefore,
2
2
2
1
A
A
I
A
V
V
T
F
F
(5)
1
2
2
A
IA
A
F
FVT
V
Thus, the alveolar volume can be estimated from the
ratio of the magnitudes of the inspired and expired
sinewaves.
For N
2
O, the formula is slightly more
complicated and is given in (Williams et al., 1994).
In this case, we have:
2/1
2
2
2
2
1
1
A
A
A
p
I
E
V
V
T
V
Q
F
F
(6)
BIODEVICES2013-InternationalConferenceonBiomedicalElectronicsandDevices
150

where
is the blood gas solubility of N
2
O,
p
Q
is
the pulmonary blood flow. Knowing (6) at 2
different periods, we can estimate
A
V
and
p
Q
.
2.2 Hardware
The layout of the device is described in Fig 3. By
reading the inspiration flow rate in real time, the
software can decide the set-points for the mass flow
controllers to inject the desired amount of O2 and
N2O. The integrations of concentrations and flow
signal give the inspired volume and expired volume
of O2 and N2O breath-by-breath. These inspired
volumes and end-expired concentration are then fed
into a mathematical model of the lung in Matlab to
estimate dead space, lung volume, and blood flow.
The gas sensors have accuracy of 2% of reading
and step response time of less than 350ms and 5ms
time delay. The flow sensor is fast with updating
rate of 50Hz and accuracy of 3%.
2.3 Potential Benefits
The 3 main features of IST are as follows.
2.3.1 Measure Simultaneously Dead Space,
Alveolar Volume, and Pulmonary
Blood Flow
From the theory above, it can be seen that dead
space, alveolar volume, and pulmonary blood flow
can be estimated simultaneously from eq (2), (5),
and (6).
It should be noted that the parameters are
estimated independently from O2 and N2O signals
(except pulmonary blood flow). The estimations are
therefore combined to give better accuracy and
robustness.
Table 2: Experiment 2– Robustness of lung volume
estimation.
Setup 4 Setup 5 Setup 6
Deadspace 208ml 208ml 208ml
Alveolar
Volume
1.8L 2.2L 2.6L
(a) Actual bench lung parameters
Setup 4 Setup 5 Setup 6
Deadspace 210 ± 14ml 202 ± 10ml 206 ± 8ml
Alveolar
Volume
1.86 ± 0.18L 2.17 ± 0.15L 2.72 ± 0.14L
(b) Estimations using the proposed method
Estimations of dead spaces and alveolar volumes for varying lung
volume setups. Values are mean ± 95% confidence.
2.3.2 Does Not Require Patients’
Cooperation
The
use of mass flow controllers allows any desired
inspired O
2
and N
2
O concentrations regardless of the
inspired flow rate. The estimations can be estimated
regardless of any breath length and pattern. This is
particularly advantageous with injured or
unconscious patients who are impossible to test by
spirometry and body plethysmography. Small
children and babies are also benefit from this
feature.
2.3.3 Indicates Lung Inhomogeneity
It has also been shown that the level of dependency
of estimated alveolar volume and pulmonary blood
flow on the inspired oscillation periods reflects the
inhomogeneities of both ventilation–volume and
ventilation–perfusion (Whiteley et al., 2000).
3 RESULTS
With this current prototype, we have started carrying
out experiments to verify the device. Initial results
include accuracy and repeatability test on a bench
lung, and initial human volunteer studies.
3.1 Accuracy and Repeatability
To test the device, we have used a bench lung that
can be set at different dead space and alveolar
volume configurations. Tables 1 and 2 show results
estimated by the device compared to the actual set
ups of the bench lung. It has been confirmed that the
errors are less than 10% for both dead space and
alveolar volume estimations.
3.2 Initial Volunteer Study
We have also started testing the device on human
subjects. One study is to estimate functional residual
capacity of healthy simultaneously-breathing
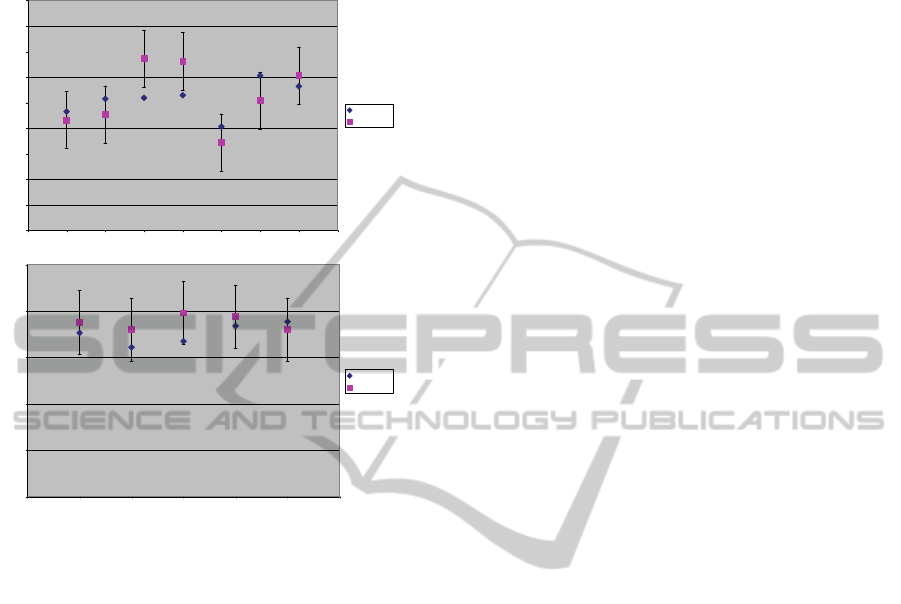
subjects. Fig 4 demonstrates the results for 7 males
and 5 females, showing good agreements with
predictions by equations in (Ibañez and Raurich,
1982). Currently, we are carrying out more human
studies in the lung function lab at the Churchill
hospital – Oxford. These studies include
comparisons for FRC between sitting and supine
posititions, and between estimations of the device
and the body plethysmography. Initial results show
good correlations between the estimations by the
InspiredSinewaveTechniquetoNon-invasiveLungFunctionTesting-AnIntroductionandUpdateofRecent
Developments
151
device and other methods, verifying the potential of
the device to measure lung function parameters
noninvasively.
0
0.5
1
1.5
2
2.5
3
3.5
4
4.5
012345678
(a) Male Volunteer
Lung Volume
Measured
Expected
0
0.5
1
1.5
2
2.5
0123456
(
b
)
Female Volunteer
Lung Volume
Measured
Expected
Figure 4: Functional residual capacity estimated by the
device for healthy simultaneously-breathing subjects.
4 FUTURE RESEARCH
We will continue to carry more studies of the device
in the clinical environment such as besides the
bedside and in the intensive care unit. We are
currently obtaining ethnic approval to test the device
on diseased patients. Patients who come in the lung
function for pulmonary test will be asked to
volunteer 30 mins to be tested by our device. The
test results will then be compared to other tests such
as body plethysmography, spirometry, and impulse
oscillometry (which are already gathered through the
patients’ normal test procedure). We hope to gather
more evidence of the effectiveness of the device
through this study.
We will further refine the design and miniaturize
the device, making it more suitable for the clinical
environment. In particular, we aim to make the
device weighted less than 30kg, mounted on a 40cm
x 30 cm x 100cm trolley which can be moved easily
around the crowded intensive care environment.
Our goal is to complete an advanced prototype,
which is readily marketable to medical device
manufacturers by 2014.
REFERENCES
Farmery, A. D. & Hahn, C. E. W., 2001. A method of
reconstruction of clinical gas-analyzer signals
corrupted by positive-pressure ventilation. Journal of
Applied Physiology, 90(4), pp.1282–1290.
Farmery, A. D. & Hahn, C. E. W., 2000. Response-time
enhancement of a clinical gas analyzer facilitates
measurement of breath-by-breath gas exchange.
Journal of Applied Physiology, 89(2), pp.581–589.
Gavaghan, D. J. & Hahn, C. E. W., 1996. A tidal breathing
model of the forced inspired inert gas sinewave
technique. Respiration Physiology, 106(2), pp.209–
221.
Hahn, C. E. et al., 1993. Gas exchange in a three-
compartment lung model analyzed by forcing
sinusoids of N2O. Journal of Applied Physiology,
75(4), pp.1863–1876.
Hahn, C. E., 1996. Oxygen respiratory gas analysis by
sine-wave measurement: a theoretical model. Journal
of Applied Physiology, 81(2), pp.985–997.
Ibañez, J. & Raurich, J. M., 1982. Normal values of
functional residual capacity in the sitting and supine
positions. Intensive Care Medicine, 8(4), pp.173–177.
King, G. G., 2011. Cutting edge technologies in
respiratory research: Lung function testing.
Respirology, 16(6), pp.883–890.
Whiteley, J. P., Gavaghan, D. J. & Hahn, C. E. W., 2000.
A tidal breathing model of the inert gas sinewave
technique for inhomogeneous lungs. Respiration
Physiology, 124(1), pp.65–83.
Williams, E. M. et al., 1997. Alveolar and Dead Space
Volume Measured by Oscillations of Inspired Oxygen
in Awake Adults. Am. J. Respir. Crit. Care Med.,
156(6), pp.1834–1839.
Williams, E. M. et al., 1994. Assessment of
cardiorespiratory function using oscillating inert gas
forcing signals. Journal of Applied Physiology, 76(5),
pp.2130–2139.
Williams, E. M. et al., 1996. Measurement of respiratory
parameters by using inspired oxygen sinusoidal
forcing signals. Journal of Applied Physiology, 81(2),
pp.998–1006.
Williams, E. M. et al., 1998. Pulmonary blood flow
measured by inspiratory inert gas concentration
forcing oscillations. Respiration Physiology, 113(1),
pp.47–56.
Zwart, A., Seagrave, R. C. & Dieren, A. V., 1976.
Ventilation-perfusion ratio obtained by a noninvasive
frequency response technique. Journal of Applied
Physiology, 41(3), pp.419–424.
Zwart, Aart et al., 1978. A non-invasive determination of
lung perfusion compared with the direct Fick method.
Pflügers Archiv European Journal of Physiology,
375(2), pp.213–217.
BIODEVICES2013-InternationalConferenceonBiomedicalElectronicsandDevices
152
