
Snoring Analysis on Full Night Recordings based in the Energy
and Entropy in PSG Basal Studies
Tiago Marc¸al
1
, Jos´e Bas´ılio Sim˜oes
1
, Jos´e Moutinho dos Santos
2
, Agostinho Rosa
3
and Jo˜ao Cardoso
1
1
Instrumentation Centre, University of Coimbra, Physics Department 3004-516, Coimbra, Portugal
2
Centro de Medicina do Sono, Centro Hospitalar e Universit´ario de Coimbra, Coimbra, Portugal
3
LaSEEB, Technical University of Lisbon, Lisbon, Portugal
Keywords:
Snoring, Shannon’s Entropy, Pulse Energy, Sleep, Sleep Disorders, Obstructive Sleep Apnea Syndrome,
Acoustic Analysis.
Abstract:
Snoring is a widely occurring problem in our society and it is highly associated with pathologies like Ob-
structive Sleep Apnea Syndrome (OSAS) being, usually, one of the first symptoms to appear. Economically,
OSAS has a great impact since sleep disorders affect the daily performance of people in their professional
activities. The extensive study of snoring evidences may be useful to improve the knowledge of associated
pathologies, such as OSAS or others, at an early state. In this work, we study full night sound recordings
of patients undergoing polysomnography (PSG) procedures. Recordings are offline processed to characterize
time series of snoring events through the record length and correlated with the PSG data. The main goal of the
proposed algorithms is to understand the behaviour of the full night sound recording and to identify snoring
event patterns that may help and refine the diagnostics process. To achieve this goal, the relationship between
the energy and the entropy was studied, for each respiratory event, in both snoring and non-snoring cases.
Recordings are offline processed to characterize time series of snoring events through the record length and
correlated with the PSG data. In the future, the relationship between these two physical variables can be used
to predict the clinical evolution between a simple snorer patient and a patient with OSAS.
1 INTRODUCTION
Sleeping is a natural process in the life of a human
being and its importance is well known in several pro-
cesses of the human biology, such as memory consol-
idation, blood pressure regulation, learning motor se-
quence and normal immune function (Barkoukis and
Avidan, 2007)(Shneerson, 2005). This process is dy-
namic and throughout the life, sleep patterns change
in a natural way (Shneerson, 2005).
However, there are some changes in sleep patterns
induced by either pathological factors or drugs. Sleep
disorders are a common problem in our society af-
fecting both men and women, especially elderly, as
well as children (Pevernagie et al., 2010) (Spicuzza
et al., 2009) (Grunstein et al., 2001) (Ye et al., 2009)
(Launois et al., 2007). One of such disorders is the
Sleep Apnea Syndrome (SAS). SAS has a high impact
in the quality of life and in the world economy (Leger
et al., 2012) (Wittmann and Rodenstein, 2004). SAS
can be obstructive (OSAS), central (CSAS) or both.
OSAS is much more common than CSAS and it is
highly linked with snoring.
Snoring is the result of the mechanical vibration
of the anatomical structures of the upper airway and
usually precedes almost all the others OSAS symp-
toms (Banno and Kryger,2007). It is a complexsignal
since it changes between different people and it may
change throughout the same night in the same per-
son. Factors like route of breathing, site of narrowing,
sleep stage and sleep position contribute to changes in
the features of snoring (Pevernagie et al., 2010). Ac-
cording to (Beck et al., 1995) there are 2 basic dom-
inant patterns in snoring: the simple-waveform and
the complex-waveform. The second one is character-
ized by ”a repetitive, equally-spaced, train of sound
structures, each composed of a few oscillations, start-
ing with a large deflection which is followed by a
decaying amplitude wave.”. The first one is char-
acterized as follows: ”In the time domain, simple-
waveform snores have a quasi-sinusoidal pattern and
almost no secondary internal oscillations within the
periodic wave.”.
Since snoring is highly linked to OSAS, our work
221
Marçal T., Basílio Simões J., Moutinho dos Santos J., Rosa A. and Cardoso J..
Snoring Analysis on Full Night Recordings based in the Energy and Entropy in PSG Basal Studies.
DOI: 10.5220/0004245202210227
In Proceedings of the International Conference on Bio-inspired Systems and Signal Processing (BIOSIGNALS-2013), pages 221-227
ISBN: 978-989-8565-36-5
Copyright
c
2013 SCITEPRESS (Science and Technology Publications, Lda.)

focuses its goal in the study of this condition. Previ-
ous works demonstrated differences in acoustic prop-
erties between simple snorers patients and patients
with OSAS in the sound power spectrum (Fiz et al.,
1996). The first step is the determination of the en-
ergy of a full night sound recording in patients with
polysomnographic basal studies, splitting the sound
recordings in small segments of settable length (be-
tween 0.01s and 1s). The second step is the determi-
nation of the entropy for every respiratory event, with
or without a snoring signal. Entropy is a measure of
the disorder of a system. In information theory, the
concept of entropywas first explored by Claude Shan-
non and it measures the uncertainty associated with
a random variable (Yadollahi and Moussavi, 2006)
(Zhang et al., 2009).
In the end, a relationship between the energy and
the entropy of all the respiratory events detected by
the algorithm was established.
2 METHODS
2.1 Data Acquisition
Full night sound recordings took place at the Centro
de Medicina do Sono of the Centro Hospitalar e Uni-
versit´ario de Coimbra with clinical supervision of MD
J. Moutinho dos Santos and the collaboration of his
clinical team.
Prior to each data acquisition, the patient is given
an informed consent. To the development of this
work 36 patients agreed to participate (22 men and
14 women). The arithmetic mean of their ages was
50.83 years with a standard deviation of 12.66 years.
Sound acquisitions are performed with a commer-
cial recording device in order to bypass developing
times and because such instruments provide the best
sound quality and noise immunity while still being
portable (Zoom, 2012). The instrument has 2 inde-
pendent channels with near-Lambertian spatial sen-
sitivity (directional microphones) which significantly
reduces ambient sounds and other stray noises present
on the exam location. The recordings are stored on an
SD card and afterwards downloaded to a processing
workstation for analysis.
Each full night recording stores an uncompressed
16 bit single channel with at 44.1KHz sampling rate.
Due to the used acquisition configuration, there is an
upper limit of 6h45m to the record length of a data
taking session. This is indeed compatible with the
PSG protocol and doesn’t represent a limitation to
data availability.
The use of a non-contact microphone may add
some challenges to this work since the source and the
destination of the sound do not have the same relative
position and distance throughout the night. In fact,
there are some works pointing their goals to this issue.
One of such works was developed by (Herzog et al.,
2009). Its investigation team used 4 non-contact mi-
crophones and 2 contact microphones. Non-contact
microphones were at different distances and at dif-
ferent relative positions from the source. The results
show an independence relationship between intensity
(% of maximum intensity) and the position of the non-
contact microphones since the intensity profile is al-
most the same throughout all the studied frequencies
for all the non-contact microphones. Although there
is a suggestion that the recording took place with the
patient in the supine position there isn’t a clear evi-
dence if the sleeping position was controlled. If not,
the results can be biased, because different sleeping
positions mean different distances between the source
of the sound and the microphones. Another conse-
quence of studying different sleeping positions is the
sound reflection on the wall of the room, different for
each one.
Since this research work only used one acquisition
device, the best place to acquire sound was just above
the head of the patient. This choice should minimize
sound losses due to the different sleeping positions
adopted throughout the night. The sound acquisition
support was placed behind and above the bed to keep
the vertical distance, around 0.7m, between the bed
and the microphone. This support has 3 degrees of
freedom to allow a correct orientation of the acquisi-
tion device to the sound source. An infrared is used
to check the orientation (Figure 1).
2.2 Data Processing
To develop this work it was used a high-level pro-
gramming language, MATLAB, working in a com-
puter with the following features: Operating System:
Windows 7 (64 bits), Central Processing Unit: i7-
3610QM 2.3GHz, RAM: 6GB.
Energy calculation was the first step in sound pro-
cessing. In this study, the full night sound recording
was split in smaller pieces of data with length of 0.1s.
Since the frequency acquisition was 44100Hz, each
energy calculation contained 4410 sound samples. To
calculate the energy of each set of 4410 sound sam-
ples, the mathematical equation implemented in the
algorithm was:
E(x) =
N
∑
i=1
x
2
i
(1)
BIOSIGNALS2013-InternationalConferenceonBio-inspiredSystemsandSignalProcessing
222
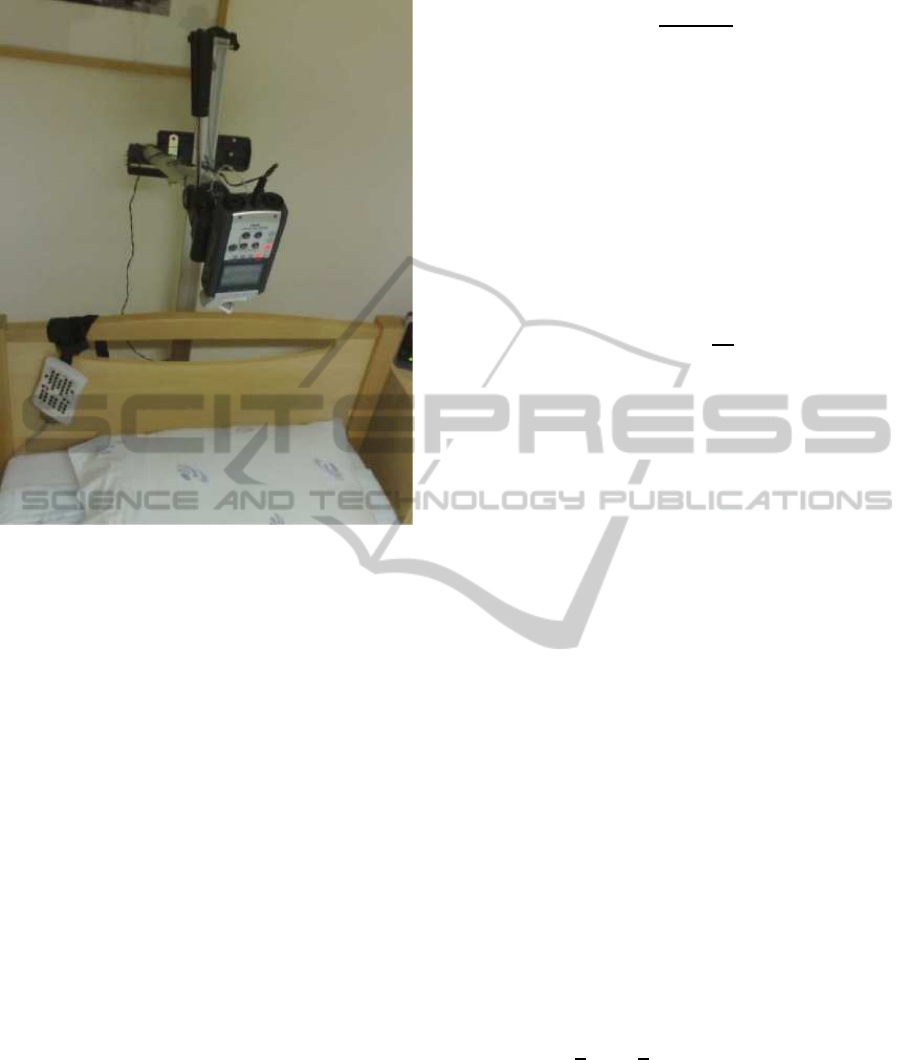
Figure 1: Data acquisition setup.
The variable x
i
represents the amplitude of the i
th
sound sample. The energy distribution, stored in an
array with a length of one tenth of the length of the
original data sound file, was filtered. The filtering
process started with a convolution between the energy
array and the [1 0 -1] array. The result of this high-
pass filtering was an array with elements in R. To
avoid working with negative values the absolute val-
ues were taken and then a moving average filtering
was applied. Each energy element was average by its
10 nearest neighbors to remove low amplitude peaks.
With the purpose of detecting each respiratory
event, a Gaussian fit was applied to the filtered data.
To perform the Gaussian fit, a 4 second sliding win-
dow with a time step of 0.5 seconds was chosen to try
to get one respiratory event each time. On the other
hand, a smaller window could be ineffective to res-
piratory events detection. The Gaussian fit does not
start at the beginning of the array but only 10 minutes
after the sound recording starts and it goes until the
end of the filtered energy array. The 10 minutes de-
lay was implemented to ignore the first minutes where
the patient was still awake. It was usual the patient
awakes in the middle of the study and, therefore, all
the results inside these time periods must be consid-
ered as interference. During the Gaussian fit process,
the algorithm calculates the center of mass, R, of the
current window to know where the respiratory event
is most likely to be:
R =
∑
k
i=1
m
i
r
i
M
(2)
M =
k
∑
i=1
m
i
(3)
In (2) and (3) m
i
and r
i
represents, respectively,
the i
th
element of the energy filtered subset and of the
time subset. Since the sliding window has a duration
of 4 seconds and each energy value represents 0.1s
then R is calculated for 40 points, k, each time.
The Gaussian function template to the fit process
had one variable, x, and 3 parameters to be calculated,
a, b and c. The algorithm used the following Gaussian
function, F(x):
F(x) = a.e
−(
x−b
c
)
2
(4)
When the fitting process is finished, the algorithm
calculates the maximum of the Gaussian function,
(4). Throughout the window sliding process, the al-
gorithm tried to find each respiratory event and store
it.
With the respiratory events detected, the final al-
gorithm step was to find the entropy of each one in
the sound file. In information theory, a very common
formula is given by the Shannon’s Entropy, H(x):
H(x) = −
l
∑
i=1
p(x
i
)log
d
p(x
i
) (5)
If a probability of an event was 0, p(x
i
) = 0, then
the entropy of such event was 0:
0.log
d
0 = 0 (6)
Every time the sound recording device made an
acquisition, such data was stored in a signed variable
of 16 bits. The sample space, Ω, in a variable of
16 bits is a set of 65536 possible outcomes, l, each
one representing an elementary event, x
i
. To know
the probability of each event, a data acquisition pro-
file was calculated, for each sound file, to know how
many times each event occurred. The calculation of
the Shannon’s Entropy was performed for the neigh-
borhood of each respiratory event. The length of the
neighborhood was T = 3.1s. For a neighborhood of
length T and a respiratory event at time t, then the
Shannon’s Entropy would be calculated with samples
between
t −
T
2
t +
T
2
. Finally, the Shannon’s En-
tropy was calculated with a logarithm of base 2. The
maximum energy value, E
m
, around each detected
respiratory event with time t was determined using a
time span of 1s [t − 0.5 t + 0.5]. In the end, the plot
between E
m
and entropy was taken.
In the development of this data processing tool,
other features have been created as a background sup-
port or as a different parallel processing path (Figure
SnoringAnalysisonFullNightRecordingsbasedintheEnergyandEntropyinPSGBasalStudies
223
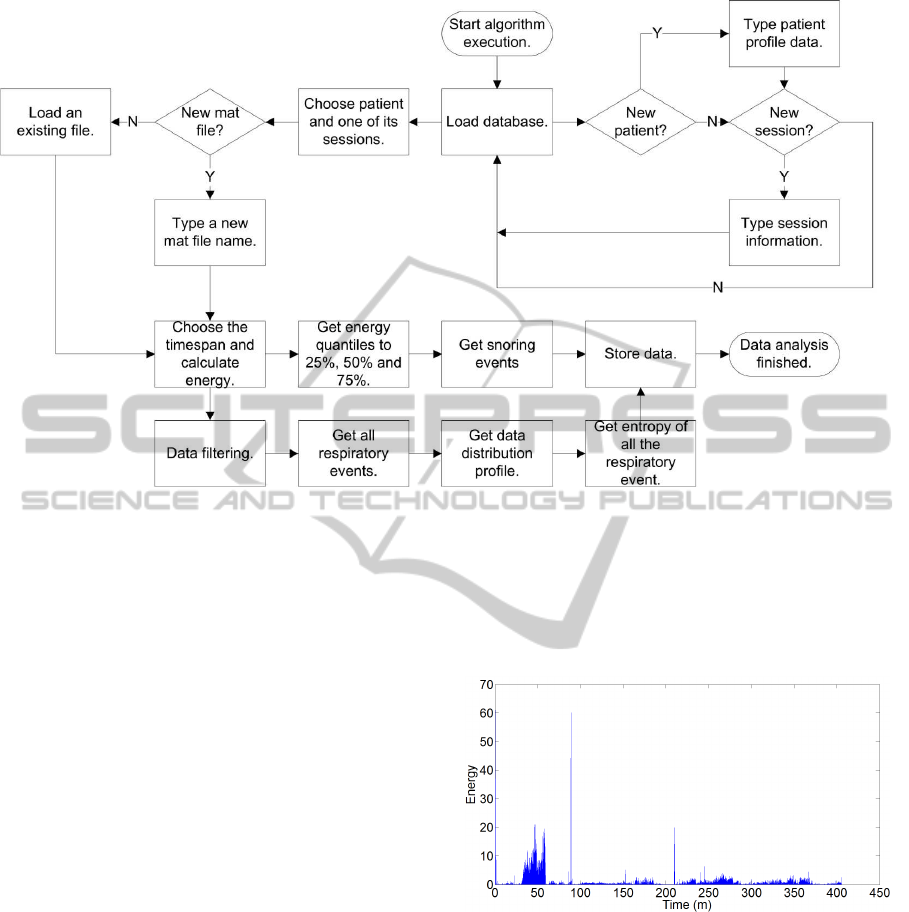
Figure 2: Algorithm workflow.
2). The alternative parallel processing path used a set
of conditions, e. g. calculation of the energy’s quan-
tile to 25%, 50% and 75%, to find only snoring events.
The results achieved allow a profile of snoring distri-
bution during the sleep and a profile of the time space
between 2 consecutives snoring events. This last pro-
file allows the user to select a time span and see where
such snoring events occur during the night. Another
feature in the algorithm allows the user to select an-
other time span in the energy plot and either appears
a list with the times of the respiratory events or a list
with the times of the snoring events of such time span.
If the selected data type is respiratory events, there
is the possibility to listening an individual event and
classify it as breath, snore or interference.
3 RESULTS
Each full night sound recording had near 2GB of data.
Such amount of data was huge and not easy to han-
dle in an ordinary computer. Even if a computer has
enough RAM memory to load this amount of data it
would be unwise because it would affect its perfor-
mance. On the other hand, if the algorithm picked
up a suitable time span to calculate the energy, no
respiratory event would be lost and higher amplitude
signals would be distinguish even better than lower
amplitude signals because of the energy’s definition,
∑
N
i=1
x
2
i
. A good time span, not too big to lost respi-
ratory events and not too little to get a small energy
array, was required and the time chosen was 0.1 sec-
onds. An example of the energy array of a full night
sound recording, for a time span of 0.1 seconds, is
available in Figure 3 and in Figure 4.
Figure 3: Sound energy of a full night sound recording with
y-axis in linear scale.
In Figure 4 it is possible to identify some oscil-
lations in the baseline of the signal energy. The first
half of the energy distribution is very different from
the second half. Even within the first half of the en-
ergy distribution the baseline is not stable, with peri-
odic oscillations between 2 values. Both values are
higher than the energy baseline of the second half.
In signal acquisition is very difficult to have a sig-
nal without interference. In this work several inter-
ference sources may exist. The most common ones
are coughing, changingbed sleep position, road traffic
and sleep technicians talking with patients or resolv-
BIOSIGNALS2013-InternationalConferenceonBio-inspiredSystemsandSignalProcessing
224

Figure 4: Sound energy of a full night sound recording with
y-axis in log scale.
ing data acquisition problems. Another interference
sources are poor weather conditions, like heavy rain
or strong winds, air conditioning (AC) and capno-
graph. In Figure 4 the source of interference is most
likely to be the AC. Performed tests to evaluate the
functional behaviour of the AC show a similar pro-
file. In the first half of the energy distribution, AC
switches between the working and the idle mode. In
the second half the AC was shut down since the en-
ergy baseline achieve even lower values. An example
of a recording free of interference from an AC system
is available in Figure 5.
Figure 5: Full night energy profile when AC is always off.
Computing the energy of a signed signal shifts its
baseline from near zero to a higher value since all en-
ergy values are non-negative. Before the implementa-
tion of a Gaussian fit, pre-processing techniques must
be implemented to have an energy signal with a base-
line near zero around the respiratory event. Since the
Gaussian function has near zero values for points far
enough of the expected value, µ, a filtering process
was developed in the algorithm. The filtering process
developed can be split in two steps. In the first one, a
convolution was implemented to shift the baseline to
values nearer to zero. The second step implements a
moving average filter to reduce or even eliminate low
level amplitude signals. Figure 6 shows the energy
distribution before, in a blue line, and after filtering,
in a red line.
After the filtering process, the algorithm applied
Figure 6: Sound energy before (blue line) and after (red
line) filtering and respiratory events detection (dark dots).
the Gaussian fit to the filtered data and it tried to find
the time location of all the respiratory events. The
Gaussian fit was very accurate and it found almost all
the respiratory events and its maxima. Figure 6 shows
how the algorithm performed in the detection of such
events, dark dots.
With a set of data identifying the respiratory
events of a full night sound recording, the algorithm
applied the definition of the Shannon’s Entropy to
calculate the entropy of each respiratory event in
its neighborhood. The Shannon’s Entropy is calcu-
lated using the original data from the full night sound
recording.
Figure 7: Relationship between energy and entropy for pa-
tient 1 to 12.
Figure 8: Relationship between energy and entropy for pa-
tient 13 to 24.
The relationship between energy and entropy for
all the patients from this research may be seen in Fig-
SnoringAnalysisonFullNightRecordingsbasedintheEnergyandEntropyinPSGBasalStudies
225

Figure 9: Relationship between energy and entropy for pa-
tient 25 to 36.
ure 7, Figure 8 and Figure 9. In Figure 10 it is possible
to see the relationship between entropy and energy for
2 different patients. The red profile shows an exam-
ple of a patient with a medical diagnosis of snoring.
The blue profile shows an example of a non-snoring
patient.
Figure 10: Relationship between energy and entropy of
each respiratory event for a non-snoring patient (blue) and
for a snoring patient (red).
Figure 11: Relationship between energy and entropy while
AC is off (green) an on (red) switching between working
and idle state.
The interference of the AC during data acquisition
can be analyzed in Figure 11. Although there are de-
viations in the data distribution, the trend line of the
relationship between both variables it is not affected.
The relationship between the energy and the en-
tropy of a respiratory event seems to have an upper
limit, a vertical asymptote function. This limit is jus-
tified by (5). For a chosen logarithm base, the en-
tropy is only a function of the probability of an event,
H(x) ∝ p(x
i
). So, whatever the energy value, the max-
imum entropy is achieved when the number of differ-
ent events in the neighborhood of a respiratory event
is equal to the number of different events of an entire
full night sound recording.
4 CONCLUSIONS
The relationship between both variables for a full
night data recording suggests the existence of a trend
line. Although the paper does not introduce a mathe-
matical equation of such trend line, Figures 7, 8 and
9 show a common behaviour. For low entropy values
an almost horizontal line represents quietly respira-
tory events. Such respiratory events are non-snoring,
meaning a normal breath from the patient. It is pos-
sible to see a high density in this area of the plot in
Figure 10, especially in the blue profile.
In the case of a non-snoring patient the trend line
should be an equation of the type y = b, with b the
best representative value of all the energies of the res-
piratory events. Figure 10, blue profile, is an example
of a non-snoring patient accordingly with the medi-
cal opinion. There isn’t a perfect horizontal trend line
but almost all the points are below the energy value
of 0.1. The points missing the equation y = b repre-
sents interference generated during the recording and
also snores. Despite the classification as a non-snore
patient it doesn’t mean the patient doesn’t snore. It
means the patient doesn’t snore or he snores just a lit-
tle bit.
As quietly respiratory events start to be replaced
by loud respiratory events, a snoring event, the energy
also increases. The increase in energy induces an in-
crease in the disorganization of the normal breathing.
As a consequence entropy increases.
Although there is a clear trend line in the plots
entropy vs. energy, some dots miss such relationship.
Such deviations can be explained by the interference
and by the Gaussian fit process. During the night, the
patient can change their sleeping position, can cough
or the sleep technician can go to the bedroom. On
the other hand, the Gaussian fit can find some false
respiratory events.
In the future, the relationship between energy and
entropy can be used by the physicians to understand
the development of OSAS. Since OSAS means a total
or partial obstruction of the upper airways, the mo-
ment when the muscle re-acquire tonus to let the air
go into the lungs can give useful information about
BIOSIGNALS2013-InternationalConferenceonBio-inspiredSystemsandSignalProcessing
226

the disorganization of the process.
Further work must be developed to understand
data distribution and its variability in the plots entropy
vs. energy. A second feature to be explored in these
plots is the slope of a mathematical equation repre-
senting each data set. To know how fast and earlier in
time the curve starts to rise can reveal new useful in-
formation. These information may bring new insights
in the study of snoring and OSAS.
ACKNOWLEDGEMENTS
A special acknowledge to the sleep technicians Clara
Santos, Conceic¸˜ao Travassos, Liliana Sousa, L´ucia
Batata, Mafalda Ferreira and Mar´ılia Rodrigues for
their support in the development of this work.
There is, also, an acknowledgement to be done to
all the patients who helped the development of this
work. Without their authorization to collect data it
would be impossible this work achieve its goal.
The development of this work was supported by
the Portuguese Foundation Fundac¸˜ao para a Ciˆencia
e a Tecnologia through the reference identification
SFRH/BD/66442/2009.
REFERENCES
Banno, K. and Kryger, M. H. (2007). Sleep apnea: Clinical
investigations in humans. Sleep Medicine, 8(4):400–
426.
Barkoukis, T. J. and Avidan, A. Y. (2007). Review of Sleep
Medicine. Butterworth-Heinemann, Philadelphia, 2nd
edition.
Beck, R., Odeh, M., Oliven, A., and Gavriely, N. (1995).
The acoustic properties of snores. Eur Respir J,
8(12):2120–2128.
Fiz, J., Abad, J., Jan, R., Riera, M., Maanas, M. A., Cami-
nal, P., Rodenstein, D., and Morera, J. (1996). Acous-
tic analysis of snoring sound in patients with simple
snoring and obstructive sleep apnoea. Eur Respir J,
9(11):23652370.
Grunstein, R. R., Hedner, J., and Grote, L. (2001). Treat-
ment options for sleep apnoea. Drugs, 61(2):237–251.
Herzog, M., Khnel, T., Bremert, T., Herzog, B., Hosemann,
W., and Kaftan, H. (2009). The impact of the mi-
crophone position on the frequency analysis of snor-
ing sounds. Eur Arch Otorhinolaryngol, 266(8):1315–
1322.
Launois, S. H., Ppin, J.-L., and Lvy, P. (2007). Sleep ap-
nea in the elderly: A specific entity? Sleep Medicine
Reviews, 11(2):87–97.
Leger, D., Bayon, V., Laaban, J. P., and Philip, P. (2012).
Impact of sleep apnea on economics. Sleep Medicine
Reviews, 16(5):455–462.
Pevernagie, D., Aarts, R. M., and Meyer, M. (2010).
The acoustics of snoring. Sleep Medicine Reviews,
14(2):131–144.
Shneerson, J. M. (2005). Sleep Medicine: A Guide to Sleep
and its Disorders. Blackwell Publishing, Malden, 2nd
edition.
Spicuzza, L., Leonardi, S., and Rosa, M. (2009). Pedi-
atric sleep apnea: Early onset of the syndrome? Sleep
Medicine Reviews, 13(2):111–122.
Wittmann, V. and Rodenstein, D. O. (2004). Health care
costs and the sleep apnea syndrome. Sleep Medicine
Reviews, 8(4):269–279.
Yadollahi, A. and Moussavi, Z. M. K. (2006). A ro-
bust method for heart sounds localization using lung
sounds entropy. IEEE Transactions on Biomedical
Engineering, 53(3):497–502.
Ye, L., Pien, G. W., and Weaver, T. E. (2009). Gender differ-
ences in the clinical manifestation of obstructive sleep
apnea. Sleep Medicine, 10(10):1075–1084.
Zhang, J., Ser, W., Yu, J., and Zhang, T. (2009). A
novel wheeze detection method for wearable monitor-
ing systems. In 2009 International Symposium on In-
telligent Ubiquitous Computing and Education, pages
331–334.
Zoom (2012). H4n. Zoom Corporation.
http://www.zoom.co.jp/products/h4n.
SnoringAnalysisonFullNightRecordingsbasedintheEnergyandEntropyinPSGBasalStudies
227
