
On Real Time ECG Segmentation Algorithms for Biometric Applications
Filipe Canento
1
, Andr´e Lourenc¸o
1,2
, Hugo Silva
1
and Ana Fred
1
1
Instituto de Telecomunicac¸˜oes, Instituto Superior T´ecnico, Lisbon, Portugal
2
Instituto Superior de Engenharia de Lisboa, Lisbon, Portugal
Keywords:
QRS Detection, ECG Segmentation, Biometrics, Identity Recognition, Real-time Analysis.
Abstract:
Recognizing an individual’s identity through the use of characteristics intrinsic to that subject is a biometric
recognition problem with increasingly number of modalities and applications. Recently, the electrical activity
of the heart (the Electrocardiogram or ECG) has been explored as an additional modality to recognize indi-
viduals. The ECG signal contains several features, which are unique to each individual. The preprocessing
of the ECG signal and the feature extraction steps are crucial for biometric recognition to be successful. In
fiducial approaches, this last step is accomplished by correctly detecting the heart beats, and performing their
segmentation to extract the biometric templates afterwards. In this work, we present an overview of the differ-
ent steps of an ECG biometric system, focusing on the evaluation and comparison of multiple real-time heart
beat detection and ECG segmentation algorithms, and their application to biometric systems. An evaluation
and comparison of the algorithms with annotated datasets (MITDB, NSTDB) is presented, and methods to
combine them in order to improve performance are discussed.
1 INTRODUCTION
Biometric recognition, or biometrics, is a growing re-
search field in which the purpose is to automatically
recognize a subject using his intrinsic characteristics
(Jain et al., 2004; Jain et al., 2007), such as: phys-
iological (e.g., Electrocardiogram), anatomical (e.g.,
fingerprint, iris) or behavioral (e.g., keystroke, signa-
ture). The latest trends in the field point towards the
multibiometrics approaches, which use one or more
of these inputs and they work by performing a pat-
tern recognition scheme, and assessing whether the
user being tested is genuine or not, i.e., the system
is able to recognize the user, or imposter (a user that
is not who he/she claims to be or is not registered in
the system’s database). Three concepts stand out in
any biometric application: i) enrollment: the initial
registration process, so that the system has informa-
tion to use later for identity recognition; ii) authenti-
cation: the recognition process in which the subject
first provides a claimed identity, the biometric tem-
plates are acquired and compared to the templates
of the claimed user, and a decision is made (gen-
uine/imposter); iii) identification: the recognition pro-
cess in which the subject does not provide any prior
information about his/her identity, hence the biomet-
ric system has to compare the acquired templates with
all the templates stored in the database.
Multiple scenarios and applications can benefit
from biometrics, such as granting/denying access to
secure areas or resources (e.g., a computer), remote
identity verification, and personalization of assets
(e.g., intelligent houses and cars), among many oth-
ers (Jain et al., 2011).
Our work is focused on Electrocardiogram (ECG)
based biometrics (Biel et al., 2001; Wang et al., 2008;
Shen, 2005; Israel et al., 2005; Lourenc¸o et al., 2011),
a recent trend in this field. The ECG of each in-
dividual has been shown to possess unique features
among individuals (Israel et al., 2005); furthermore,
the ECG holds several other biometric-relevant prop-
erties, such as: (a) it is hard to synthesize; (b) it is
continuously available; (c) it may be acquired non-
intrusively; and (d) it has a straightforward liveliness
detection.
In developing a real-time ECG based biometric
system, different challenges emerge, such as: (i)
data acquisition; (ii) signal processing; (iii) informa-
tion extraction; and (iv) biometric pattern recognition.
The first step deals with obtaining the raw ECG data
through a reliable, repeatable and non-intrusive pro-
cedure. This raw data may contain noise and other ar-
tifacts, and as such, signal processing techniques are
needed to enhance the signal quality. The next step is
to extract relevant subject-dependent information and
feed it to the biometric system so that recognition can
228
Canento F., Lourenço A., Silva H. and Fred A..
On Real Time ECG Segmentation Algorithms for Biometric Applications.
DOI: 10.5220/0004245902280235
In Proceedings of the International Conference on Bio-inspired Systems and Signal Processing (BIOSIGNALS-2013), pages 228-235
ISBN: 978-989-8565-36-5
Copyright
c
2013 SCITEPRESS (Science and Technology Publications, Lda.)

be performed.
There are two types ECG based biometrics meth-
ods: fiducial (Biel et al., 2001; Wang et al., 2008;
Shen, 2005; Israel et al., 2005) and non-fiducial
(Coutinho et al., 2010; Chan et al., 2008). In the
fiducial case, the crucial step in extracting informa-
tion from the ECG is to correctly detect each of the
heart beats. The non-fiducial methods extract infor-
mation without the help of reference points.
We focus on the fiducial case and therefore, the
heart beat detection and ECG segmentation algorithm
is of utmost importance.
One of the major research lines in ECG biomet-
rics has been focusing on the development of non-
intrusive measurement methods (Silva et al., 2011b),
leading to increased measurement noise. Further-
more, so far, researchers have focused on offline pro-
cessing, which limits the deployment and applicabil-
ity of currently available ECG-biometrics techniques
in a real-world scenario. In this paper, we present an
overview and comparison of multiple real-time seg-
mentation algorithms, taking into account the influ-
ence of measurement noise on the biometric perfor-
mance. To improve robustness and performance, we
propose and evaluate a set of different voting methods
to combine the output information of the segmenta-
tion algorithms.
The rest of the paper is organized as follows: Sec-
tion 2 provides background information about the
ECG and it’s application to biometric recognition;
Section 3 deals with the ECG based biometrics steps;
Section 4 presents the experimental protocol and dis-
cusses the results obtained; and Section 5 concludes
the paper and gives some future work ideas.
2 BACKGROUND
The heart has a set of specialized cells with self-
excitatory properties, which produce the electrical im-
pulses that trigger the mechanical action of the car-
diac muscle fibers; the Electrocardiogram (ECG) is
the measurement of its electrical activity over time.
Typically, the ECG is acquired with a set of elec-
trodes on the thorax. Placing electrodes on the thorax
is not practical in a biometric point-of-view, and re-
cently other approaches have been presented, such as
the one in (Lourenc¸o et al., 2011; Silva et al., 2011b),
in which a 1-lead setup for ECG signal acquisition at
the fingers using Ag/AgCl electrodes without gel is
proposed.
For a healthy human heart, the ECG waveform for
each heart beat resembles the one depicted in Fig. 1:
it is composed of the P, Q, R, S, and T waves and beat
Figure 1: ECG heart beat example. The corresponding ECG
signal was acquired at the fingers using the setup proposed
in (Silva et al., 2011a).
detection is usually performed by searching for each
R-peak or QRS complex.
Before being able to extract any information, the
ECG signal needs preprocessing due to measurement
noise and other artifacts which may be contaminating
the signal (e.g., motion artifacts). This step is per-
formed by applying a specific filter, designed to en-
hance the signal quality, while avoiding distortion and
loss of relevant information.
3 ECG BASED BIOMETRICS
The architecture of an ECG biometric system follows
the block diagram of Fig. 2: the raw ECG is acquired,
preprocessed and convertedto a digital format; digital
signal filtering techniques are applied and QRS detec-
tion is performed. With the QRS complexes detected,
the ECG signal is divided in segments corresponding
to individual heart beats. Different features may be
extracted from the heart beat waveform, such as: QRS
complex duration, P, Q, R, S, and T waves amplitudes
and onsets, (Biel et al., 2001; Chung, 2000). Features
are then used as input to the biometric system, where
pattern recognition is performed. In our case, the pat-
terns correspond to ECG signal windows of 600ms
around the QRS complexes: 200ms to the left and
400ms to the right of the R peak. These values were
selected according to the typical physiological dura-
tion of the P-Q and S-T complexes.
3.1 Preprocessing
To enhance the ECG signal quality and increase the
signal-to-noise ratio, we designed a 300 order band
pass Finite Impulse Response (FIR) filter with a Ham-
ming window, and cutoff frequencies of 5Hz to 20Hz.
These specifications, take into account the ECG infor-
OnRealTimeECGSegmentationAlgorithmsforBiometricApplications
229
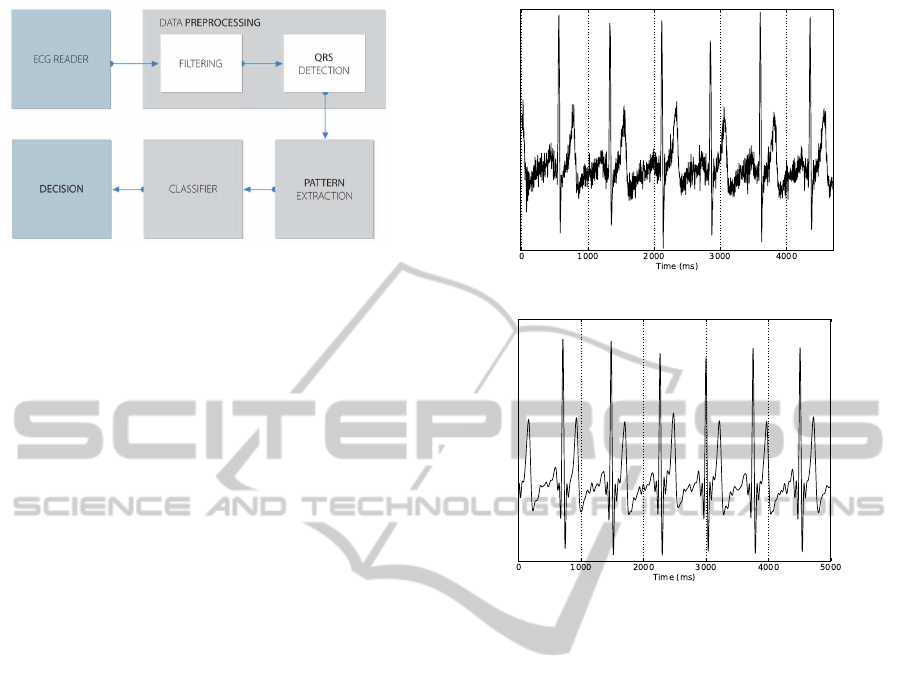
Figure 2: Block diagram of an ECG based biometric sys-
tem.
mation bandwidth, and empirical considerations ex-
tracted from the heuristic analysis of the signal. Con-
cerning real time applications, the signal is acquired
and filtered in frames, and thus a method to process
each frame and merge them into a meaningful sig-
nal is required. One way to solve this problem is to
use the overlap-add method (Oppenheim and Schafer,
1975). Fig. 3(a) shows an example of a raw ECG sig-
nal acquired at the fingers using the protocol proposed
in (Silva et al., 2011a) and Fig. 3(b) is the correspond-
ing filtered signal with the overlap-add FIR method.
3.2 QRS Detection
We evaluated five QRS detection-ECG segmentation
algorithms: I. Christov (CHRIS) (Christov, 2004),
Engelse and Zeelenberg(EZEE) (Engelse and Zeelen-
berg, 1979), P. Hamilton (HAM) (Hamilton, 2002),
H. Gamboa (GAMBOA) (Gamboa, 2008), and ECG
Slope Sum Function (ESSF) (Zong et al., 2003).
I. Christov proposes a QRS complex detection
algorithm which applies an adaptive threshold to a
constructed complex lead signal. This threshold is
a linear combination of the following components:
a steep-slope threshold (M); an integrating threshold
(F); and a beat expectation threshold (R), (Christov,
2004).
The algorithm by Engelse and Zeelenberg was
proposed in 1979. In this work, we used the mod-
ified real time version of this algorithm proposed in
(Loureno et al., 2012) (EZEEMod). It applies a differ-
entiator, a low pass filter and scans the resulting sig-
nal, in a 160ms moving window, with adaptivethresh-
olds. These are updated each time and are a function
of the maximum signal amplitude. Furthermore, the
algorithm ignores peaks within a 200ms interval of
the previous detected R-peak.
Hamilton proposed a QRS complex detection al-
gorithm that works by first preprocessing the ECG
signal and then scanning and evaluating it according
to a set of rules related to the interval between con-
(a) Raw ECG Signal.
(b) Overlap-add FIR filtered ECG Signal.
Figure 3: Raw and filtered versions of an ECG signal ac-
quired at the fingers using a sampling frequency of 1000Hz
and a frame size of 100ms.
secutive R peaks, (Hamilton, 2002).
For QRS detection, H. Gamboa proposes in (Gam-
boa, 2008) an algorithm that involves signal normal-
ization via histogram computation and threshold set-
ting and R peak detection via ECG signal derivative
and threshold surpassing.
The Slope Sum Function (SSF) is a weighted
moving average function which enhances the upslope
of the ECG signal and thereby makes the R-peak de-
tection easier. It was applied to the Blood Volume
Pulse (BVP) signal in (Zong et al., 2003). In this
work, we adapted the SSF for the ECG signal.
3.2.1 QRS Complex Validation through Voting
We have also implemented a QRS detection algorithm
that combines and validates the information from the
above five algorithms. In summary, we ran each algo-
rithm separately and then decide if each detected QRS
complex is valid by voting. Two criteria were used: a)
one of the algorithms is taken as reference and each
QRS complex is considered valid only if at least two
of the other algorithms also detected the same QRS
complex (within a 50ms tolerance) - majority voting;
BIOSIGNALS2013-InternationalConferenceonBio-inspiredSystemsandSignalProcessing
230

and b) from the set of all QRS complexes detected
(by the five algorithms), we validate only those that
are common to all five algorithms - unanimity voting.
3.3 Segmentation
After the ECG preprocessing, we perform ECG seg-
mentation by evaluating each QRS complex and clip-
ping the ECG signal in an interval 200ms to the left of
the R-peak to 400ms to the right (values based on the
typical duration of the P-Q and S-T complexes). In
this way, information from the QRS complex as well
as from the P and T waves is assured, and an ECG pat-
tern is generated for each heartbeat. Fig. 4 illustrates
the procedure.
Figure 4: ECG segmentation example: the arrows and
dashed lines indicate the length and limits of each segment.
On a side note, compression may occur in the
ECG signal when the heart rate increases significantly
and the fixed -200ms to +400ms interval would not be
the most suited one as it may contain information of
2 heart beats. This was not a problem in our exper-
imental protocol but future work should take this in
consideration.
3.4 Pattern Recognition
In this work, pattern recognition is performed by eval-
uating the Euclidean Distance (ED) between differ-
ent ECG patterns. In the enrollment phase, the sub-
ject interacts with the biometric system, ECG data is
acquired, filtered, segmented and the ECG segments
(or combinations of them) are saved as ECG patterns.
These are called the train patterns. In the authentica-
tion or identification phases, the subject goes through
the same process, but this time the ECG segments
saved as ECG patterns are considered test patterns.
These are compared with the train patterns available
and the user is recognized if the k-smallest EDs be-
tween the test patterns and the train patterns are below
a defined threshold. In summary, we perform pattern
matching with a k-Nearest Neighbor (k-NN) classifier
followed by a threshold test.
4 EXPERIMENTAL RESULTS &
DISCUSSION
4.1 QRS Detection Performance
We implemented each of the QRS detection algo-
rithms in Python and ran them with data from the
Physionet database (Goldberger et al., 2000): the
MIT-BIH Arrhythmia Database (MITDB) (Moody
and Mark, 2001) which contains 48 half-hour ECG
recordings from 47 subjects, and the MIT-BIH Noise
Stress Test Database (NSTDB) (Moody et al., 1984)
which consists of 12 half-hour ECG recordings.
Table 1 summarizes the QRS detection results
(mean and standard deviation) for each of the previ-
ously presented QRS detection algorithms and for the
two annotated databases used (column 1). The sec-
ond column presents the algorithm’s performance as
measured by the ratio between the number of correct
beats and the number of total detected beats (correct
plus incorrect).
Per formance =
correctbeats
incorrectbeats+ correctbeats
A detected beat is correct if it is within a 50ms toler-
ance interval from an annotated beat. Otherwise it is
considered incorrect. The third column presents the
correctly detected beats deviation error (DE), com-
puted as the absolute value of the difference between
the detected beat time instant and the annotated beat
time instant. The fourth column presents the false
positive results. It shows the mean and standard devi-
ation values of the percentage of false positives, i.e.,
the ratio between the number of incorrect beats and
the total number of detected beats. Below columns 2
to 4, there are 2 sub-columns indicating whether the
results correspond to the algorithm on its own (Solo)
or whether the results were evaluated using the major-
ity criterion.
The QRS detection performance is above 90% for
all five algorithms and the MITDB dataset. Also, all
of them have a worse performance in the NSTDB
dataset with the EZEEMod, HAM, and GAMBOA al-
gorithms dropping to a performance around 75%, and
the CHRIS and ESSF algorithms to around 85%. The
deviation error is the lowest in the ESSF case with a
mean of 3ms and 2ms for the MITDB and NSTDB
datasets. The number of incorrect beats is below 10%
in all cases and for the MITDB dataset and is higher
OnRealTimeECGSegmentationAlgorithmsforBiometricApplications
231

Table 1: QRS detection performance, deviation error and false positive results. Values are: mean±standard deviation.
Algorithm Performance (%) Deviation Error (ms) False Positives (%)
Database Solo Majority Solo Majority Solo Majority
EZEEMod
MITDB 90.5±17.3 92.0±15.3 5.2±5.6 5.1±5.3 9.5±17.3 8.0±15.3
NSTDB 75.6±12.7 85.0±9.1 6.3±2.8 5.9±2.4 24.4±12.7 15.0±9.1
CHRIS
MITDB 94.3±7.8 93.3±12.6 13.1±6.1 13.1±5.9 5.7±7.8 6.7±12.6
NSTDB 83.3±12.1 85.5±10.9 13.6±4.2 13.3±4.0 16.7±12.1 14.5±10.9
HAM
MITDB 90.9±13.6 92.5±12.8 9.8±6.2 9.8±6.2 9.1±13.6 7.5±12.8
NSTDB 73.2±15.3 84.4±10.4 11.7±7.6 11.1±7.4 26.8±15.3 15.6±10.4
GAMBOA
MITDB 92.3±13.2 92.6±13.1 14.3±17.0 14.3±17.0 7.7±13.2 7.4±13.1
NSTDB 74.1±30.2 74.9±30.5 18.3±17.2 18.3±17.2 25.9±30.2 25.1±30.5
ESSF
MITDB 91.6±15.5 92.0±15.1 3.4±3.9 3.4±3.9 8.4±15.5 8.0±15.1
NSTDB 88.8±7.2 89.8±7.3 2.3±1.1 2.2±1.2 11.2± 7.2 10.2±7.3
for the NSTDB dataset, ranging from 11% (ESSF) to
27% (CHRIS).
Overall, the CHRIS and ESSF algorithms cor-
rectly detects more beats, with the latter presenting
a better accuracy with respect to the beat position.
Also, the ESSF algorithm is the most robust one
as the results with the two different datasets match
more closely than in the other algorithms, and as it
presents a better performance in the presence of noise
(NSTDB dataset).
The application of the majority criterion reduces
the number of false positives detected, which boosts
performance (by increasing the ratio between cor-
rect beats and total detected beats) in all cases except
one. In the CHRIS-MITDB, the case with higher per-
formance in the solo mode, the majority voting de-
creased the number of true positives (correctly de-
tected beats), and consequently decreased the perfor-
mance, due to the fact that the majority of the other
algorithms were not able to detect some of the beats
detected with the CHRIS algorithm.
Table 2 complements Table 1 by presenting the re-
sults obtained using the unanimity criterion. In this
case, each QRS complex detected is validated only
if it was detected by all five algorithms. This re-
duces the number of false positives detected but also
removes beats that were correctly detected by some
algorithms but not all. The performance is similar to
the mean value of the performances of each algorithm
separately.
Table 3 also complements Table 1 by presenting
the mean and standard deviation of the number of de-
tected QRS complexes for each algorithm and dataset
(MITDB and NSTDB), as well as the annotated data
values (ANNOTATED).
Table 2: QRS detection results with the Unanimity crite-
rion. Values are: mean±standard deviation.
Unanimity MITDB NSTDB
Performance (%) 93.8±12.7 79.0±29.7
False Positives (%) 6.2±12.7 21.0±29.7
4.2 Biometric Recognition Evaluation
In this case, a dataset previously collected by our
group was used (Silva et al., 2011a). It is composed
of data from 62 subjects (47 males and 15 females)
with ages in the 31.1±9.46 range. The ECG data was
collected from the subject’s hands for approximately
2 minutes using Ag/AgCl electrodes. The ECG sen-
sor is characterized by a gain of 1000 and an analog
band pass filtering (1Hz to 30 Hz).
We used a subset of 31 individuals and choose this
dataset as our interest is in hand ECG based biomet-
rics. This allows us to test the biometric performance
BIOSIGNALS2013-InternationalConferenceonBio-inspiredSystemsandSignalProcessing
232

Table 3: Mean and standard deviation of the number of de-
tected QRS complexes.
Algorithm
QRS complexes
MITDB NSTDB
ANNOTATED 2079.4±468.4 1854.5±311.5
EZEEMod 2176.0±493.0 2160.3±155.7
CHRIS 2162.5±389.9 2008.8±252.4
HAM 2275.8±429.6 2441.3±319.7
GAMBOA 2136.4±516.9 1526.1±694.6
ESSF 2114.3±588.8 1759.7±309.7
of the algorithms with signals acquired using a practi-
cal and non-intrusiveprocedure, in a biometrics point-
of-view, and that have a lower signal-to-noise ratio
(when compared with ECG signals acquired with a
set of electrodes at the thorax). The QRS detection
performance was not evaluated with this dataset as
ground-truth annotations are not available.
We performed three experiences: one with ECG
segments, one with mean waves of 3 ECG segments,
and one with mean waves of 5 ECG segments. ECG
segments for each individual were generated from
the raw data, following the steps presented in Sec-
tion 3. For each QRS detection algorithm, we cre-
ated a dataset with these ECG segments and two other
datasets in which each entry corresponds to a mean
curve of (3 or 5) adjacent ECG segments. For each
dataset constructed, the biometric recognition evalua-
tion was performed10 times using 60 random patterns
for each individual (30 for training and 30 for test).
To measure the system’s effectiveness, the False
Acceptance Rate (FAR), False Rejection Rate (FRR),
Receiver Operating Characteristic (ROC), and the
Equal Error Rate (EER) measurements are commonly
used. The FAR measures the rate at which a non-
authorized individual is accepted; the FRR is the fre-
quency at which the system rejects an authorized indi-
vidual; the ROC plots the rate at which an authorized
person is granted access (True Positive Rate) versus
the FAR; and the EER is the rate at which the FRR
equals the FAR. The EER is inversely proportional to
the biometric system’s accuracy: the lower the EER,
the more accurate the system is.
4.2.1 Authentication
Table 4 presents the authentication results obtained.
The performance is similar in all five algorithms and
the EZEEMod and ESSF algorithms are the ones with
the best results overall. This is justified by the fact
that, as we saw in the previous section, these algo-
rithms present higher accuracy with respect to the R-
peak position detection, which is crucial for the seg-
mentation step and the comparison between patterns.
Furthermore, using mean waves, as opposed to single
segments, presents better results in most cases (EER
is lower in all cases except in the CHRIS case).
The recognition rates using the majority criterion
are similar to the ones using the algorithm separately.
This is justified with the fact that all algorithms have
similar QRS detection results with this dataset as we
observed posteriorly.
The unanimity criterion results compete with the
best results obtained in all other cases: 5.8±0.5
(Unanimity-Segments) versus 5.7±0.3 (EZEEMod
and SSF-Solo-Segments); 3.0±0.4 (Unanimity-Mean
Waves of 3) versus 3.2±0.5 (EZEEMod-Solo-Mean
Waves of 3); and 2.0±0.4 (Unanimity-Mean Waves
of 5) versus 2.4±0.6 (SSF-Majority-Mean Waves of
5). Fig. 5 presents the FAR and FRR curves for the
lowest EER obtained (Unanimity-Mean Waves of 5).
Table 4: Authentication results: mean and standard devia-
tion of the EER for the 10 runs of the different trials per-
formed.
Algorithm
EER (%)
Segments
Mean Waves of
3 5
EZEEMod
Solo 5.7±0.3 3.2±0.5 2.5±0.7
Majority 6.2±0.4 3.4±0.3 3.0±0.5
CHRIS
Solo 5.8±0.5 7.2±0.4 6.3±0.9
Majority 5.9±0.4 7.5±0.7 6.1±0.7
HAM
Solo 5.8±0.3 3.7±0.4 3.1±0.6
Majority 6.0±0.4 3.9±0.4 3.4±0.6
GAMBOA
Solo 5.7±0.4 5.6±0.6 4.7±1.1
Majority 5.7±0.5 5.2±0.6 4.3±1.0
ESSF
Solo 5.7±0.3 3.5±0.3 2.5±0.5
Majority 5.8±0.4 3.5±0.3 2.4±0.6
Unanimity
5.8±0.5 3.0±0.4 2.0±0.4
OnRealTimeECGSegmentationAlgorithmsforBiometricApplications
233

Figure 5: FAR and FRR curves obtained using the Unanim-
ity criterion.
4.2.2 Identification
In the identification scenario, we evaluate the biomet-
ric system’s performance by computing the identifi-
cation error. Each time the system fails to correctly
recognize a registered user is an identification error.
Identification results are presented in Table 5 and
a similar analysis to the one performed before for the
authentication scenario is used. As before, the er-
ror decreases as we switch from Segments to Mean
Waves of 3 and to Mean Waves of 5, for the majority
of the cases. Also, the use of the majority criterion
yields results similar to the ones obtained by the algo-
rithm on its own (Solo). When Segments are used, the
results are around 5-6% and HAM (Solo) presents the
lowest Identification Error: 5.0±1.1%. Using Mean
Waves, the results improve(lower identification error)
for all cases except for the CHRIS algorithm. Here,
the algorithms EZEEMod (Majority) and Unanimity
tie in first place: best result is 2.5±0.7%. The lowest
identication error overall is obtained by applying the
Unanimity criterion to Mean Waves of 5: 1.6±0.6%.
5 CONCLUSIONS AND FUTURE
WORK
We evaluated and compared five real-time segmenta-
tion algorithms with respect to their performance and
biometric application. In future work, the warping ef-
fects, which results in the compression (expansion) of
the ECG beat waveform due to higher (lower) heart
rate should be considered and handled using adaptive
segmentation limits, for example. We also plan to an-
notate the hand ECG dataset and re-run the beat de-
tection performance tests to clearly know how each
algorithm behaves with the hand ECG signals, which
present a low signal-to-noise ratio, and high sensitiv-
ity to motion artifacts. About the biometric system,
Table 5: Identification results: mean and standard deviation
of the identification error for the 10 runs of the different
trials performed.
Algorithm
Identification Error (%)
Segments
Mean Waves of
3 5
EZEEMod
Solo 5.8±1.1 2.8±0.9 2.1±0.7
Majority 5.5±0.8 2.5±0.7 2.1±0.7
CHRIS
Solo 6.7±0.8 9.1±1.3 7.4±1.8
Majority 6.6±0.8 8.8±1.3 7.6±1.7
HAM
Solo 5.0±1.1 3.6±1.0 3.3±1.5
Majority 5.1±1.2 4.0±0.8 3.5±1.1
GAMBOA
Solo 6.2±0.8 4.7±1.1 3.1±1.3
Majority 5.1±1.1 3.8±0.8 3.0±1.0
ESSF
Solo 5.1±1.3 3.1±0.8 2.4±1.2
Majority 5.3±1.1 2.9±0.8 2.3±1.1
Unanimity
5.6±1.0 2.5±0.7 1.6±0.5
other pattern matching techniques should also be con-
sidered (e.g., using the cosine distance between pat-
terns), as well as different values for the following
parameters: number of mean waves, number of train-
ing patterns, and number of nearest neighbors used in
the k-NN classifier.
All five evaluated algorithms run in real-time: the
one by Hamilton, Gamboa, and the ESSF are sim-
pler to implement; Christov’s algorithm and the ESSF
present higher robustness and beat detection perfor-
mance; the Engelse and Zeelenberg’s modified ver-
sion and the ESSF are the ones with higher beat po-
sition accuracy. Overall, we were able to boost the
QRS detection performance by combining the infor-
mation from all algorithms in a voting manner - either
by majority or unanimity.
For biometric recognition, combining the infor-
mation from all algorithms with the unanimity crite-
rion and using mean curves of adjacent 5 ECG seg-
ments results in the lowest error percentage: 2.0±0.4
and 1.6±0.5 for the authentication and identification
scenarios, respectively.
BIOSIGNALS2013-InternationalConferenceonBio-inspiredSystemsandSignalProcessing
234

ACKNOWLEDGEMENTS
This work was partially funded by the IT - In-
stituto de Telecomunicac¸˜oes under the grant, “An-
droid Biometrics Platform”, and by the Fundac¸˜ao
para a Ciˆencia e Tecnologia (FCT) under grants
SFRH/BD/65248/2009 and SFRH/PROTEC/49512/
2009, whose support the authors gratefully acknowl-
edge.
REFERENCES
Biel, L., Petterson, O., Phillipson, L., and Wide, P. (2001).
ECG analysis: A new approach in human identifica-
tion. IEEE Trans Instrumentation and Measurement,
50(3):808–812.
Chan, A. D. C., Hamdy, M. M., Badre, A., and Badee, V.
(2008). Wavelet distance measure for person identi-
fication using electrocardiograms. IEEE Trans on In-
strumentation and Measurement.
Christov, I. I. (2004). Real time electrocardiogram QRS
detection using combined adaptive threshold. Biomed
Eng Online, 3(1).
Chung, E. K. (2000). Pocketguide to ECG Diagnosis.
Blackwell Publishing Professional.
Coutinho, D. P., Fred, A. L. N., and Figueiredo, M. A. T.
(2010). String matching approach for ECG-based bio-
metrics. Pattern Recognition, 16th Portuguese Con-
ference on.
Engelse, W. A. H. and Zeelenberg, C. (1979). A single scan
algorithm for QRS-detection and feature extraction.
Computers in Cardiology, 6:37–42.
Gamboa, H. (2008). Multi-Modal Behavioural Biometrics
Based on HCI and Electrophysiology. PhD thesis,
Universidadte T´ecnica de Lisboa, Instituto Superior
T´ecnico.
Goldberger, A., Amaral, L., Glass, L., Hausdorff, J., Ivanov,
P., Mark, R., Mietus, J., Moody, G., Peng, C., and
Stanley, H. (2000). Physiobank, physiotoolkit, and
physionet: Components of a new research resource for
complex physiologic signals. Circulation 101.
Hamilton, P. (2002). Open source ecg analysis. Computers
in Cardiology.
Israel, S., Irvine, J., Cheng, A., Wiederhold, M., and
Wiederhold, B. (2005). ECG to identify individuals.
Pattern Recognition, 38(1):133–142.
Jain, A., Flynn, P., and Ross, A. (2007). Handbook of Bio-
metrics. Springer.
Jain, A. K., Ross, A., and Prabhakar, S. (2004). An intro-
duction to biometric recognition. IEEE Trans.Circuits
Syst. Video Techn., 14(1):4–20.
Jain, A. K., Ross, A. A., and Nandakumar, K. (2011). In-
troduction to Biometrics. Springer, 2011 edition.
Lourenc¸o, A., Silva, H., and Fred, A. (2011). Unveiling
the biometric potential of Finger-Based ECG signals.
Computational Intelligence and Neuroscience, 2011.
Loureno, A., Silva, H., Leite, P., Loureno, R., and Fred, A.
L. N. (2012). Real time electrocardiogram segmenta-
tion for finger based ecg biometrics. In Huffel, S. V.,
Correia, C. M. B. A., Fred, A. L. N., and Gamboa, H.,
editors, BIOSIGNALS, pages 49–54. SciTePress.
Moody, G. and Mark, R. (2001). The impact of the mit-bih
arrhythmia database. IEEE Eng in Med and Biol.
Moody, G., Muldrow, W., and Mark, R. (1984). A noise
stress test for arrhythmia detectors. Computers in Car-
diology.
Oppenheim, A. V. and Schafer, R. W. (1975). Digital Signal
Processing. Prentice Hall.
Shen, T. (2005). Biometric Identity Verification Based on
Electrocardiogram. PhD thesis, University of Wis-
consin.
Silva, H., Fred, A., and Lourenc¸o, A. (2011a). Check your
biosignals here: Experiments on affective computing
and behavioral biometrics. In Proc Portuguese Conf.
on Pattern Recognition - RecPad, Porto, Portugal.
Silva, H., Lourenc¸o, A., Lourenc¸o, R., Leite, P., Coutinho,
D., and Fred, A. (2011b). Study and evaluation of
a single differential sensor design based on electro-
textile electrodes for ECG biometrics applications. In
Proc IEEE Sensors, Limerick, Ireland.
Wang, Y., Agrafioti, F., Hatzinakos, D., and Plataniotis,
K. N. (2008). Analysis of human electrocardiogram
for biometric recognition. EURASIP J. Adv. Signal
Process, 2008:19.
Zong, W., Heldt, T., Moody, G., and Mark, R. (2003). An
open-source algorithm to detect onset of arterial blood
pressure pulses. Computers in Cardiology, 30:259–
262.
OnRealTimeECGSegmentationAlgorithmsforBiometricApplications
235
