
A Biological Sound Source Localization Model
A. Azarfar and J. M. H. du Buf
Vision Laboratory, ISR/LARSyS, University of the Algarve, 8005-139 Faro, Portugal
Keywords:
Sound Source Localization, Interaural Time Difference, Interaural Level Difference, Interaural Time Differ-
ence of Envelope, Inferior Colliculus, Cognitive Robotics.
Abstract:
In this paper we address sound source localization in the azimuthal plane. Various models, from the cochlear
nuclei to the inferior colliculi, are implemented to achieve accurate and reliable localization. Coincidence
detector cells in the medial nuclei and cells sensitive to interaural level difference in the lateral nuclei of the
superior olive are combined with models of V- and I-type neurons plus azimuth map cells in the inferior
colliculus. An advanced cell distribution in the inferior colliculus is proposed to keep ITD functions at any
frequency within the physiological range of the head. Additional projections from the dorsal nucleus of the
lateral lemniscus and the medial nucleus of the superior olive are modeled such that interaural time differences
in different frequency bands converge to a single result. Experimental results demonstrate good performance
in case of a variety of normal sounds.
1 INTRODUCTION
For most of the vertebrates, sound source localization
(SSL) is a primary function for the perception of the
environment. This aspect of auditory cognition plays
a vital role for survival and communication, for ex-
ample to turn toward an incoming sound. In this pa-
per we explain a biological model of the mammalian
brain to localize sound in the horizontal (azimuthal)
plane.
For azimuthal SSL, mammalians can benefit from
three binaural cues: ITD or interaural time differ-
ence, ILD or level difference, and ITD-env or time
difference of the envelope of a modulated signal (Yin,
2002). If a sound source is located at one side of the
head, there will be a time shift (ITD) and level dif-
ference (ILD) at the two ears. However, ITD is not a
suitable cue at high frequencies (above 1.5 kHz in the
case of the human head). At such high frequencies,
ITDs of low-frequency modulation envelopes can be
useful for SSL. ILD cues cannot be used for localiz-
ing sounds below 1.5 kHz (Yin, 2002). Several hy-
potheses have been proposed for processing ITDs and
ILDs (Blauert, 2001). Many of these are based on
the coincidence model (Jeffress, 1948), and differ-
ent computational models exist for joint processing
of ITDs and ILDs (Willert et al., 2006; Raspaud et al.,
2010; Liu et al., 2010).
In this paper we present an advanced SSL model.
This model is the first one to benefit from V-type and
I-type neurons in the inferior colliculus (IC). We pro-
pose a new distribution of ITD-sensitive cells in the
IC based on biological evidence. This distribution
employs the relation between the best delay (BD) of
neurons and their characteristic frequency (CF), such
that it keeps detected ITDs in the physiological range
of the head. We also propose a model of the dor-
sal nucleus of the lateral lemniscus (DNLL) which
projects inhibitory to the ipsilateral IC. This model,
together with excitatory projections of the medial nu-
clei of the superior olive (MSO) to V-type neurons
in the IC, with the same BD but different CF, yields
an azimuthal angle estimation which is more local-
ized. Moreover, by implementing peak-type ITD-
sensitivity response functions in the IC and by de-
signing them such that they overlap with neighbor-
ing functions, we can achieve a good localization sys-
tem. This model was tested in a noisy laboratory
environment, using a dummy mannequin head. The
model was also tested on the KEMAR HRTF data
base (Gardner and Martin, 2000).
In Section 2, the neural mechanisms underly-
ing sound source localization in mammalians are de-
scribed. Our model is detailed in Section 3, and ex-
perimental results are presented in Section 4. Section
5 deals with conclusions and future work.
333
Azarfar A. and M. H. du Buf J..
A Biological Sound Source Localization Model.
DOI: 10.5220/0004247403330337
In Proceedings of the International Conference on Bio-inspired Systems and Signal Processing (BIOSIGNALS-2013), pages 333-337
ISBN: 978-989-8565-36-5
Copyright
c
2013 SCITEPRESS (Science and Technology Publications, Lda.)

2 BIOLOGICAL BACKGROUND
Many studies addressed anatomical and physiologi-
cal aspects of encoding ILD, ITD and ITD-env in
the auditory brainstem (Yin, 2002). These studies
suggested two parallel pathways for encoding these
cues. There are several similarities between the two
pathways: both receive signals from the anteroventral
cochlear nucleus (AVCN), both involve cell groups in
the superior olivary complex (SOC), and both project
to the inferior colliculus IC (Yin, 2002).
In the cochlea, hair cells in the basilar membrane
transform sound waves into spike trains. The basi-
lar membrane is organized tonotopically, and the hair
cells respond phase-locked to sinusoidal tones. In
mammals, phase-locking to pure tones is limited to
low frequencies (<3-4 kHz). This tonotopic map-
ping of the frequencies along the basilar membrane is
passed through the auditory nerves to the AVCN. The
AVCN projects to the SOC through spherical bushy
cells (SBCs) and globular bushy cells (GBCs). The
SOC involves two nuclei, the medial (MSO) and lat-
eral (LSO), which are thought to encode ITDs and
ILDs, respectively.
The MSO receives excitatory projections from the
SBCs of both ipsi- and contralateral sides. Assum-
ing the Jeffress model, coincidence detector cells in
the MSO fire when a dual delay-line network com-
pensates the time delay between the ipsi- and con-
tralateral ears. MSO cells are distributed along two
dimensions according to their CF and ITD. Coinci-
dence detector cells project to V-type cells with the
same CF in the inferior colliculus.
The LSO receives excitatory projections from the
SBCs of the ipsilateral AVCN, and inhibitory projec-
tions from the medial nucleus of the trapezoid body
(MNTB). The MNTB itself receives excitatory pro-
jections from GBCs of the contralateral AVCN. In the
classical view, LSO is the initial stage for encoding
ILDs. Moreover, some studies have shown that it is
sensitive to ITD-env of amplitude-modulated signals.
The LSO projects bilaterally to the IC. The projec-
tion from the LSO to the ipsilateral IC can be both
inhibitory and excitatory (it is mostly inhibitory), but
projections to the contralateral IC appear to be wholly
excitatory. In our model of the LSO, ILD sensitive
cells are distributed along CF and ILD, and ITD-env
sensitive cells are distributed along CF and ITD.
The lateral lemniscus is a band of nerve fibres that
originates in a cochlear nucleus and terminates in the
inferior colliculi. Its nuclei (dorsal: DNLL) are pri-
marily inhibitory, and it projects bilaterally to the in-
ferior colliculi, with different populations of cells pro-
jecting to each IC (Winer and Schreiner, 2005).
(Rose et al., 1966) defined three types of ITD sen-
sitive neurons in the IC: peak-type, trough-type and
intermediate-type. Peaks of ITD responses of peak-
type neurons align at or near a particular ITD for
different sound frequencies. For trough-type neu-
rons, the alignment occurs at or near the minima, and
for intermediate-type neurons the alignment is bipo-
lar. (Ramachandran and May, 2002) defined four
classes of neurons in the IC of cats based on responses
to tone bursts. These classes are known as type-V
neurons (peak-type ITD function, low frequencies),
type-I neurons (mostly trough- or intermediate-type
ITD function), type-O neurons (sensitive to spectral
notches), and onset neurons (these fire at the onset of
a depolarizing current injection). It was hypothesized
that the major source of input for type-V neurons is
the MSO, because peak-type sensitivity arises from
excitatory inputs from both sides. As I-type neurons
show sensitivity to both ILD and ITD-env, it was hy-
pothesized that the LSO provides dominant input to
this class of cells.
Interestingly, recent studies questioned the valid-
ity of the Jeffress model. It was shown that the best
ITD depends on the frequency. Neurons with high
CFs have best delays near zero ITD, whereas neurons
with lower CFs have best delays in the entire physio-
logical range. This frequency dependence keeps ITD
functions at any frequency within the physiological
range of the head. Furthermore, even a neuron with a
high CF and with a BD close to zero ITD may respond
to a low-frequency signal with BD near zero ITD.
Both of these cases violate the Jeffress model, be-
cause Jeffress assumed that a full range of ITD tuning
should be present in every frequency channel (Palmer
and Kuwada, 2005). A study in the anaesthetized rab-
bit demonstrated another interesting fact. It showed
that a sound not only activatesneurons with ITD func-
tions whose peaks correspond to the sound’s ITD, but
also other neurons whose ITD functions overlap the
optimally activated functions. Higher precision in de-
termining ITD may be achievable by these cell dis-
tributions in the SOC, IC and thalamus (Fitzpatrick
et al., 1997).
3 SYSTEM MODEL
Based on the biological findings outlined in the pre-
vious section, we propose a localization system that
involves models of the CN, MSO, LSO, DNLL and
IC; see Fig. 1 for a schematic diagram.
To model the cochlei and achieve tonotopic map-
ping of the signals, we use two 32-channel discrete
second-order Gammatone filterbanks (Slaney, 1993),
BIOSIGNALS2013-InternationalConferenceonBio-inspiredSystemsandSignalProcessing
334
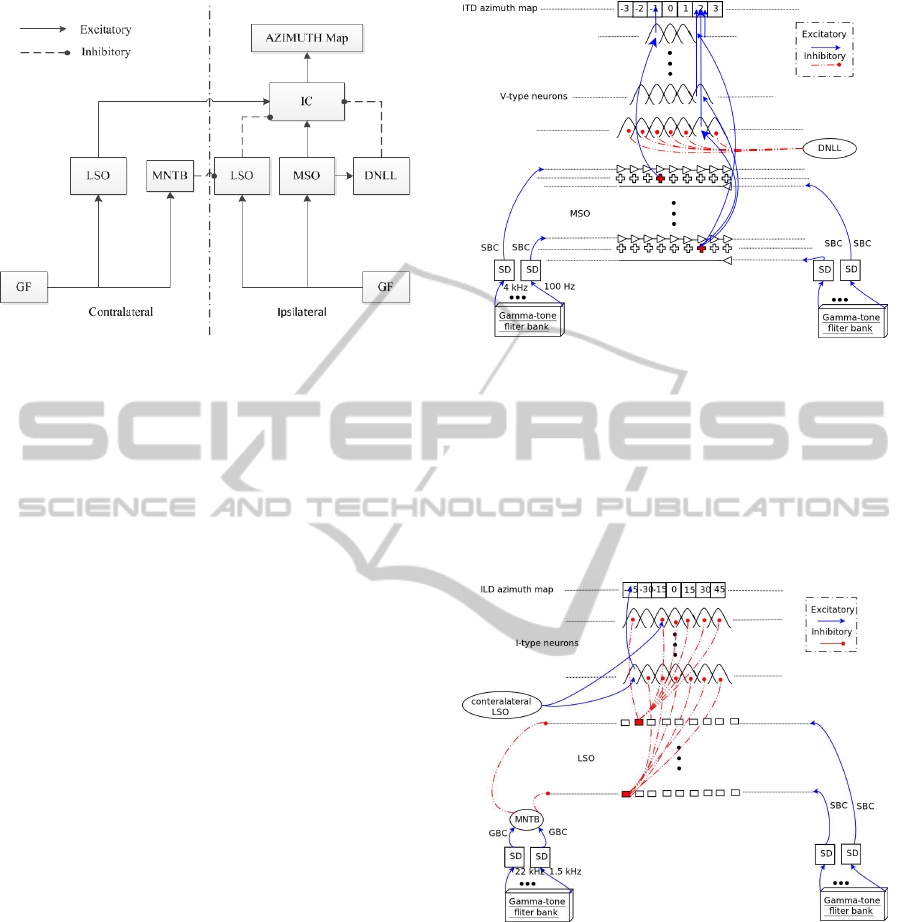
Figure 1: Schematic diagram of the localization system. GF
= Gammatone filterbank.
which filter the incoming sound from 100 Hz to 22
kHz. When the sound pressure level (SPL) exceeds
a threshold in a frequency band, the auditory nerves
with corresponding CF fire. This is simulated by sig-
nal detection (SD) modules after the filterbank, which
suppress the output of filters with SPL lower than the
threshold; see SD in Fig. 2. In our experiments the
threshold is set to -95 dB.
The MSO model and its efferent projections to IC
are shown in Fig. 2. The frequency range of the MSO
model is limited to 4 kHz. Like in (Liu et al., 2010), in
our MSO model the coincidence detector cells receive
a single delayed signal from ipsilateral SBCs, while
contralateral SBCs project through delay lines. Co-
incidence detector cells are simulated by logarithmic
summation. In each frequency band, a winner-take-
all process selects the dominant cell. The selected cell
fires excitatory to V-type neurons in the correspond-
ing frequency band of the ipsilateral IC and DNLL.
Figure 3 shows the ILD pathway, from CN to IC.
The LSO model consists of an array of ILD sensitive
cells. The level difference in each frequency channel i
is determined by ∆L
i
= (PR
i
/PL
i
), where PR and PL
are the sound pressure levels from the right and left
ears. When an ILD is detected, the responding LSO
cell provides excitatory input to ILD sensitive cells in
the same frequency band of the contralateral IC, and
the other LSO cells inhibit ILD sensitive cells in the
ipsilateral IC which are tuned to other ILDs.
For ITD-env we use the same structure as we use
for ITD (Fig. 2). After obtaining the envelope signals
by interpolation, they enter coincidence detection net-
works which project excitatory to V-type neurons in
the contralateral IC.
The DNLL model receives excitatory inputs from
the MSO cells, and it projects inhibitory to all ITD
sensitive cells in the same frequency band in the ip-
Figure 2: Schematic diagram of the ITD pathway. Ipsilat-
eral AVCN projections pass through a single delay, while
contralateral ones pass through a delay line. Coincidence
detector cells are distributed along two dimensions, ITD and
CF. V-type neurons, also distributed along these two dimen-
sions, receive excitatory input from MSO and inhibitory
input from DNLL. V-type neurons with higher CFs cover
smaller ITD ranges due to the physiological range of the
head. These neurons project excitatory to ITD azimuth map
cells.
Figure 3: Schematic diagram of the ILD pathway. The ip-
silateral AVCN provides excitatory input to LSO cells via
SBCs, while the contralateral AVCN provides inhibitory in-
put via GBCs and the MNTB. LSO and I-type cells are dis-
tributed along two dimensions, ILD and CF. IC cells receive
inhibitory input from the ipsilateral LSO and excitatory in-
put from the contralateral LSO, and project excitatory to the
ILD azimuth map.
silateral IC, except the one that is excitated by the
coincidence detector cell in the MSO. In our model,
cells in the DNLL are also distributed along two di-
mensions, CF and ITD. Since peak-type ITD func-
tions of V-type neurons with the same CF overlap
with their neighbors, more than one neuron may re-
ABiologicalSoundSourceLocalizationModel
335

spond to a projection from single coincidence detec-
tor cells. Therefore, the DNLL projections may help
the neural network of V-type neurons to converge to a
single ITD.
We implemented two types of neurons in the IC
neural network. V-type neurons in the low-frequency
region (below 4 kHz), and I-type neurons in the high-
frequency region (above 1.5 kHz). Peak-type ITD
functions of V-type neurons are simulated with Gaus-
sian functions. These neurons are trained such that the
peak of their ITD function corresponds to the correct
ITD for each azimuthal angle. Based on the received
ITD from coincidence detector cells in the MSO, a
V-type neuron fires with a weight according to its
ITD function (the Gaussian). In the low-frequency
channels there are 181 neurons for 181 distinct an-
gles in each channel (-90
◦
to +90
◦
in 1
◦
steps). How-
ever, for increasing frequencies the maximum BDs
decrease gradually. This is based on the fact that neu-
rons with high CFs have BDs near zero ITD, while
neurons with lower CFs have higher BDs. The ITD
functions of these neurons are overlapping with those
of their neighbors. This organization of the ITD func-
tions yields a higher precision in determining the ITD.
In addition, we considered the fact that neurons in
high-frequency bands respond to low-frequency sig-
nals with ITDs close to their BD. These neurons are
excitated by MSO cells with ITDs which are in the
range of their ITD functions. Like the inhibitory pro-
jections from the DNLL, this helps the neural network
to converge to a single ITD. V-type neurons project
excitatory to ITD azimuth map cells. A winner-take-
all process selects the dominant response and projects
excitatory to a general azimuth map.
Type-I neurons are sensitive to ILD and ITD-env.
For ITD-env, the neural network is similar to the one
we use for ITD. Peak-type ITD functions are also
simulated by Gaussians and are distributed along the
two dimensions CF and ITD. They are trained such
that the peaks of their ITD functions correspond to
correct ITDs for all azimuthal angles. They receive
input from ITD-env sensitive cells in the LSO with
frequencies higher than 4 kHz, where the networks
phase-lock to ITD-envof the modulation envelopes of
high-frequency sounds. There are 37 neurons for 37
distinct positions in each channel (-90
◦
to +90
◦
in 5
◦
steps). These neurons also project excitatory to ITD
azimuth map cells. A winner-take-all process selects
the dominant response and projects excitatory to the
general azimuth map.
We modeled the responses of ILD sensitive neu-
rons also by Gaussian functions. The cells are also
distributed along two dimensions, CF and ILD, and
they are also trained to correct azimuthal angles. They
Figure 4: Precision of localization with the dummy head.
receive excitatory input from the contralateral LSO
and inhibitory input from the ipsilateral LSO. The ip-
silateral LSO inhibits all ILD sensitive cells in the
same frequency band in the IC, except those with
ILD functions which align with firing cells in the ip-
silateral LSO. With this method we reduce the error
by checking the conformity of ILDs from both sides.
There are 13 neurons for 13 distinct positions in each
channel (-90
◦
to +90
◦
in 15
◦
steps). These neurons
excitate ILD azimuth map cells. A winner-take-all
process selects the dominant response and projects
excitatory to the general azimuth map cell with the
same azimuthal angle.
The general azimuth map combines the two ILD
and ITD estimations. Since ITD is more accurate
whereas ILD is more reliable, the ITD result is ac-
ceptable if its angle is within ±10
◦
of the ILD result:
the ILD input inhibits ITD input beyond this range in
order to suppress erroneous ITD estimations. Hence,
the ITD angle is the final result if it is confirmed by an
approximate ILD angle; if not, the ILD angle is the fi-
nal result. All cells and neural networks were trained
by using samples of white noise of two seconds.
4 EXPERIMENTAL RESULTS
The model was tested using a polystyrene dummy
mannequin head and an HRTF database. We used
different sounds, including white noise, hand clap,
scream, whistle and human speech. The latter con-
sisted of a small phrase and two words in English:
“look at me,” “hello” and “fish.” The experiments
with the dummy head were done in a big but nor-
mal laboratory with flat walls and noisy computers.
The distance of the sound source to the center of the
BIOSIGNALS2013-InternationalConferenceonBio-inspiredSystemsandSignalProcessing
336

head was 2 m. The head was mounted on a pan-tilt
unit. The sampling rate was 44.1 kHz and the sounds
had different durations. Simple omnidirectional web-
cam microphones were mounted in the head at the ear
positions (without pinnae). All experiments were re-
peated 7 times at 180 distinct positions in front of the
head (-90
◦
to +90
◦
in 1
◦
steps).
Figure 4 shows the results obtained with the
dummy head. Between -30
◦
and +30
◦
, the average
error is less than 1
◦
for all sounds. Beyond ±30
◦
the
error is bigger, on average 2.73
◦
with a maximum er-
ror of about 15
◦
. Interestingly, the results of the high-
frequency whistle sound (5-7 kHz) are comparable to
those of the low-frequency sounds. At high frequen-
cies, auditory nerves do not phase-lock and angle es-
timation is based on projections of ITD-env sensitive
cells in the IC. With the dummy head the model could
differentiate ILDs from -60
◦
to +60
◦
. ILD-only re-
sults were reliable with an accuracy of 15
◦
.
The KEMAR HRTF database is available with a
resolution of 5
◦
. Therefore the peaks of the ITD func-
tions of V-type neurons were re-trained using these
angles. Since the resolution is less, and the HRTFs
were measured in an anechoic chamber, we expected
a better accuracy. Indeed, the results obtained are very
accurate between ±40
◦
. Beyond these angles, accu-
racy decreases: the mean error was 2.1
◦
and the maxi-
mum error was only 5
◦
. ILD-only resolution was also
15
◦
from -60
◦
to +60
◦
.
5 CONCLUSIONS
In this paper we described a computational model
based on the mammalian brain. It employs ITD, ILD
and ITD-env detection pathways from the cochlear
nuclei to the inferior colliculus. V-type neurons in
the IC with peak-type ITD functions are used. Their
distribution in the IC and their input projections from
MSO and DNLL are modeled. I-type neurons are
simulated to determine ILD and ITD-env. All inter-
aural cues are combined in the IC to yield broad-
band sound source localization. The merging of the
cues yields a reliable and accurate system that works
in the human frequency range. Experimental results
were very good. In the future, azimuthal localization
will be complemented by the elevation angle, using
ear-like pinnae and type-O neurons sensitive to spec-
tral notches. The connection of the IC to the motor-
sensory pathways and hippocampus will be investi-
gated to move a robot toward sounds. Audio-visual
object localization and identification is a particular
field of interest.
ACKNOWLEDGEMENTS
Pluri-annual funding of ISR/LARSyS by the Por-
tuguese Foundation for Science and Technology
(FCT), and EU project NeuralDynamics, FP7-ICT-
2009-6, PN: 270247.
REFERENCES
Blauert, J. (2001). Spatial Hearing. MIT Press.
Fitzpatrick, D. C., Batra, R., Stanford, T. R., and Kuwada,
S. (1997). A neuronal population code for sound lo-
calization. Nature, 388(6645):871–874.
Gardner, B. and Martin, K. (2000). HRTF Measurements
of a KEMAR Dummy-Head Microphone. MIT Media
Lab.
Jeffress, L. A. (1948). A place theory of sound localization.
J Comp Physiol Psychol, 41(1):35–9.
Liu, J., Perez-Gonzalez, D., Rees, A., Erwin, H., and
Wermter, S. (2010). A biologically inspired spik-
ing neural network model of the auditory midbrain
for sound source localisation. Neurocomputing,
74(13):129–139.
Palmer, A. and Kuwada, S. (2005). Binaural and spa-
tial coding in the inferior colliculus. In : Winer, J.
and Schreiner, C. (eds), The Inferior Colliculus, pages
377–410. Springer New York.
Ramachandran, R. and May, B. J. (2002). Functional seg-
regation of itd sensitivity in the inferior colliculus of
decerebrate cats. J Neurophysiol, 88(5):2251–61.
Raspaud, M., Viste, H., and Evangelista, G. (2010). Bin-
aural source localization by joint estimation of ild and
itd. Trans. Audio, Speech and Lang. Proc., 18(1):68–
77.
Rose, J. E., Gross, N. B., Geisler, C. D., and Hind, J. E.
(1966). Some neural mechanisms in the inferior col-
liculus of the cat which may be relevant to localization
of a sound source. J Neurophysiol, 29(2):288–314.
Slaney (1993). An efficient implementation of the
Patterson-Holdsworth auditory filter bank. Apple
Computer Technical Report, 35.
Willert, V., Eggert, J., Adamy, J., Stahl, R., and Kaerner,
E. (2006). A probabilistic model for binaural sound
localization. IEEE Trans Syst Man Cybern B,
36(5):982–94.
Winer, J. and Schreiner, C. (2005). The central auditory
system: A functional analysis. In : Winer, J. and
Schreiner, C. (eds), The Inferior Colliculus, pages 1–
68. Springer New York.
Yin, T. C. T. (2002). Neural mechanisms of encoding bin-
aural localization cues in the auditory brainstem. In
: Fay, R.R., Popper, A.N. (eds), Integrative Functions
in the Mammalian Auditory Pathway, pages 99–159.
SpringerVerlag.
ABiologicalSoundSourceLocalizationModel
337
