
AgED: Extraction and Evaluation of Elliptic Fourier Descriptors
from Image Data in Phenotype Assessment Applications
J
¨
orgen Brandt
1
and Alexander Heyl
2
1
Federal Institute for Risk Assessment, Diedersdorfer Weg 1, D-12277 Berlin, Germany
2
Institute of Biology/Applied Genetics, Dahlem Centre of Plant Sciences (DCPS), Freie Universit
¨
at Berlin,
Albrecht-Thaer-Weg 6, D-14195 Berlin, Germany
Keywords:
Image Analysis, Statistical Evaluation, Feature Extraction, Software, Coleochaete scutata, Fourier Descrip-
tors, Kernel Density Estimation.
Abstract:
In biological experiments, phenotype evaluation is a common challenge. In a wide variety of applications,
the phenotypic features of organisms have to be measured and statistically assessed. This is especially im-
portant as differences between wild-type and mutant or treated and untreated organisms are often very subtle.
Here, we propose a set of digital image transformations that implement preprocessing, feature extraction and
statistical analysis of image data that is typically generated in a biological experiment. Moreover we present
AgED - Analysis given Experimental Data, a software toolkit that facilitates the process of phenotypic feature
evaluation from digital image data in an automatized fashion. Suitable statistical analysis and visualization is
performed and controlled via a Graphical User Interface. Furthermore, the use of open data structures allows
for the convenient reuse of the acquired feature data with miscellaneous data-mining software and scientific
workflow systems. The functionality of this software tool is demonstrated and validated by repeating a phyto-
hormone response experiment carried out on the fresh water alga Coleochaete scutata. The results showed that
the timely and automatic processing of digital image data aides the researcher and rationalizes the formerly
lengthy and, at times, error prone data evaluation in spreadsheet documents. Furthermore, the software toolkit
AgED establishes a comparable evaluation standard and provides ready-to-publish graphic export facilities.
1 INTRODUCTION
Many biological experiments share a common setup.
A condition like a mutation or the exposition to stress
or a chemical or physical condition is assessed for
its effect on the phenotype of an organism. The re-
searcher often assumes that the condition alters the vi-
sual appearance of the organism under investigation.
Such an effect needs to be quantified and the observed
difference has to be statistically verified in order to
connect the phenotype to the altered condition. Dig-
ital images form the basic data source for this kind
of experimental setup. In the course of a biological
experiment hundreds or thousands of high resolution
images may be produced. Therefore, efficient and
parallel image processing is mandatory. Furthermore,
the publication of results requires graphic export fa-
cilities. Here, we introduce the software toolkit AgED
that enables a set of methods to quantify and evalu-
ate features from image data in an automatic fashion.
While the automatic evaluation of the image data in
our software is emphasized, the Graphical User Inter-
face (GUI) is designed to empower the user to review
the computation’s results and guide the data process-
ing at any given step. Thus, AgED provides an image
processing pipeline that allows for the answering of
the question, whether or not a condition influences a
phenotypic trait.
The usefulness of this software is demonstrated by
conducting a phytohormone response experiment in-
volving the fresh-water alga Coleochaete scutata. A
similar experiment has been carried out in the past
(Sprißler, 2007) thus, the obtained results can be com-
pared. The differences to conventional assessment
methods are described and the requirements and lim-
itations of the image source as well as the species un-
der consideration are pointed out.
The software relies on Elliptic Fourier Descriptors
(Kuhl and Giardina, 1982). In the biological con-
text Elliptic Fourier Descriptors (EFDs) have been ap-
proved for cell- and nuclear shapes (Diaz et al., 1989)
as well as for leaf-forms (Pryer and Heam, 2009).
324
Brandt J. and Heyl A..
AgED: Extraction and Evaluation of Elliptic Fourier Descriptors from Image Data in Phenotype Assessment Applications.
DOI: 10.5220/0004249903240327
In Proceedings of the International Conference on Bioinformatics Models, Methods and Algorithms (BIOINFORMATICS-2013), pages 324-327
ISBN: 978-989-8565-35-8
Copyright
c
2013 SCITEPRESS (Science and Technology Publications, Lda.)
They have been extensively used for assessing shapes
in plants (Chen and Nelson, 2004; Truong et al., 2005;
Yoshioka et al., 2006) as well as in animals (Laurie
et al., 1997; Costa et al., 2012).
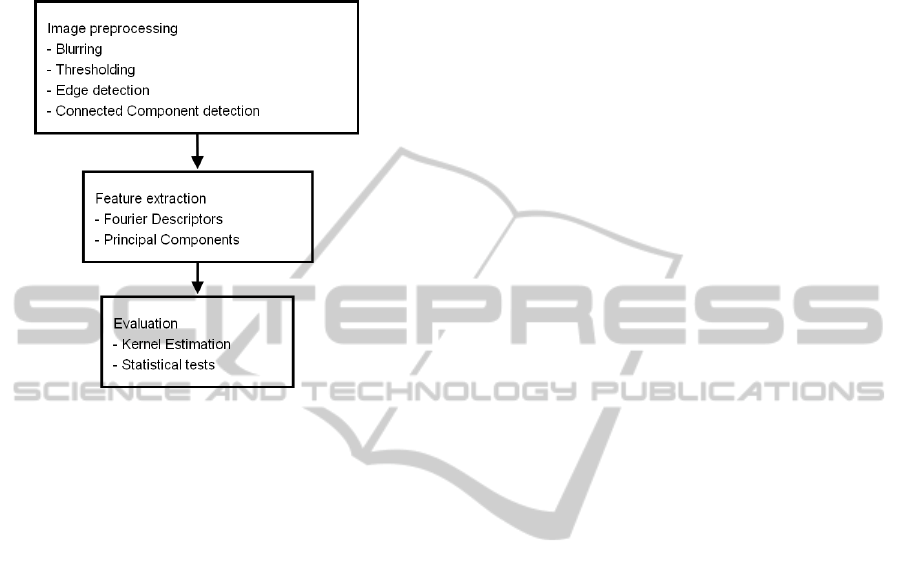
Figure 1: Image processing pipeline. The pipeline is dev-
ided in three major processing steps: In the preprocessing
step the raster image is transformed until only the shape out-
lines remain. In the feature extraction step Elliptic Fourier
Descriptors (EFDs) are calculated. Eventually the probabil-
ity densities are estimated in the evaluation step.
2 METHODS AND ALGORITHMS
In this section we present the algorithms that consti-
tute the image processing pipeline and the subsequent
statistical evaluation. This pipeline can be divided in
three larger blocks. Figure 1 depicts this workflow
and summarizes the tasks accomplished in each single
block. The general analysis is based on the EFD mag-
nitudes of all detected shapes in all available images.
Including the Principal Components Analysis (PCA),
the described pipeline consists of well established al-
gorithms that have proven useful to determine phe-
notype shape characteristics and have been applied
in previous software development efforts (Iwata and
Ukai, 2002). In an experimental setup where subtle
tendencies have to be detected from possibly thou-
sands of images, the comparison of probability den-
sities in favor of single realizations is required. This
functionality is provided in the evaluation step of the
pipeline. Here, we describe these processing steps in
detail.
Image Preprocessing. The main task of image pre-
processing is the distinguishing of the specimen’s
shape from the background of the image. First,
color information is disposed of resulting in a
black and white image. Optionally, the image is
scaled down by a factor to a size where it still
contains the important information but needs less
memory and can be processed faster. Further-
more, the image may be inverted, accounting for
the fact whether it is the background or the shapes
that appear bright in the image. Next, a low-pass
filter is applied in order to reduce noise and to
make the subsequent algorithms more stable. This
step too is optional. The optimal size of the filter
kernel depends in part on the scale-down factor
in the previous step. Thresholding is performed
subsequently (see Figure 2). For the study, pre-
sented here, we assume that a very small frac-
tion of shape information is outweighed by a large
fraction of background information. Hence, the
mean brightness of the whole image is very close
to the mean brightness of the background, which
is unknown in advance. The optimal threshold
is, therefore, defined as the standard deviation of
the brightness multiplied by a user defined factor.
Subsequently, edge detection is performed by ap-
plying a Sobel operator. Eventually, single shapes
are identified via Connected Component Labeling
(Samet and Tamminen, 1988).
Feature Extraction. From the labeled edge informa-
tion that results from image preprocessing, the
outlines of the shapes can be extracted (see Fig-
ure 3). Each outline is represented as a list of
complex numbers. From this list the set of EFDs
is calclulated (Kuhl and Giardina, 1982). These
are normalized which yields a scale- and rotation-
independent representation of the shapes under
consideration (Ferson et al., 1985). In addition
it is possible to perform a Principal Components
Analysis (PCA). If EFDs are linearly correlated, a
PCA may reveal a discriminating feature.
Statistical Evaluation. The EFDs and Principal
Components (PCs) taken together represent the
feature set to be assessed. An EFD or PC can
be viewed as a continuous random variable. Dif-
ferent methods are available for deriving a prob-
ability density function (PDF) for a random vari-
able. A type of probability distribution may be
assumed and the parameters for that distribution
may be estimated. A non-parametric approach
would be to estimate histograms. For AgED, how-
ever, we decided to apply the Kernel Density Es-
timation (KDE) method (Parzen, 1962), another
non-parametric approach.
AgED:ExtractionandEvaluationofEllipticFourierDescriptorsfromImageDatainPhenotypeAssessmentApplications
325
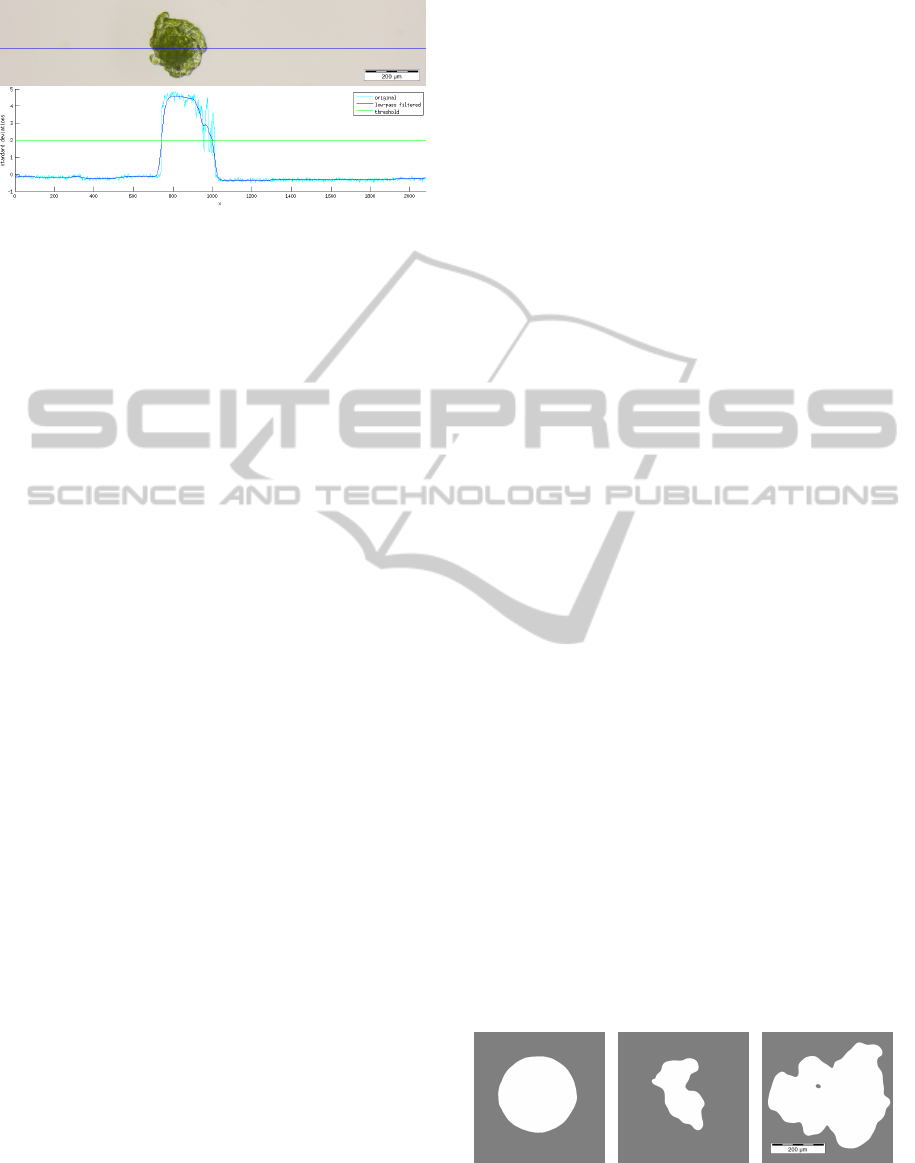
Figure 2: Cross section of a Coleochaete scutata thallus.
Top: Image part showing a single thallus. The blue line in-
dicates the location of the cross section. Bottom: The orig-
inal value (cyan), the low-pass filtered value (blue) and the
classification threshold (green). The Gaussian filter kernel
had a standard deviation of σ = 100 pixels. The abscissa
represents pixel length units while the ordinate is the value
in standard deviations.
3 RESULT VALIDATION
In this section we validate the results obtained
from the AgED software toolkit by comparing them
with results generated in a manual manner. We
chose to perform an experiment similar to one per-
formed by Sprißlser and collegues (Sprißler, 2007)
in which the effectiveness of the phytohormone 2,4-
Dichlorophenoxyacetic acid (2,4D) was tested. The
experiment founded on the observation that the alga
formed three different shape classes at different ra-
tios. These classes were (i) disc-shaped, (ii) partially
disc-shaped and (iii) unstructured. For the treated and
the control group all specimen where classified and
counted. A clear increase in the frequence of un-
structured thalli was observed for the group that was
treated with 2,4D in comparison to the control group.
Unfortunately, a direct repetition of the exper-
iment using EFDs cannot be accomplished. This
would require the unique translation of the verbal de-
scription of the shape classes into EFD ranges. Never-
theless, we can expect that a difference in shape class
frequency also leads to a difference in the EFD distri-
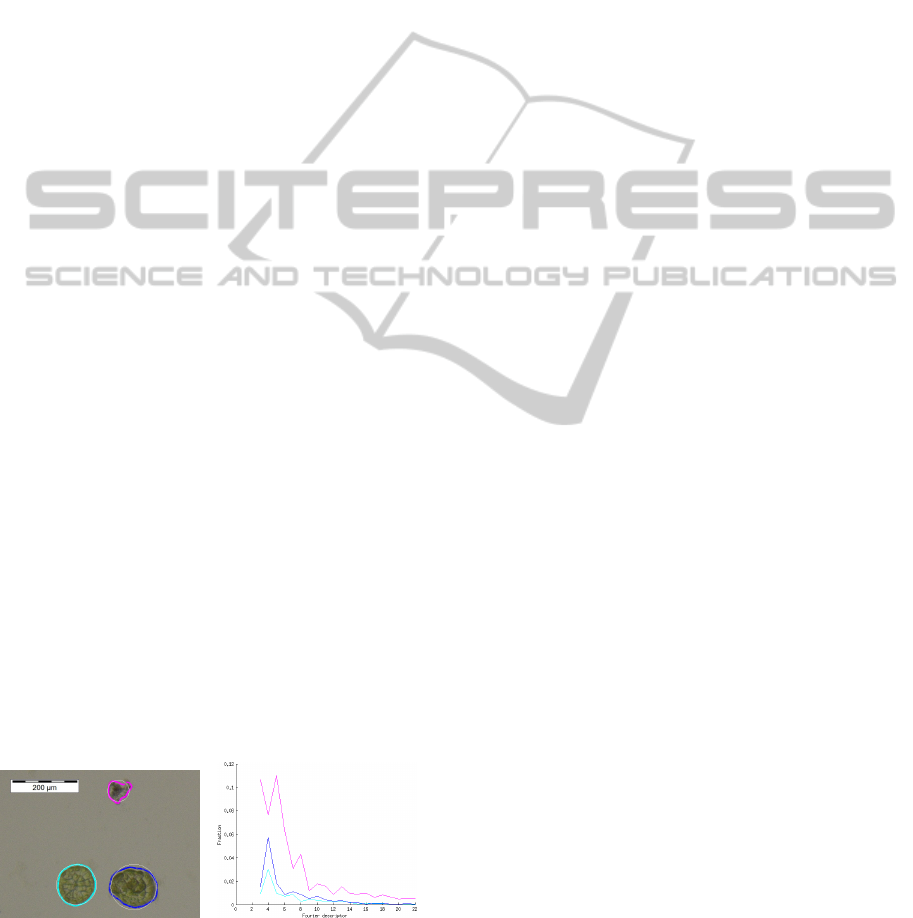
butions. Furthermore, from the definition of EFDs we
would expect an unstructured thallus to yield stronger
magnitudes in the higher frequencies of the spectrum
than a round one (see Figure 4). In this way we can
compare the results from the original experiment and
our repetition applying EFDs.
The comparison of EFD distributions for the 2,4D
treated group and the control group show that EFDs
reflect this chemical condition. Higher frequency
magnitudes were larger in tendency for 2,4D treated
thalli than for the control group. Thus, the phytohor-
mone effect can be effectively assessed automatically
using the AgED software toolkit.
It turned out that the input images that were con-
sidered in this experiment were particularly challeng-
ing in the way that: (i) Nonuniform illumination lev-
els between and in images, (ii) the presence of edges
and scratches associated to the carrier material of the
specimen (iii) short-comings of some optic devices
such as blur or poor magnification had to be dealt with
in a set of 600 images. Herein, the AgED software
proved robust againt the aforementioned difficulties.
However, some false positives had to be removed by
hand. This removing could easily be accomplished
via the GUI by unchecking the falsely identified thal-
lus shapes.
Other automatic image analysis approaches con-
cerned with Coleochaete scutata (Dupuy et al., 2010)
addressed its growth over time. The methods pre-
sented here, in contrast, identify general traits that can
be assessed one-shot and without the need to observe
specimen over time.
4 THE SOFTWARE TOOLKIT
The AgED software toolkit applies the described im-
age processing pipeline (see Section 2) to a set of la-
beled images. It requires the presence of a Java Vir-
tual Machine (JVM) and an installation of the Java
Advanced Imaging (JAI) library. It provides a Graph-
ical User Interface (GUI) that lets the user choose ap-
propriate parameters for the particular problem and
image collection at hand. The software, furthermore,
provides a way to organize the associated images, la-
bels, extracted shapes and visualized results. It gives
the user the possibility to take control over each step
in the processing. This way the user can verify any
given intermediate result in the pipeline and compen-
sate for the challenges his unique experimental setup
may pose. The so generated feature set can be stored
in an SQLite database instance that allows for the fur-
ther processing of the data in general purpose scien-
tific software or scientific workflow systems (Deel-
man et al., 2008).
Figure 3: Examples for thallus shapes extracted with the de-
lineated preprocessing scheme. The regularity of the shapes
was measured by calculating the Elliptic Fourier Descrip-
tors (EFD).
BIOINFORMATICS2013-InternationalConferenceonBioinformaticsModels,MethodsandAlgorithms
326
AgED provides three different views on the image
analysis pipeline: (i) The file system view lets the user
browse images in his file system. Furthermore, he can
label each image file with a class label. (ii) The shape
view allows for the inspection of each single shape
and associated EFDs that have been extracted from
the previously labeled image set. Note that one image
can contain several shapes. Also, the user can select
and deselect single shapes to be excluded from evalu-
ation. False positives and outliers can be removed this
way. (iii) In the evaluation view the probability den-
sities that have been calculated from the EFDs and its
Principal Components can be examined. In this view
the user can compare results and export the figures as
image files.
5 CONCLUSIONS
The results of this study showed that the automatic
and timely processing of high-resolution digital im-
age data for biological phenotype assessment appli-
cations is feasible. The AgED software toolkit fa-
cilitates and guides the preprocessing and allows the
browsing of the evaluation results. The applicabil-
ity of the AgED software tool has been exemplified
and validated on a real-world problem, that illustrates
some pitfalls diverse in severity. We have showed that
the AgED software deals effectively with these prob-
lems. While the presented image processing pipeline
readily scales to the automatic processing of a few
thousand images, the data evaluation step neverthe-
less demands some user interaction. We showed that
AgED reduces the time needed from the experimen-
tal setup to the deduction of the experiment’s result.
Furthermore, the extracted feature set as well as the
evaluation results are stored in a format that can be
adopted by other statistical software systems.
The software AgED can be downloaded from
http://sourceforge.net/projects/aged/. This repository
also comes with detailed instructions and examples.
Figure 4: Three thalli of Coleochaete scutata and their out-
lines (left). The according Fourier spectrum of these shapes
(right). The spectrum is displayed as fraction of the DC-
component. Irregular shapes convey larger magnitudes in
the Fourier spectrum than circular shapes.
REFERENCES
Chen, Y. and Nelson, R. L. (2004). Evaluation and Clas-
sification of Leaflet Shape and Size in Wild Soybean.
Crop Science, 44:671–677.
Costa, C., Antonucci, F., Boglione, C., Menesatti, P., Van-
deputte, M., and Chatain, B. (2012). Automated
sorting for size, sex, skeletal anomalies of cultured
seabass using external shape analysis. Aquacultural
Engineering.
Deelman, E., Gannon, D., Shields, M., and Taylor, I.
(2008). Workflows and e-Science: An Overview of
Workflow System Features and Capabilities. In Fu-
ture Generation Computer Systems. Elsevier.
Diaz, G., Zuccarelli, A., Pelligra, I., and Ghiani, A. (1989).
Elliptic Fourier Analysis of Cell and Nuclear Shapes.
Computers and Biomedical Research, 22:405–414.
Dupuy, L., Mackenzie, J., and Haseloff, J. (2010). Coordi-
nation of plant cell division and expansion in a simple
morphogenetic system. Proceedings of the National
Academy of Sciences, 107(6):2711–2716.
Ferson, S., Rohlf, F. J., and Koehn, R. K. (1985). Mea-
suring Shape Variation of Two-dimensional Outlines.
Systematic Biology, 34(1):59–68.
Iwata, H. and Ukai, Y. (2002). SHAPE: A Computer
Program Package for Quantitative Evaluation of Bio-
logical Shapes Based on Elliptic Fourier Descriptors.
Journal of Heredity, 93(5):384–385.
Kuhl, F. P. and Giardina, C. R. (1982). Elliptic Fourier Fea-
tures of a Closed Contour. Computer Graphics and
Image Processing, 18:236–258.
Laurie, C. C., True, J. R., Liu, J., and Mercer, J. M. (1997).
An Introgression Analysis of Quantitative Trait Loci
That Contribute to a Morphological Difference Be-
tween Drosophila simulans and D. mauritiana. Ge-
netics Society of America, 145:339–348.
Parzen, E. (1962). On Estimation of a Probability Density
Function and Mode. Annals of Mathematical Statis-
tics, 33(3):1065–1076.
Pryer, K. M. and Heam, D. J. (2009). Evolution of Leaf
Form in Marsileaceous Ferns: Ecidence for Hete-
rochrony. Evolution, pages 498–513.
Samet, H. and Tamminen, M. (1988). Efficient Component
Labeling of Images of Arbitrary Dimension Repre-
sented by Linear Bintrees. IEEE Transactions on Pat-
tern Analysis and Machine Intelligence, 10(4):579–
586.
Sprißler, N. (2007). Morphogenese von Coleochaete scu-
tata (Viridiplantae): Einfluss von Phytohormonen.
Dr. Burkhard Becker, Botanisches Institut, Universit
¨
at
K
¨
oln.
Truong, N. T., Gwag, J.-G., Park, Y.-J., and Lee, S.-H.
(2005). Genetic Diversity of Soybean Pod Shape
Based on Elliptic Fourier Descriptors. Korean Jour-
nal of Crop Science, 50(1):1–7.
Yoshioka, Y., Ohsawa, R., Iwata, H., Ninomiya, S., and
Fukuta, N. (2006). Quantitative Evaluation of Petal
Shape and Picotee Color Pattern in Lisianthus by Im-
age Analysis. Journal of the American Society for
Horticultural Science, 131(2):261–266.
AgED:ExtractionandEvaluationofEllipticFourierDescriptorsfromImageDatainPhenotypeAssessmentApplications
327
