
Multi-algorithm Respiratory Crackle Detection
João Quintas
1
, Guilherme Campos
2
and Alda Marques
3
1
Department of Geosciences, University of Aveiro, Campus Universitário de Santiago, Aveiro, Portugal
2
Institute of Electronics and Telematics Enginnering of Aveiro, University of Aveiro,
Campus Universitário de Santiago, Aveiro, Portugal
3
School of Health Sciences, Campus Universitário de Santiago, Aveiro, Portugal
Keywords: Adventitious Lung Sounds, Stethoscopy, Automatic Detection Algorithms, Annotation, Agreement,
Performance Metrics, Validation.
Abstract: Four crackle detection algorithms were implemented based on selected techniques proposed in the literature.
The algorithms were tested on a set of lung sounds and their performance was assessed in terms of
sensitivity (SE), accuracy (PPV) and their harmonic mean (F index). The reference annotation data for
calculating these indices were obtained through agreement by majority between independent annotations
made by three health professionals on the same set of lung sounds. Agreement by majority of the four
algorithms afforded more than 7% performance improvement over the best individual algorithm.
1 INTRODUCTION
Millions of people worldwide suffer from respiratory
pathologies, making it vitally important to develop
simple, reliable diagnosis techniques. Traditional
lung sound auscultation (stethoscopy) is non-
invasive and inexpensive, but obviously restricted to
the human audible frequency range and inherently
subjective. Because of these limitations, it must
often be complemented by medical radiography
means, which involve high levels of ionising
radiation and are incomparably more expensive.
In recent years, the progress in computing and
signal processing technologies has paved the way to
digital stethoscopy and automated analysis of lung
sounds. Research efforts have been directed to the
development of algorithms for automatic detection
and classification of the signal artefacts normally
regarded as lung condition symptoms, called
adventitious lung sounds (ALS).
Two main categories of ALS can be
distinguished: wheezes (continuous or stationary
sounds) and crackles (discontinuous or non-
stationary sounds) (Pasterkamp et al., 1997).
Wheezes have relatively long duration (over 100ms)
and pitch above 100 Hz. They can be monophonic or
polyphonic, depending on the number of frequency
components.
Crackles, whose automatic detection is the object
of this paper, can be described as explosive, short-
duration (<20ms) transient sounds, with a frequency
range normally between 100 and 2000 Hz,
occasionally even wider (Sovijärvi et al., 2000).
Their waveform is characterised by a steep initial
deflection and gradually more widely interspaced
peaks. Based on time-domain parameters such as the
two-cycle duration (2CD), initial deflection width
(IDW) and largest deflection width (LDW), crackles
are usually classified into two types: fine and coarse.
The development of computer algorithms for
crackle detection and classification systems is a
complex task for various reasons:
The energy ratio of crackles to normal
respiratory sound (‘signal-to-noise’ ratio) is
low; the resulting distortion of crackle
waveforms makes it difficult to work out
temporal parameters like IDW, 2CD or LDW.
The magnitude, duration and frequency content
of a crackle can vary widely.
Crackle waveforms may overlap.
To tackle this task, numerous signal processing
techniques have been proposed in the literature,
including digital filters (Ono et al., 1989),
spectrogram analysis (Kaisla et al., 1991), time-
domain analysis (Vannuccini et al., 1998), auto-
regressive models (Hadjileontiadis, 1996), wavelet
and wavelet-packet transform methods (Kahya et al.,
239
Quintas J., Campos G. and Marques A..
Multi-algorithm Respiratory Crackle Detection.
DOI: 10.5220/0004251002390244
In Proceedings of the International Conference on Health Informatics (HEALTHINF-2013), pages 239-244
ISBN: 978-989-8565-37-2
Copyright
c
2013 SCITEPRESS (Science and Technology Publications, Lda.)
2001); (Hadjileontiadis, 2005); (Lu and Bahoura,
2008), fuzzy filters (Mastorocostas et al., 2000),
empirical mode decomposition (EMD) (Charleston-
Villalobos et al., 2007); (Hadjileontiadis, 2007),
Hilbert transform (Li and Du, 2005) and fractal
dimension (FD) filtering (Hadjileontiadis and
Rekanos, 2003).
This paper explores the combination of multiple
algorithms to improve crackle detection. Following a
review on performance evaluation metrics and
methods (Section 2), including a description of the
annotated respiratory sound data repository used for
pilot testing, the algorithms and their individual
performance are briefly presented in Section 3.
Section 4 presents the rationale behind the
proposed multi-algorithm technique, its most
relevant details and the performance improvement
observed in pilot tests. Future work ideas are
discussed in the concluding section.
2 DETECTION PERFORMANCE
EVALUATION
Sensitivity (SE) and precision (also referred to as
positive predictive value - PPV) are the typical
performance indices of automatic crackle detection
algorithms (Fawcett, 2004).
Sensitivity is the ratio between correctly detected
(true positive – TP) crackles and the total number of
crackles, including undetected (false negative – FN):
(1)
Precision is the ratio between TP and the total
number of detections, including incorrect (false
positive – FP):
(2)
These parameters are normally expressed as
percentages. Since it is obviously desirable that both
be as high as possible, their mean value provides a
useful figure of merit. Various formulations can be
used; the harmonic mean (F index), a combination of
the arithmetic mean (A) and the geometric mean
(G), will be adopted here (Sheng, 2009):
(3)
Performance evaluation using the parameters just
defined implies the availability of gold standards.
The only way to obtain these is by human expert
annotation of a statistically significant set of
respiratory sound files. Given the inevitable
subjectivity of the annotation process, the gold
standard must result from the application of
statistical agreement criteria to multiple independent
annotations obtained for each file. So far, this work
front has received insufficient attention from
researchers. In the absence of publicly available
databases of annotated respiratory sound files, a
small repository for pilot testing was created using
ten 10-second respiratory sound files, five of them
from cystic fibrosis patients and the remainder from
pneumonia patients. Three health professionals
carried out independent annotations using a
specifically developed application (Dinis et al.,
2012). A simple script then generated a reference
annotation for each file, through agreement by
majority among the respective set of annotations.
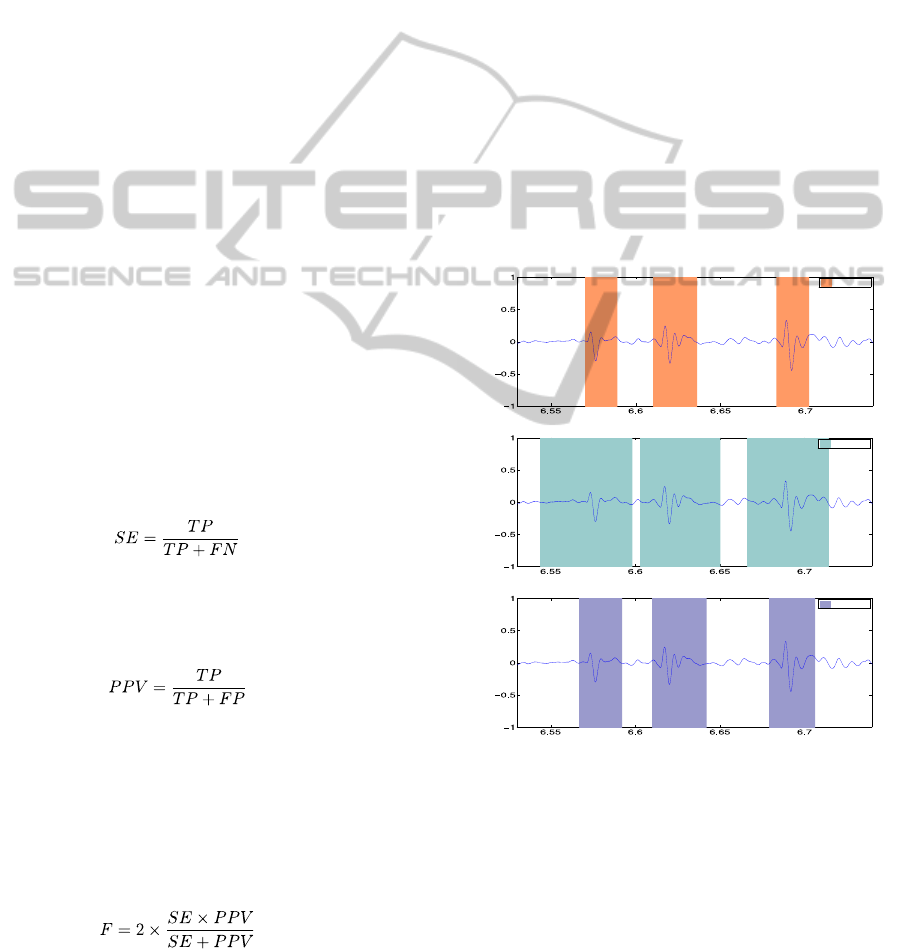
Figure 1 illustrates the annotation process;
crackle locations are specified as time intervals.
Figure 1: Example of (agreeing) crackle annotations by
three health professionals.
Clearly, only by chance will endpoints coincide
in different annotations, even when these agree. The
script generating reference annotations avoids this
difficulty by detecting the absolute peak value
location of each crackle and using it, rather than the
endpoints, to assess agreement. Figure 2 shows how
this peak coincidence criterion reveals total
agreement in the previous example.
HEALTHINF2013-InternationalConferenceonHealthInformatics
240
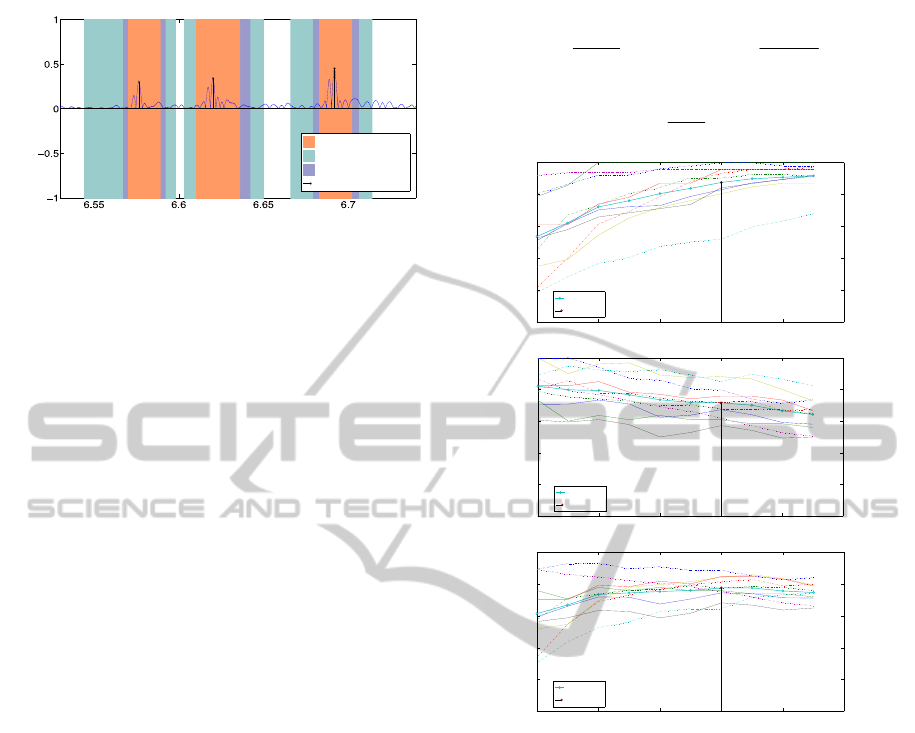
Figure 2: Annotations of Figure 1 overlaid to highlight
peak coincidence in spite of endpoint mismatch.
3 AUTOMATIC CRACKLE
DETECTION
The work presented here started by an exploration of
crackle detection techniques found in the literature,
which led to the implementation of four algorithms,
labelled A, B, C and D. The first (A) is an adaptation
of the time-domain waveform identification
approach of Vannuccini, Rossi et al. (1998).
Algorithm B essentially replicates the FD filtering
technique presented by Hadjileontiadis and Rekanos
(2003). The other algorithms (C and D) are also FD-
based, but incorporate variations, mainly inspired by
the work of Lu and Bahoura (2008).
In these algorithms, as usual, the sensitivity is
adjustable by means of numeric parameters akin to
detection thresholds. A high sensitivity (SE) is
obviously desirable, but as the FN count is
decreased, the FP count is likely to increase, which
may adversely affect precision (PPV). Therefore, the
goal in adjusting these algorithm parameters is to
optimise the compromise between SE and PPV,
which implies maximising the performance index
(F).
The useful range of each algorithm adjustment
parameter was established empirically by analysing,
on a very wide range, SE, PPV and F curves
obtained for sound files selected from the pilot
repository.
The performance of the four algorithms was then
exhaustively tested on the pilot repository. Every file
was annotated ten times by each algorithm, using a
set of ten parameter values uniformly spaced within
the corresponding useful range. This produced 400
annotations in total (100 per algorithm). Taking
algorithm A, for instance, Figure 3 shows the
resulting SE, PPV and F curves for each file, along
with the mean value curves across the repository,
calculated as follows (NS =10 being the number of
sound files in the repository):
S
N
i
i
N
SE
SE
S
1
S
N
i
i
N
PPV
PPV
S
1
(4)
S
N
i
i
N
F
F
S
1
(5)
1.5 2 2.5 3 3.5 4
0
20
40
60
80
100
T
SE (%)
Mean
Optimal T
1.5 2 2.5 3 3.5 4
0
20
40
60
80
100
T
PPV (%)
Mean
Optimal T
1.5 2 2.5 3 3.5 4
0
20
40
60
80
100
T
F (%)
Mean
Optimal T
Figure 3: SE, PPV and F curves for algorithm A.
In this instance, the useful range of the parameter
(T) was [1.5 3.75], and the average performance
across the repository is shown to be maximised for
T=3 (see Table 1). At this point, <SE>=87.5%,
<PPV>=71.6% and <F>=77.4%. Note that the
maximum performance of the algorithm for
individual files may occur for different values of the
parameter T, as shown in Table 2; obviously, an
average of the performance indices across these
points would result in higher values (respectively
88.2%, 75.5% and 80.5% in this case) than at the
optimal performance point.
Table 3 presents a summary of the average
performance indices obtained with the four
algorithms at their respective optimal performance
points.
Multi-algorithmRespiratoryCrackleDetection
241
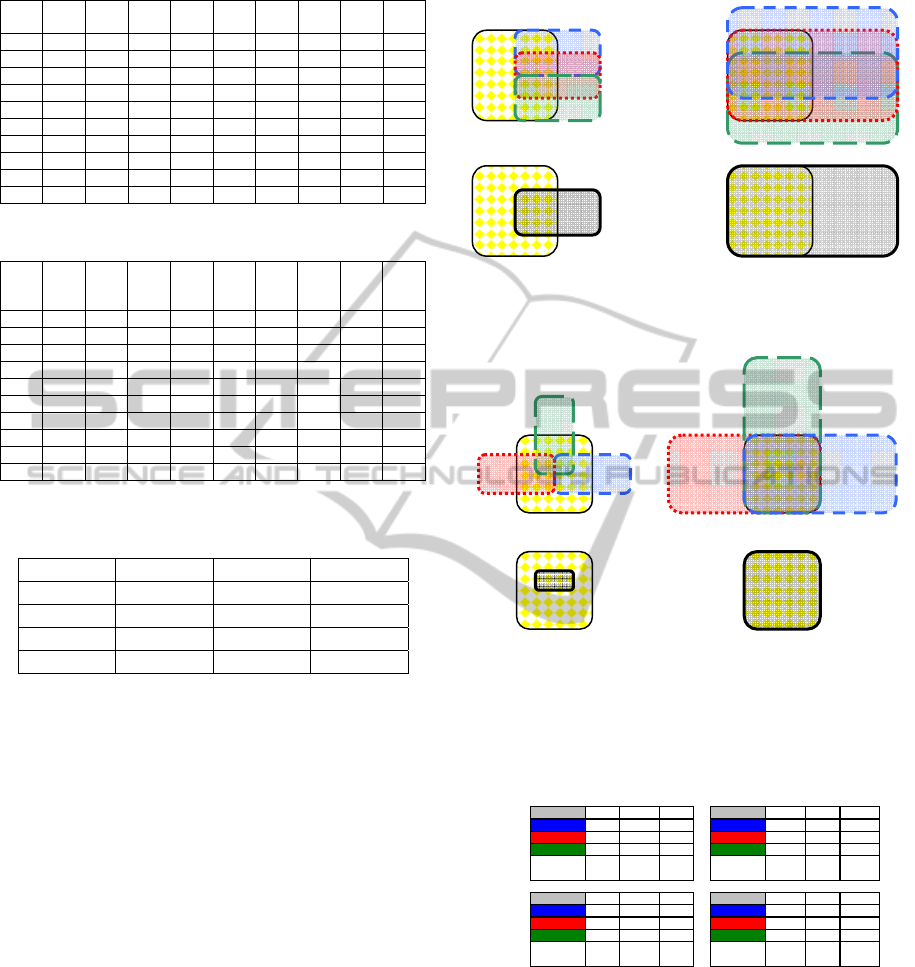
Table 1: Optimal performance results for Algorithm A.
File
True
count
T
Alg.
count
TP FP FN
SE
(%)
PPV
(%)
F
(%)
1 51 3 64 51 13 0 100 79.7 88.7
2 81 3 109 74 35 8 90.2 67.9 77.5
3 75 3 97 70 27 5 93.3 72.2 81.4
4 131 3 80 68 12 63 51.9 85 64.4
5 49 3 76 47 29 2 95.9 61.8 75.2
6 46 3 42 37 5 9 80.4 88.1 84.1
7 38 3 56 32 24 6 84.2 57.1 68.1
8 47 3 58 39 19 8 83.0 67.2 74.3
9 14 3 23 14 9 0 100 60.9 75.7
10 23 3 29 22 7 1 95.7 75.9 84.6
Table 2: Maximum performance points of Algorithm A.
File
True
count
T
Alg.
coun
t
TP FP FN
SE
(%)
PPV
(%)
F
(%)
1 51 2 50 47 3 4 92.2 94 93.1
2 81 2.75 108 76 32 8 90.5 70.4 79.2
3 75 3.25 99 72 27 3 96 72.7 82.8
4 131 3.75 108 89 19 42 67.9 82.4 74.5
5 49 1.5 52 45 7 4 91.8 86.5 89.1
6 46 3 42 37 5 9 80.4 88.1 84.1
7 38 3 56 32 24 6 84.2 57.1 68.1
8 47 3 58 39 19 8 83.0 67.2 74.3
9 14 3 23 14 9 0 100 60.9 75.7
10 23 3 29 22 7 1 95.7 75.9 84.6
Table 3: Optimal performance <SE>, <PPV> and <F>
indices.
Algorithm <SE> (%) <PPV> (%) <F> (%)
A 87,5 71,6 77,4
B 91,4 74,5 81
C 91,5 72,1 79,4
D 89,6 71,9 78,7
4 MULTI-ALGORITHM
AGREEMENT METHOD
4.1 Rationale
The new technique proposed here was inspired by
the method of generating gold standards from health
professional annotations, discussed in Section 2. The
idea is to apply exactly the same procedure and
statistical agreement criteria to combine annotations
generated by the chosen computer algorithms.
The idealised diagrams of Figures 4 and 5
illustrate the concept of agreement by majority and
the basic factors influencing its performance
(sensitivity adjustment and algorithm similarity).
The central square in the diagrams represents the
gold standard annotation; the overlapping rectangles
on the upper diagrams represent the annotations of
three different algorithms. The corresponding multi-
algorithm agreement annotations are represented on
the lower diagrams. The performance indices are
worked out in Table 4 for each situation.
Figure 4: Majority agreement (below) between three
strongly correlated algorithms (above) at low (left) and
high (right) sensitivity levels.
Figure 5: Majority agreement (below) between three
weakly correlated algorithms (above) at low (left) and
high (right) sensitivity levels.
Table 4: Performance indices for the agreement scenarios
of Figures 4 and 5.
SE PPV F SE PPV F
A 25,0% 50,0% 33,3% A 75,0% 37,5% 50,0%
B 25,0% 50,0% 33,3% B 100,0% 50,0% 66,7%
C 25,0% 50,0% 33,3% C 75,0% 37,5% 50,0%
majority
{A, B, C}
25,0% 50,0% 33,3%
majority
{A, B, C}
100,0% 50,0% 66,7%
SE PPV F SE PPV F
A' 25,0% 50,0% 33,3% A' 100,0% 50,0% 66,7%
B' 25,0% 50,0% 33,3% B' 100,0% 50,0% 66,7%
C' 25,0% 50,0% 33,3% C' 100,0% 50,0% 66,7%
majority
{A', B', C'}
12,5% 100,0% 22,2%
majority
{A', B', C'}
100% 100% 100,0%
low sensitivity settings high sensitivity settings
strong
algorithm
correlation
weak
algorithm
correlation
Note how the agreement performance benefits
from high sensitivity settings; in the low sensitivity
scenario, there is no improvement (there is even a
deterioration in the example with weakly correlated
algorithms). Dissimilar (weakly correlated)
algorithms are also desirable, as their individual FP
counts tend to cancel out, but this only produces
benefits if the sensitivity levels are enough to ensure
significant intersection between the TP counts.
A’B’
C’
A
B
C
HEALTHINF2013-InternationalConferenceonHealthInformatics
242

4.2 Procedures and Results
The individual algorithm performance tests,
described in Section 3, involved 400 annotations.
Implementing and testing the proposed multi-
algorithm majority agreement method took the
following additional steps:
1. Obtaining four-algorithm agreement annotations
for every possible parameter combination. With
10 parameter values per algorithm, this yielded
10
4
annotations for each sound file (10
5
in total).
In spite of their high number, the computational
cost of these annotations was relatively low, since
they could be derived from the original 400 using
a simple agreement script, with no need for
additional detection algorithm runs.
2. Calculating the SE, PPV and F indices for each
of the 10
5
annotations and the corresponding
averages across the repository: <SE>, <PPV> and
<F>. To facilitate 3D-chart visualisation (see
Figure 6), the parameters of algorithms A and B
were represented on the xx axis and those of
algorithms C and D on the yy axis, their sequence
being arranged so that only one varied between
consecutive array elements along axial directions.
The average values <SE>, <PPV> and <F> were
stored in three 100-by-100 arrays organised
accordingly.
3. Determining the point of optimal performance
i.e. of peak average index <F> – see Table 5.
Figure 6: <F> curve using multi-algorithm agreement.
Table 5: Optimal multi-algorithm performance results.
Parameter settings: 3.5(A), 0.024(B), 0.84(C) and 0.66(D).
File
True
count
Alg.
count
TP FP FN
SE
(%)
PPV
(%)
F
(%)
1 51 58 51 7 0 100 88.0 93.6
2 81 83 71 12 10 87.7 85.5 86.6
3 75 89 70 19 5 93.3 78.7 85.4
4 131 107 102 5 29 77.9 95.3 85.7
5 49 56 49 7 0 100 87.5 93.3
6 46 43 39 4 7 84.8 90.7 87.6
7 38 51 34 17 4 89.5 66.7 76.4
8 47 54 42 12 5 89.4 77.8 83.2
9 14 21 14 7 0 100 66.7 80
10 23 21 21 0 2 91.3 100 95.5
Average - - - - - 91.4 83.7 86.7
The average indices at the optimal performance
point (<SE>=91.4%, <PPV>=83.7% and
<F>=86.7%, as shown in Table 5) should be
compared to those of the four algorithms considered
individually, shown in Table 3. While multi-
algorithm sensitivity is on a par with the best
individual algorithm results, precision is about 11%
higher, resulting in a 7% performance improvement
over the best individual algorithm (B), as measured
by <F> (86.7% vs. 81%).
It is worth noting that this optimal multi-
algorithm performance point does not correspond to
the optimal parameter settings of each individual
algorithm, which are 3 for algorithm A, 0.024 for B,
0.75 for C and 0.75 for D. The average performance
with these settings would be only 84.5%.
5 DISCUSSION AND FUTURE
WORK
Replicating the algorithms proposed in the literature
poses serious difficulties, mainly due to lack of
public access to sound file and reference annotation
data used for validation tests. The creation of an
open Web platform to stimulate the development
and sharing of respiratory sound and annotation
repositories, annotation tools, gold standards,
agreement metrics and criteria, as well as detection
algorithms, is essential to advance research in this
area.
While relative performances followed the
expected trend, with FD-based algorithms
outperforming the time-domain approach of
algorithm A, the performance indices of the
algorithms implemented were generally below the
published claims for those in which they were based.
The characteristics of the repository used here
(longer files, more varied pathologies…) may
partially explain this difference, but the main factor
is probably the use of gold standards obtained
through multi-annotation using a majority agreement
criterion, which is likely to attenuate annotation bias.
The multi-algorithm agreement technique
proposed here clearly deserves further investigation,
as the initial test results – a 7% improvement over
the performance of the best individual algorithm
involved – are extremely encouraging. The previous
considerations on the absolute performance of the
individual algorithms do not weaken this conclusion.
Moreover, the algorithms were not chosen to suit
this technique; in view of the considerations
presented in Section 4.1, its potential is likely to be
Multi-algorithmRespiratoryCrackleDetection
243

underexplored, due to the similarity between
algorithms B, C and D.
The most immediate task in this project is to
carry out more sophisticated performance evaluation
tests, by using separate training and test sets and
using a larger and more diverse annotated sound file
repository, if possible. This is essential to reach
statistically solid conclusions.
It is also important to refine the detection
algorithms already considered, explore others
proposed in the literature (preferably very dissimilar,
such as EMD) and investigate their individual and
combined performance.
Other future work threads include the
contribution of each algorithm to multi-algorithm
performance, alternative agreement criteria and
computational efficiency analysis.
ACKNOWLEDGEMENTS
This work was supported in part by FCT (Fundação
para a Ciência e Tecnologia) under Grant
PTDC/SAU-BEB/101943/2008.
REFERENCES
Charleston-Villalobos, S., R. González-Camarena, et al.
(2007). "Crackle sounds analysis by empirical mode
decomposition. Nonlinear and nonstationary signal
analysis for distinction of crackles in lung sounds."
Engineering in Medicine and Biology Magazine, IEEE
26(1): 40-47.
Dinis, J., G. Campos, et al. (2012). "Respiratory Sound
Annotation Software." , BIOSTEC 2012.
Fawcett, T. (2004). "ROC graphs: Notes and practical
considerations for researchers." Machine Learning.
Hadjileontiadis, L. (1996). "Nonlinear separation of
crackles and squawks from vesicular sounds using
third-order statistics." Medicine and Biology Society
5: 2217-2219.
Hadjileontiadis, L. J. (2005). "Wavelet-based
enhancement of lung and bowel sounds using fractal
dimension thresholding-part I: methodology."
Biomedical Engineering, IEEE Transactions on 52(6):
1143-1148.
Hadjileontiadis, L. J. (2007). "Empirical mode
decomposition and fractal dimension filter. A novel
technique for denoising explosive lung sounds."
Engineering in Medicine and Biology Magazine, IEEE
26(1): 30-39.
Hadjileontiadis, L. J. and T. Rekanos (2003). "Detection
of Explosive Lung and Bowel Sounds by Means of
Fractal Dimension." IEEE Transactions on Biomedical
Engineering 47: 1-4.
Kahya, Y. P., S. Yerer, et al. (2001). A wavelet-based
instrument for detection of crackles in pulmonary
sounds. Engineering in Medicine and Biology Society,
2001. Proceedings of the 23rd Annual International
Conference of the IEEE. 4: 3175-3178.
Kaisla, T., A. Sovijarvi, et al. (1991). "Validated method
for automatic detection of lung sound crackles."
Medical & biological engineering & computing 29(5):
517-521.
Li, Z. and M. Du (2005). "HHT based lung sound crackle
detection and classification." 385- 388.
Lu, X. and M. Bahoura (2008). "An integrated automated
system for crackles extraction and classification."
Biomedical Signal Processing and Control: 1-11.
Mastorocostas, P. A., Y. A. Tolias, et al. (2000). "An
orthogonal least squares-based fuzzy filter for real-
time analysis of lung sounds." IEEE transactions on
bio-medical engineering 47(9): 1165-1176.
Ono, M., K. Arakawa, et al. (1989). "Separation of fine
crackles from vesicular sounds by a nonlinear digital
filter." IEEE transactions on bio-medical engineering
36(2): 286-291.
Pasterkamp, H., Steve S. Kraman, et al. (1997).
"Respiratory Sounds . Advances Beyond the
Stethoscope." American Journal of Respiratory and
Critical Care Medicine 156(3): 974.
Sheng, D. (2009). Feature Selection Based F-Score and
ACO Algorithm in Support Vector Machine.
Knowledge Acquisition and Modeling, 2009. KAM
'09. Second International Symposium on.
Sovijärvi, A. R. A., Dalmasso F, Sacco C, Rossi M and
Earis J E (2000). "Characteristics of breath sounds and
adventitious respiratory sounds." European
Respiratory Review 10(77)
: 591-596.
Vannuccini, L., M. Rossi, et al. (1998). "A new method to
detect crackles in respiratory sounds." Technology and
health care: official journal of the European Society
for Engineering and Medicine 6(1): 75-79.
HEALTHINF2013-InternationalConferenceonHealthInformatics
244
