
A Novel and Low Cost Acoustic based Probe for Local Pulse Wave
Velocity Estimation
Experimental Characterization and in-Vivo Feasibility
H. C. Pereira
1,2
, J. Maldonado
3
, T. Pereira
4
, M. Contente
1
,
V. Almeida
1
, T. Pereira
1
, J. B. Simões
2,1
,
J. Cardoso
1
and C. Correia
1
1
Instrumentation Centre (CI-GEI), Physics Department, University of Coimbra, Coimbra, Portugal
2
ISA- Intelligent Sensing Anywhere, Coimbra, Portugal
3
Instituto de Investigação e Formação Cardiovascular, Aveleira, Penacova, Portugal
4
Escola Superior de Tecnologia da Saúde de Coimbra, S.Martinho do Bispo, Coimbra, Portugal
Keywords: Local Pulse Wave Velocity, Double Headed Probe, Microphones, Test Bench Systems, in-Vivo
Measurements.
Abstract: The use of local pulse wave velocity (PWV) as an independent risk factor for cardiovascular events and as a
marker of atherosclerosis has been gained clinical relevance over the years. A novel acoustic double headed
probe for non-invasive measurement of the local PWV is presented in this paper. The PWV is assessed in
one single location and involves the determination of time delay between the signals acquired
simultaneously by two acoustic sensors, placed ≈11 mm apart. Several tests were performed in special
purposes test bench systems in order to characterize the acoustic probe (AP) regarding the existence of
crosstalk between the transducers, repeatability, waveform analysis and also its time resolution. Results
demonstrate the effectiveness of the AP in acquiring repeatedly the same waveform, with the possibility to
measure higher PWV (14 m/s), with a relative error less than 5%, when using two uncoupled APs. In-vivo
acquisitions were also carried out with the AP in the carotid artery of 17 healthy volunteers with the
intention of local PWV and other hemodynamic parameters estimation, such as left ventricular ejection time
(LVET). For the total of subjects’ sample, the obtained mean carotid PWV was 2.96±1.08 m/s and the
LVET mean value was 288.59±21.42 ms.
1 INTRODUCTION
Over the last years, great emphasis has been placed
on the role of arterial wall stiffening in the
development of cardiovascular diseases and events.
Aortic stiffness which results from the progressive
degeneration of the wall’s elastic fibres is generally
associated with ageing and some pathophysiological
conditions, such as hypertension, end-stage renal
disease and diabetes (Laurent et al., 2001, Shoji et
al., 2001). Currently, arterial stiffness is included in
in the guidelines of the European Society of
Cardiology and European Society of Hypertension
as an independent predictor of cardiovascular
mortality and morbidity and as a new parameter of
target organ damage that must be considered in
cardiovascular risk stratification (Mancia et al.,
2007). The most simple, non-invasive and robust
method to assess arterial stiffness is pulse wave
velocity (PWV), i.e., the velocity at which the
pressure wave, generated by ventricular contraction
propagates along an artery (Pannier, 2002). Carotid-
Femoral PWV is considered the gold standard
measurement of arterial stiffness, being supported by
several clinical studies that highlight the relevant
contribution of PWV to the diagnosis, prognosis and
follow-up of the general population/patient
(Maldonado et al., 2011, Meaume et al., 2001). The
most prominent commercial devices require
low/moderate technical expertise; however they
present several drawbacks in PWV assessment. The
practical solution used by these systems relies on the
acquisition of pulse waves at the carotid and femoral
arteries, to determine the time delay measured
between pressure upstroke at each site. The distance
78
Pereira H., Maldonado J., Pereira T., Contente M., Almeida V., Pereira T., Simões J., Cardoso J. and Correia C..
A Novel and Low Cost Acoustic based Probe for Local Pulse Wave Velocity Estimation - Experimental Characterization and in-Vivo Feasibility.
DOI: 10.5220/0004251900780088
In Proceedings of the International Conference on Biomedical Electronics and Devices (BIODEVICES-2013), pages 78-88
ISBN: 978-989-8565-34-1
Copyright
c
2013 SCITEPRESS (Science and Technology Publications, Lda.)
between the two acquisition locations is usually
measured using a tape and then PWV is determined
using the linear ratio between distance and time
delay (Boutouyrie et al., 2009). Nevertheless, this
method not only negligence opposite wave
propagation but also presents errors in estimating the
distance between the recording locations (for
example, the curvature of the arteries cannot be
taken into account) (Segers et al., 2009). On the
other hand, it introduces a rough estimate of local
properties of the artery, since it integrates the
different segments of arterial stiffness (carotid,
aorta, iliac, femoral), being unable to differentiate
between muscular and elastic segments. The
possibility to assess to the local hemodynamics is in
fact very useful, particularly in the carotid artery due
to its predisposition to atherosclerotic plaques
formation and its significance in the development of
cerebrovascular diseases (Laurent et al., 2006).
Variables such as the local PWV, arterial
distensibility, cross-sectional compliance or Young’s
modulus assess the local intrinsic properties of the
arterial wall itself, being more related the
biomechanical properties of the artery (Gamble et
al., 1994). Although local PWV has already been
used as an independent risk factor for cardiovascular
events such as coronary disease and stroke and as a
marker for cardiovascular disease including
atherosclerosis (Gaszner et al., 2012, Laurent et al.,
2003), at the present moment there is no gold
standard to the assessment of local PWV. In the past
few years, several methods have been investigated
with the intention of local PWV assessment. The
generalized methods require simultaneous
measurements of pressure, velocity or diameter at
the same site (Rabben et al. 2004, Borlotti et al.,
2012), while the most recent studies show that this
hemodynamic parameter can also be obtained using
the time delay calculated between the piezoelectric
elements of an ultrasound probe, placed at a fixed
distance (Hermeling et al., 2007). In all the methods,
the assessment to the local variables require
burdensome or specialized imaging technologies
(ultrasound and echo tracking techniques), limiting
the use to clinical practice.
The present work intends to present, characterize
and validate an efficient and low-cost tool based on
a non-invasive device that is placed over the carotid
artery and can be easily handled in diagnostic trials
by an operator. Based on a previous work, where a
double headed piezoelectric probe was developed
and characterized in laboratory (Pereira et al., 2010
and 2011), it was developed a simpler and novel
system for local PWV estimation and other
parameters extraction, such as left ventricular
ejection time (LVET). The device is based on a
double configuration of two acoustic sensors that are
placed at a fixed distance, d, allowing simultaneous
acquisition of two (sound) pulse waves. The
measurement of time delay between the waves, t,
allows local PWV to be determined, simply, as:
t
d
smPWV
)/(
(1)
2 MATERIALS
2.1 The Double Headed Acoustic Probe
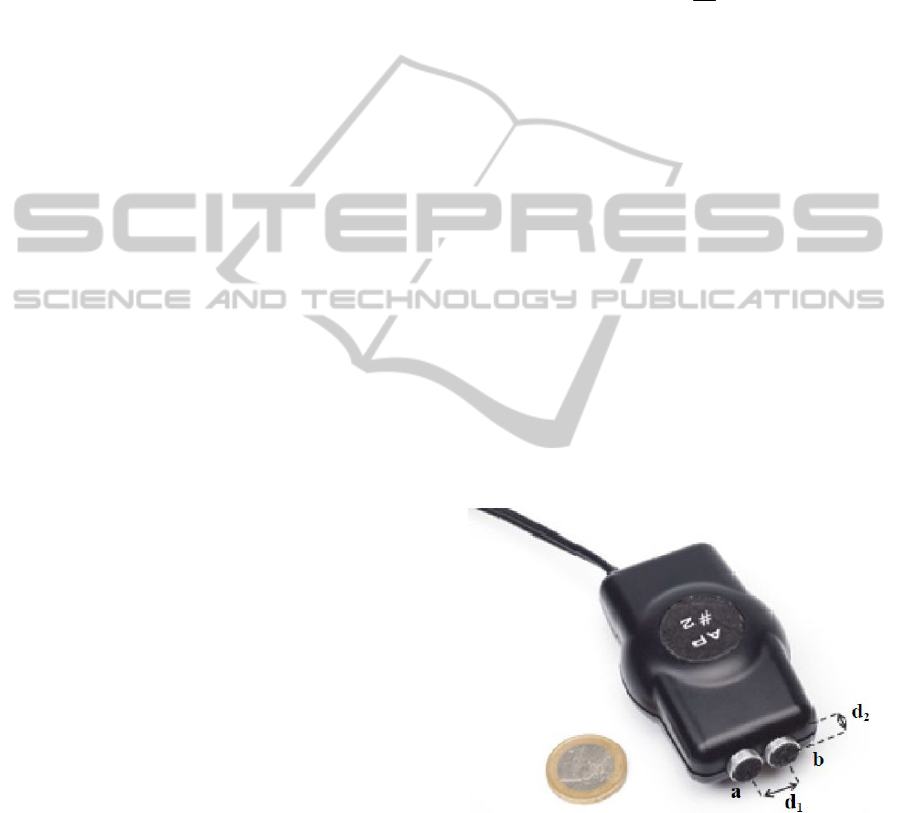
The developed probe, presented in figure 1, consists
of two acoustic transducers (Pro-Signal, ABM-712-
RC, microphone-solder pad) that are placed
approximately 11mm apart and fixed at the top of a
plastic box (Multicomp, 77 mm x 49 mm x 26.6
mm). The transducers, based on 9.7 mm diameter
electret condenser microphones with an operating
frequency of 100Hz to 10 kHz and noise cancelling
directivity, are placed at the minimum separating
distance, while avoiding mechanical contact. These
elements form an ergonomic configuration that
allows a safe and effective way of collecting the
pulse wave on the carotid artery for both the patient
and the operator.
Figure 1: Representation of the double headed probe. a-
Microphone 1; b- Microphone 2; d1-distance between
transducers centres: 11mm; d2- sensors height: 2mm.
The probe does not include any type of signal
conditioning circuit, so the acoustic signals are
acquired directly by a Personal Computer (PC)
Sound Card. The AP uses parallel audio cable to
convey the information obtained directly from the
transducers, to the microphone input of the PC
ANovelandLowCostAcousticbasedProbeforLocalPulseWaveVelocityEstimation-ExperimentalCharacterization
andin-VivoFeasibility
79
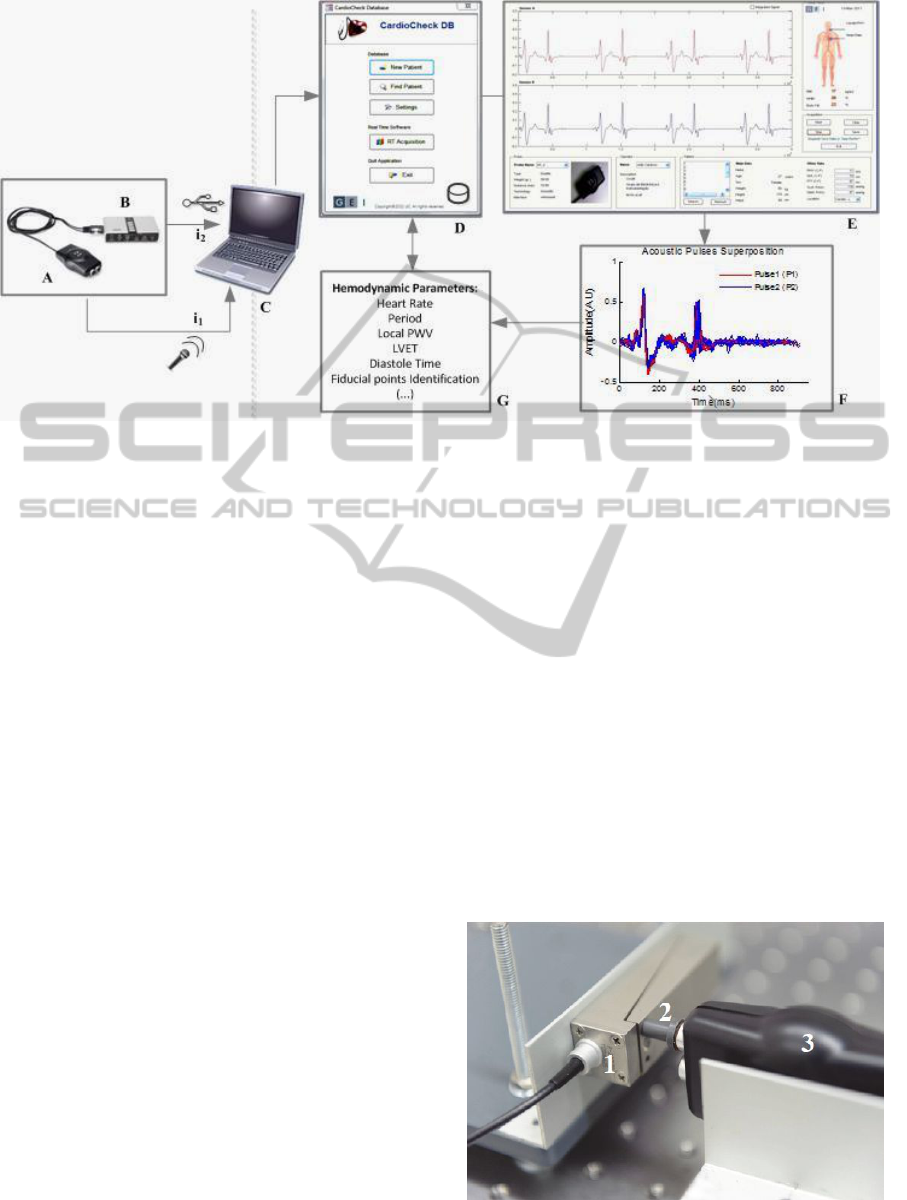
Figure 2: Schematic representation of the overall system used in in-vivo measurements. A- Acoustic Probe; B- External
USB Sound Card; C-PC; D- Cardiocheck DB; E- Cardiocheck GUI; F-Data Pre-processing; G- Hemodynamic Parameters
Extraction.
Sound Card. In circumstances in which the PC
Sound Card does not have stereo input, the probe
connects first to an external Sound Card (7.1
Sweex® USB Sound Card, 16-bit, 48 kHz
Maximum Sampling Rate, 90 dB Signal to Noise
Ratio) that then delivers the collected signals to the
PC, via USB. The data acquisitions are displayed in
real time, through a dedicated Matlab® Based
Graphical User Interface (Cardiocheck GUI) and
automatically stored in a non-commercial Microsoft
Access® based database (Cardiocheck DB). The
data is subsequently processed using different
algorithms (detailed in section 3.3) that aim the
extraction of several hemodynamic parameters,
namely the PWV and the LVET (figure 2).
2.2 Test Setups
For characterizing the AP, as well as the various
parameters extraction algorithms, it was developed
two special purpose sets of test bench systems. The
test setup I was designed to evaluate the ability of
the probe in reproducing repeatedly different types
of waveforms but also to evaluate the existence of
crosstalk between both transducers. The setup uses a
700 µm stroke actuator, ACT, driven by a high
voltage linear amplifier, HVA (Physik Intrumente
GmbH P-287 and E-508, respectively) to generate a
pressure wave that is fed to the acoustic probe by
means of a “mushroom” shaped PVC interface
(figure 3). This PVC interface (10 mm diameter),
coupled to the ACT, is in mechanical contact with
the transducer, without affecting the output voltage
since the sensors does not respond to DC excitation.
With this mechanical adapter it is possible to
transmit the ACT’s motion associated to the pressure
wave, in such a way that the longitudinal forces are
responsible for the transducer electric response. The
waveforms are programmed and downloaded into an
arbitrary waveform generator, AWG, Agilent
33220A that delivers the signal that is generated by
the ACT and also the synchronism that triggers the
data acquisition system, DAS (National
Instruments®, USB6210). Although the AP is a
prototype suitable for clinical tests, designed to be
combined with a PC Sound Card, it was necessary to
use a different DAS in test bench experiments, in
order to acquire additional reference signals.
Figure 3: Representation of the mechanical structure of the
test setup I. 1-ACT. 2- PVC interface. 3- AP.
BIODEVICES2013-InternationalConferenceonBiomedicalElectronicsandDevices
80
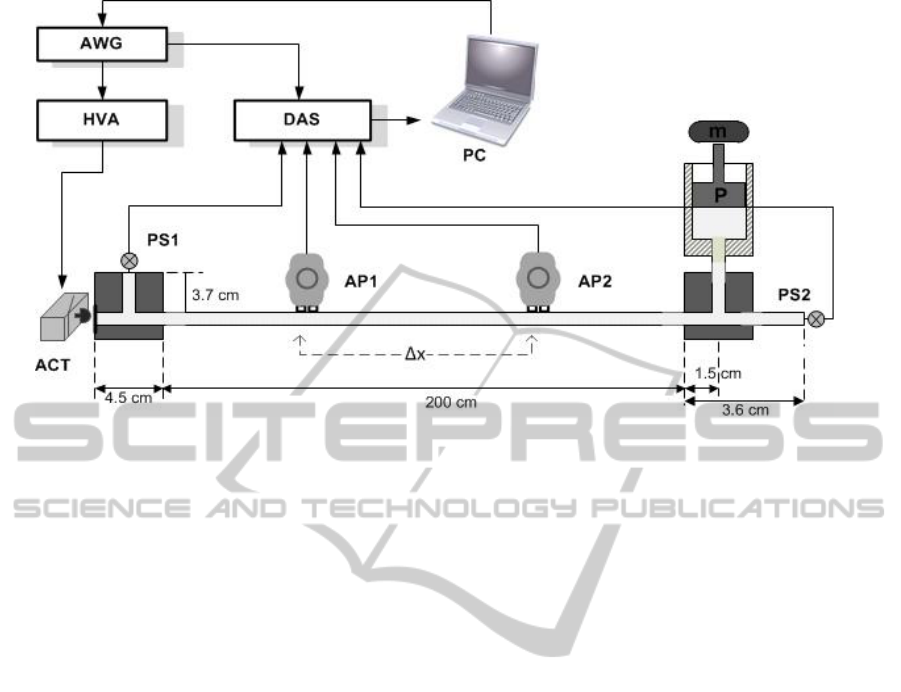
Figure 4: Schematic representation of the test setup II.
The test bench system II, schematically
presented in figure 4, was developed aiming the
assessment of the temporal resolution of the AP.
This test bench emulates the main arterial
pressure wave propagation features of the
cardiovascular system, presenting an upgrade in
relation to the experimental setup developed
previously by Pereira et al. (Pereira et al., 2009). The
main difference is based on the use of a natural
rubber latex tube, considered to be a reliable
material to simulate the compliance of a human
artery and providing a higher distensibility than the
silicon tube originally used. As in the test bench I,
the pressure waveform is firstly generated using the
AWG and then delivered to the ACT/HVA, that
through a piston (“mushroom” shaped PVC, 15 mm
diameter) - rubber membrane mechanism launches
the wave into a 200 cm long latex tube (Primeline
Industries, 7.9 mm inner diameter, 0.8 mm wall
thickness), filled with water. The tube’s sealing is
made using a T-shaped scheme, guaranteeing
geometric homogeneity. The wave is captured by the
AP placed along the tube and by two pressure
sensors PS1 and PS2 (Honeywell, 40PC015G1A),
placed transversely and longitudinally to the tube.
These sensors are used as the main reference for
time delay/pulse wave velocity assessment but also
monitor the DC pressure level of the tube, imposed
by a piston P and a mass m at one of the tube’s
extremities. The range of DC pressure levels in the
tube varies, approximately, from 30 mmHg to 400
mmHg, including (and exceeding) the pressure
variations registered in a healthy and non-healthy
human system. Although the variation in the DC
pressure level interferes with the wave propagation
velocity, the AP was tested at a constant DC
pressure (≈ 66 mmHg), since it was not crucial for
the present work having several wave propagation
velocities.
To record simultaneously the different sensors
response it was used the aforementioned DAS,
triggered by the AWG.
3 METHODS
3.1 Experimental Characterization
The experimental characterization of the AP
consisted in the evaluation of its performance
regarding three main aspects: repeatability in
assessing pressure waveform, occurrence of
crosstalk phenomenon and estimation of time
resolution. Several pressure waveforms were
programmed and used as inputs in these studies,
including Gaussian-like and Cardiac-like pulses.
The last ones, synthesized using a weighted
combination of exponentially shaped sub-pulses
(Almeida et al., 2009), reproduce different states of
arterial wall elasticity: type A and type B,
correspond respectively to cases of pronounced and
slight arterial stiffness (non-healthy subjects) and
type C, commonly seen in healthy individuals,
characterize elastic arteries (Murgo et al., 1980).
In all the experiments, the data acquisition was
performed through a dedicated acquisition module
of National Instruments (NI© USB6210) and data
ANovelandLowCostAcousticbasedProbeforLocalPulseWaveVelocityEstimation-ExperimentalCharacterization
andin-VivoFeasibility
81

logging was accomplished by NI LabView™ 2010
SignalExpress. All the signals were sampled at 5
kHz and stored for offline analysis using Matlab®.
Data processing was undertaken in Matlab® 2009a
and statistical analysis was performed using
Microsoft Excel 2010.
3.1.1 Waveform Analysis/Repeatability
The first part of this study aimed to examine the
probe’s response for different types of waveforms
generated by the Agilent 33220A and exerted by the
ACT. To obtain the best response of the transducer it
was selected for each input signal, the best
amplitude (3.5V) and frequency (1Hz). All the
sensors signals were submitted to a 300 Hz low pass
filter and to a band cut filter of 49Hz-51Hz, in order
to avoid, respectively, the presence of the resonant
frequency of the actuator ( ~ 380Hz ± 20%) and the
50Hz power line interference. It was also performed
an integration of the transducer signals using the
Matlab® function cumsum to compare them with
the original input signals.
In the second part, it was intended to measure
the same waveform repeatedly and under the same
conditions by the AP. For this study, each sensor
was excited with fifty independent impulses (with
the same amplitude and width (Gaussian, 1 s width,
1Hz frequency). With those signals, it was
determined the average signal which was used as
reference to determine the root mean square error
(RMSE), for each one. The RMSE was then
computed to each signal.
3.1.2 Crosstalk Analysis
Since the two transducers composing the AP were
incorporated in the same case with a very small
separating distance, it was important to analyse
whether some kind of interaction between them
existed. The first part of this study was done
simultaneously with the repeatability test, where one
of the acoustic transducers was being actuated
(microphone 1) and the other one was left free
(microphone 2), that is to say without any contact
with the PVC adapter/ACT (figure 3). The responses
of both transducers for fifty independent impulses
(Gaussian, 1 s width, 1 Hz frequency) were recorded
and the average signals were estimated. This
procedure was then applied to the other sensing
element, such that the actuated transducer was
microphone 2 and the free transducer was
microphone 1.
The actuated transducers generated a typical
differential signal with a good signal-to-noise ratio,
while the free transducers generated a much lower
amplitude signal, with a profile substantially
opposite to that obtained for the actuated transducers
(see results section 4.1). Due to the characteristics of
the signal obtained for the free transducers, it was
necessary to perform an additional experiment to
determine whether this transmission might interfere
with one of the most important aspects of the probe:
its time delay assessment. Thus, the second test
consisted in the direct and simultaneous actuation of
both transducers, with the purpose of time delay
assessment. Both sensors were excited with three
independent impulses (Gaussian, 1 s width, 1Hz
frequency) and for each acquisition it was
determined the time delay between both transducers,
using different algorithms yet to be described on
subsection 3.3. In this particular experiment, the
signals were sampled at 12.5 kHz, the same
sampling frequency used in in-vivo tests.
3.1.3 Time Resolution Evaluation
One of the main goals of the AP characterization
was the evaluation of its ability of precisely
assessing the time delay between two distinct points,
separated from a very small distance.
In order to evaluate its time resolution, it was
used two different APs (AP1 and AP2) that were
placed on the tube of the test bench II, with the help
of two external clamps (figure 4). One of the probes
was kept fixed at the 50 cm position, while the other
one was moving from 100 cm position to 54 cm
position by 2 cm intervals. For each position, a
Gaussian waveform (100 ms width, 10 Hz
frequency) was delivered to the system, and then
time delay and PWV were estimated between the
first microphones of both probes and also between
the pressure sensors (PS1 and PS2), attached at the
extremities of the tube.
The relative errors between the reference PWV
and the PWV obtained with the uncoupled
transducers for each separating distance (x) were
calculated, using the algorithms of section 3.3. The
test was repeated for more two times, for a constant
DC pressure of ≈ 66 mmHg.
3.2 In Vivo Measurements
3.2.1 Participants and Study Protocol
Seventeen young volunteers aged 22.12 ±1.96 years
were recruited and gave written informed consent
prior to recording. Each participant was properly
weighed and measured and after 5m of rest of supine
BIODEVICES2013-InternationalConferenceonBiomedicalElectronicsandDevices
82

position, a blood pressure measurement was
obtained from his right brachial artery, using an
automatic clinically validated sphygmomanometer
(MAM Colson BP 3AA1-2 ®; Colson, Paris).
Next, a straight arterial segment of the right common
carotid artery was identified by a skilled operator
and a record of approximately 20s-30s was obtained
with the probe longitudinally aligned to the artery.
Data acquisition was performed with the dedicated
real-time software Cardiocheck GUI and
automatically stored in the Cardiocheck DB. Age,
sex, weight, height, waist, systolic blood pressure
(SBP) and diastolic blood pressure (DBP) were also
stored in the same database.
All the signals were acquired at a sample rate of
12.5 kHz and were processed offline in Matlab
2009a®, aiming the extraction of carotid pulse wave
velocity and other hemodynamic parameters.
3.3 Signal Processing
In the first part of this work (experimental
characterization), a set of dedicated algorithms have
been developed aiming the estimation of time delay
in two main situations: between the signals of the
AP transducers and between the signals of pressure
sensors (test setup II). After a common pre-
processing, based on a low-pass filter with a cut-off
frequency of 100 Hz to reduce high frequency noise,
four different methods were used for time delay
estimation: a) maximum of cross-correlation
function, b) maximum and c) minimum amplitude
identification and d) zero-crossing detection. The
cross correlation method uses the xcorr function of
Matlab’s Signal Processing Toolbox to determine
the peak of cross-correlogram that allows delay
estimation by subtracting the peak time position
from the pulse length. The other methods ensure an
accurate detection of some fiducial points of the
signal, such as the maximum, the minimum and the
zero. As so, the methods of maximum and minimum
amplitude identification use a 6th polynomial fit in
the maximum and the minimum region of the
signals, while the zero-crossing method applies a
linear fit to the region where the signal crosses the
zero. For all the methods, time delay is estimated
between the maxima, minima and zero points
detected in each set of signals.
In the last part of this work, the AP was used to
assess PWV and other hemodynamic parameters in
human carotid arteries. Since the acquisitions were
constituted by several cardiac cycles, it was
necessary to apply a dedicated segmentation routine,
based on a minima detection approach to divide the
data stream into single periods. Before applying the
segmentation algorithm, the signals were filtered
with the aforementioned 100 Hz low pass-filter and
then heart rate was determined. For each cardiac
cycle, the maximum of cross-correlation was used
for carotid PWV estimation and an average value
was obtained. Besides PWV, it was also possible to
determine hemodynamic parameters, such as:
LVET, defined as the period of time from the start of
the pulse (aortic valve open) to the dicrotic notch
(closure of the aortic valve) and diastole phase (DP),
defined as the period of time from the dicrotic notch
to the end of the pulse. These parameters were
extracted based on the conviction that the onsets of
the first and second carotid sounds (S1 and S2)
coincide respectively with the onset and with the
dicrotic notch of the carotid pulse waveform
(Hasegawa et al., 1991). The onsets of carotid
sounds S1 and S2 were identified as the maxima of
the second time derivative of the acoustic signal.
LVET and DP were calculated for each cardiac
cycle. Data were expressed as mean ± SD.
4 RESULTS AND DISCUSSION
4.1 Experimental Characterization
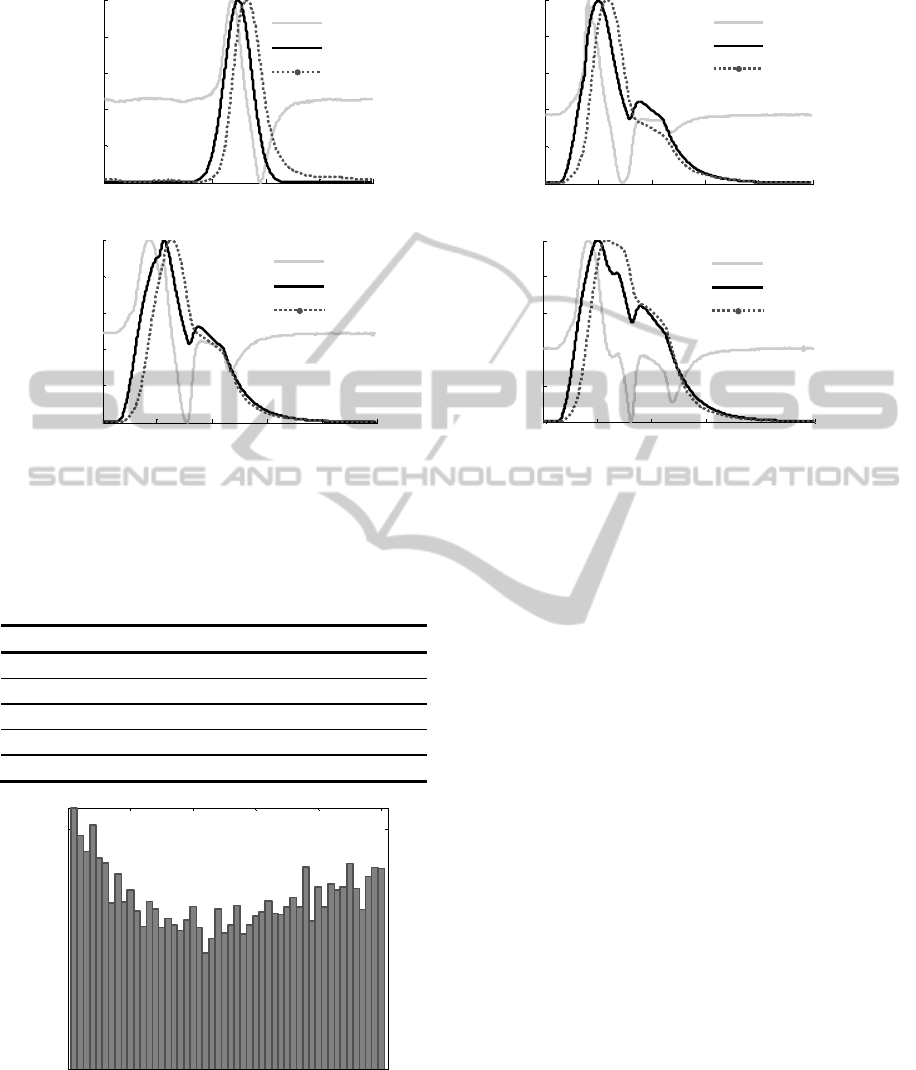
The first part of probe’s experimental
characterization consisted in the evaluation of the
AP output to different waveforms and its
repeatability. The response obtained by the AP for
each one of the waveforms is presented in figure 5.
The AP profiles are similar to those expected by a
differentiator circuit; however it is not possible to
precisely recover the original pressure waveform.
When the acoustic signals are integrated there are
noticeable similarities with the input signals,
however the RMSE between both signals is quite
high (approximately 13% for each case). This
performance was predictable, since the sensitivity of
the acoustic sensors must be reduced for low
frequencies that are below the microphone’s 3dB
bandwidth (100 Hz-10 kHz). Since low frequencies
are determinant for the precise reconstruction of
arterial pressure waveform, the use of these acoustic
sensors limits the possibility of the AP for waveform
estimation purposes. Nevertheless, this fact does not
disqualify the use of this probe for its main purpose:
PWV estimation, once the method does not depend
on the waveform accuracy.
The results regarding the repeatability test are
shown in table 1 and figure 6.
ANovelandLowCostAcousticbasedProbeforLocalPulseWaveVelocityEstimation-ExperimentalCharacterization
andin-VivoFeasibility
83
(a) (b)
(c)
(d)
Figure 5: Acoustic sensor responses to different excitation pressure waveforms. (a) Gaussian-like Pulse. (b) Type A
Cardiac-like Pulse. (c) Type B Cardiac-like Pulse. (d) Type C Cardiac-like Pulse. AP- Acoustic Sensor Signal. ACT- Input
Signal. INT- Integrated Sensor Signal.
Table 1: Statistics of the measurements obtained in the
repeatability test.
Transducer Mic 1 Mic 2
Nº Acquisitions 50 50
Mean (%) 1.1781 0.6198
Std. Deviation (%) 0.0345 0.0298
Maximum (%) 1.2849 0.7379
Minimum (%) 1.1174 0.5890
Figure 6: Graphic representation of the RMSE distribution
between the reference signal and the microphone 2 output,
obtained in the repeatability test.
Although the microphone 2 (0.6198±0.0298)
exhibits a better performance than the microphone 1
(1.1781±0.0345), the RMSE variance values
obtained for both probes are identically low,
evidencing the reliability of the system.
The second part of the AP’s characterization
intended to study the presence or absence of
crosstalk effect in both transducers. The first results
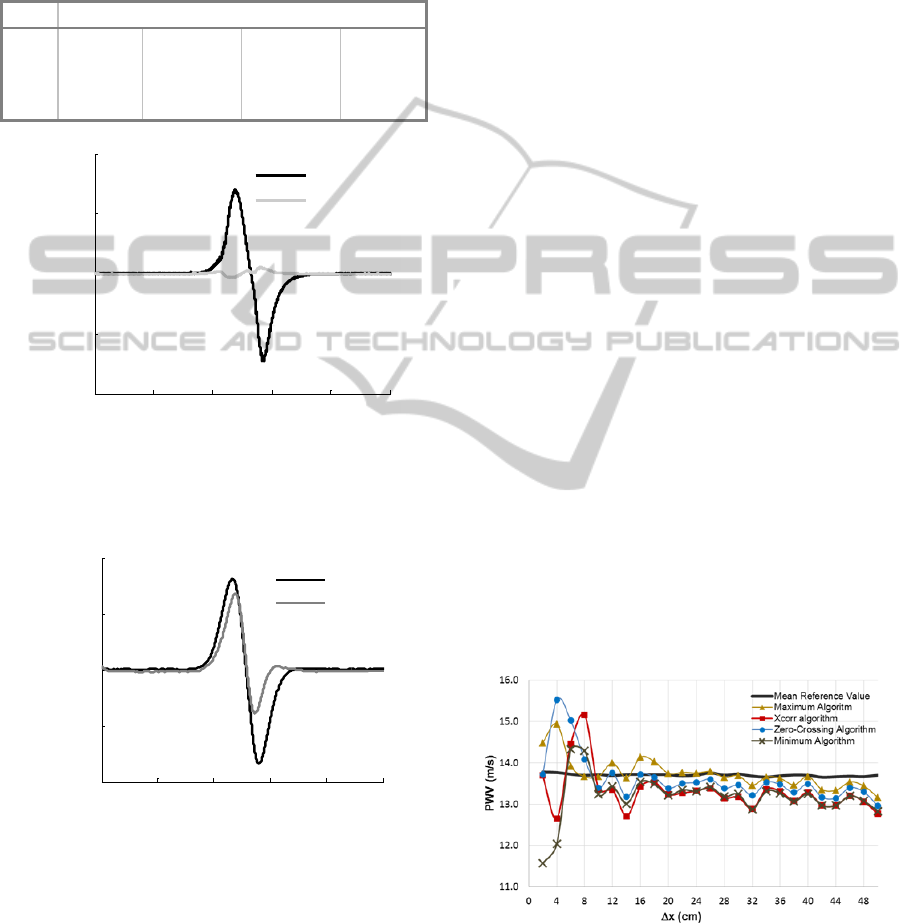
achieved in this study are illustrated in figure 7. The
actuated sensors present a good signal-to-noise ratio
and a typical profile when compared with the one
obtained previously in the waveform analysis test
(figure (5 (a)).
The free transducers also present a slight profile
but of much lower amplitude. Although the results
suggest the existence of crosstalk effect, this
phenomenon was seen as a mass inertial effect
(transducer resistance to conserve its idle state),
since the profile of the free transducer had an
inversed shape relatively to the actuated one. This
assumption could not be proven in the present work
but it will be aim of futures studies. Nevertheless,
and since the main purpose of this probe is the
assessment of local PWV, it was employed a
different approach, in order to determine if this
“transmission” might interfere with the AP’s time
delay. For this purpose, both transducers were
simultaneously actuated with three independent
0 0.2 0.4 0.6 0.8 1
0
0.2
0.4
0.6
0.8
1
Time
(
s
)
Normalized Amplitude (V)
AP
ACT
INT
0 0.2 0.4 0.6 0.8 1
0
0.2
0.4
0.6
0.8
1
Time
(
s
)
Normalized Amplitude (V)
AP
ACT
INT
0 0.2 0.4 0.6 0.8 1
0
0.2
0.4
0.6
0.8
1
Time(s)
Normalized Amplitude (V)
AP
ACT
INT
0 0.2 0.4 0.6 0.8 1
0
0.2
0.4
0.6
0.8
1
Time
(
s
)
Normalized Amplitude (V)
AP
ACT
INT
0 10 20 30 40 50
10
0
10
0.1
Acquisition (N)
RMSE (dB)
BIODEVICES2013-InternationalConferenceonBiomedicalElectronicsandDevices
84
Gaussian waves and time delay was calculated using
different algorithms. The results regarding this
experiment are presented in table 2 and figure 8.
Table 2: Time delay values obtained for each algorithm
when both transducers are simultaneously actuated with
three independent Gaussian impulses.
N
Time Delay Estimation Method
xcor
r
max min zc
1
8e-5
0.0134 0.0136 0.0037
2
8e-5 0.0109 0.0142 0.0038
3
8e-5 0.0103 0.0140 0.0035
Figure 7: Crosstalk phenomenon study: average response
of both AP’s transducers to fifty independent pulses. The
actuated transducer is microphone 2 and the free
transducer is microphone 1.
Figure 8: Crosstalk phenomenon study: typical response of
both AP’S transducers to a Gaussian pulse, simultaneously
delivered to them.
The time delay obtained for each one of the
algorithms is very different and actually surprising.
It was not expected to obtain such a variable and
elevated time delay values for maximum, minimum
and zero crossing algorithms. In contrast, the cross-
correlation algorithm presented a great performance,
where time delay always matched the minimum
detectable time, limited by the system, i.e.:, the
sampling time (1/12500Hz). In order to understand
the achieved results, the AP’s response was also
analysed (figure 8). It is visible that the profiles
obtained for each one of the transducers are
identical; however, they present important
differences in terms of amplitude and peaks
correspondence. It was expected that the maxima
and the minima of both signals were in agreement,
but actually that didn’t happen. These slight profiles
difference can be justified with the experiment level
of difficulty. It is extremely important that the
simultaneous actuation of both transducers is made
rigorously under the same conditions; otherwise the
waveforms of each transducer can be affected. This
also suggests that time delay algorithms that depend
only on a fiducial point are more susceptible to
error, especially if the waveforms don’t have exactly
the same profile. Finally and in what concerns to
crosstalk effect, it can be concluded that the
existence of a possible transmission between sensors
does not affect the time delay, when the cross-
correlation algorithm is used. In order to prove the
effectiveness of the other algorithms, it will be
necessary to proceed to additional experiments.
The last test concerning AP’s experimental
characterization intended to evaluate its time
resolution. In this test, it was determined the PWV
for two uncoupled AP’s in successively smaller
separation distances and the PWV reference
obtained using the pressure sensors PS1 and PS2.
The PWV results obtained for each algorithm and
the relative errors between the reference PWV and
the PWV obtained with the uncoupled transducers,
for each separating distance and method are
presented, respectively, in figures 9 and 10.
Figure 9: Time Resolution study: PWV values of
uncoupled acoustic sensors and pressure sensors, yielded
by the four algorithms. Each point is an average of three
trials.
The statistics of the measurements are
synthesized in table 3.
0 0.2 0.4 0.6 0.8 1
-0.1
-0.05
0
0.05
0.1
Time
(
s
)
Amplitude (V)
Actuated
Free
0 0.2 0.4 0.6 0.8 1
-0.02
-0.01
0
0.01
0.02
Time(s)
Amplitude (V)
Mic a
Mic b
ANovelandLowCostAcousticbasedProbeforLocalPulseWaveVelocityEstimation-ExperimentalCharacterization
andin-VivoFeasibility
85
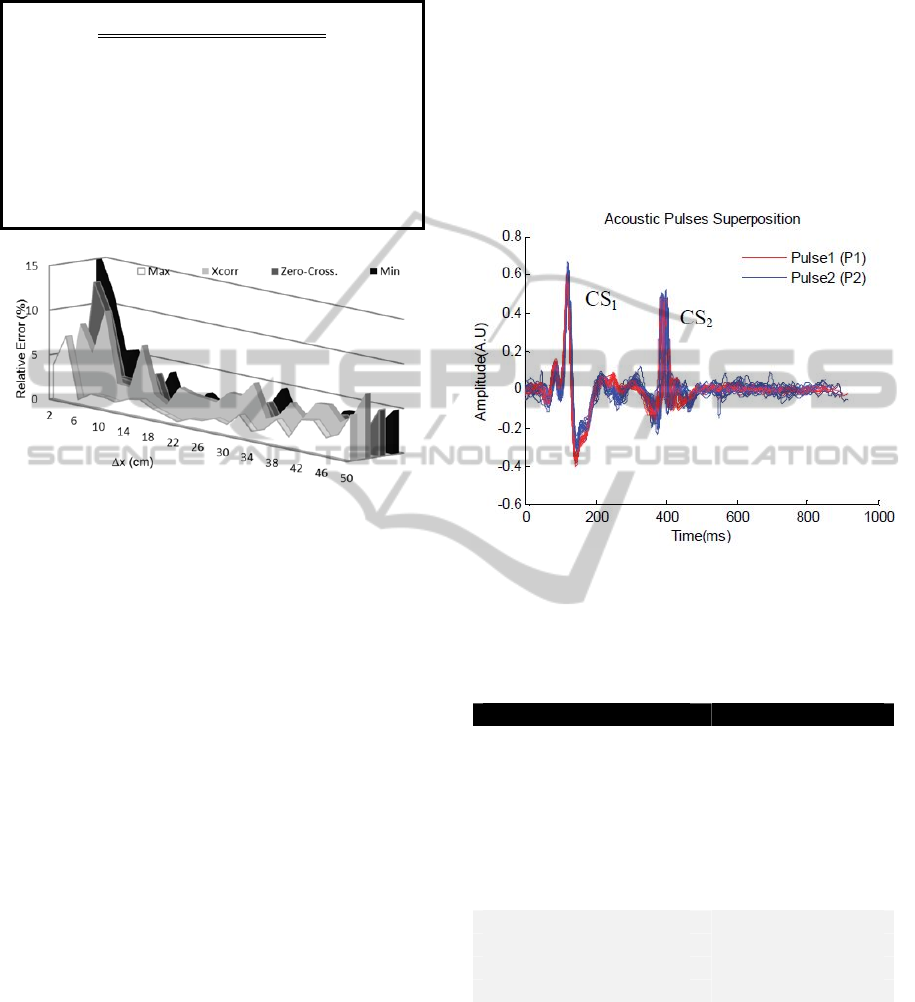
Table 3: Statistics of the measurements obtained in the
time resolution test.
Algorithm
PWV(m/s)
Relative
Error
Mean (%)
Pressure
Sensors
(reference)
Acoustic
Sensors
Maximum
13.856±0.037 13.742±0.372 2.083
Xcorr
13.716±0.037 13.308 ±0.524 4.246
ZC
13.702±0.034 13.592 ±0.560 2.863
Min
13.540±0.039 13.176±0.547 3.550
Figure 10: Time Resolution study: relative errors for each
distance and method.
The algorithms with the best and worst general
performance are the maximum and the cross-
correlation with an average error less than 3% and
5%, respectively. However, and for the minimum
distance achieved (2 cm) the magnitude of the errors
is less than 1%, when considering cross-correlation
and zero-crossing algorithms.
The results obtained for AP time resolution for
each algorithm, exhibit a very good performance
suggesting that the AP have enough accuracy to be
considered an interesting stand-alone instrument for
local PWV assessment.
4.2 In-vivo Measurements
Following the preliminary tests of the probe in the
test benches, it was performed a set of measurements
in human carotid arteries, in order to test the AP in
in-vivo conditions (figure 11). The characteristics of
the patients, as also the results of the parameters
assessed by the AP, (heart rate, local PWV, LVET
and DP) are given in table 4.
In order to assess pulse wave velocity, it was
only used the cross-correlation algorithm, since it
has presented the best performance both on crosstalk
and on time resolution studies. The range of
obtained values for carotid PWV are slightly lower
than the values obtained by other reference studies
that also assess the carotid PWV (≈ 4 m/s) ( Borlotti
et al., 2012 and Hermeling et. al., 2006). However,
the number of analysed subjects not only is small as
also include very young people (22.12±1.96 years),
which can justify a lower PWV mean (≈3 m/s), due
to the high elasticity of young and healthier arteries.
Although the obtained PWV variance is high (
N=17, ≈ 1 m/s), it is concordant with the PWV
variance obtained in a recent study for a significant
number of healthier subjects (N=1774, ≈ 1.64 m/s ) (
Borlotti et al., 2012).
Figure 11: Preliminary results of the AP acquiring data in
a healthy young subject. CS
1
- First Carotid Sound. CS
2
-
Second Carotid Sound.
Table 4: Main characteristics of the volunteers and AP
parameters assessment.
Variable Mean ± SD
Age, years 22.12 ±1.96
N(Male/Female) 17(6/11)
Height, cm 166.82±11.73
Weight, Kg 66.18±18.87
BMI, Kg/m
2
23.50±4.94
Waist, cm 75.35±14.85
Brachial SBP, mmHg 114.35±12.62
Brachial DBP, mmHg 70.94±7.11
Heart Rate, bpm 67±12.09
Local PWV(m/s) 2.96±1.08
LVET (ms) 288.59±21.42
DP (ms) 611.07±148.84
Nevertheless and in order to address more
accurate results, it will be necessary to assess to a
higher number of subjects, not only with a broader
range of ages but also with pathologies, such as
hypertension or atherosclerosis, where is expected to
observe an increase of local PWV. The use of a
reference method is also indispensable to validate
the developed algorithms for AP hemodynamic
BIODEVICES2013-InternationalConferenceonBiomedicalElectronicsandDevices
86

parameters extraction. Currently, the probe
presented a good performance in acquiring signals
with a good bandwidth and signal- to-noise ratio in
human carotid arteries, allowing the application of
various algorithms that extract clinically relevant
information.
Regarding the LVET values, we believe that is
actually possible to determine this parameter as the
time delay between the main onsets of each carotid
sounds, since the estimated values are generally
close to the expected for healthy subjects (Willems
et. al., 1970). This parameter will be the subject of a
further study, to evaluate the robustness of the
algorithm.
5 CONCLUSIONS
A novel and low-cost doubled headed probe
specifically designed to assess local PWV has been
developed and characterized in dedicated test setups.
The probe demonstrated good performance on
the dedicated test setups and results showed that its
signals are repeatable and crosstalk effect do not
interfere with its time resolution when the cross-
correlation algorithm for time delay estimation is
used.
It is also possible to conclude favourably towards
the effectiveness of the AP in the measurement of
local PWV. The maximum amplitude and the cross
correlation algorithms exhibited the capability of
measuring higher PWV (≈ 14m/s) with an error less
than 10%, for the several separating distances (50
cm to 2 cm).
The natural follow-up of this work will be the
continuation of the assessment of local PWV and
other hemodynamic parameters in a significant
numbers of patients (normal and with different
pathologies), under medical control. The obtained
AP values must also be compared with the values
obtained with standard commercial systems.
Although studies to validate the clinical use of
AP are still required, this device seems to be a valid
alternative system, to local PWV stand-alone
devices.
ACKNOWLEDGEMENTS
The authors acknowledge Fundação para a Ciência e
Tecnologia for funding SFRH/BDE/15669/2007 and
PTDC/SAU-BEB/100650/2008, project developed
under the initiative of QREN, funding by
UE/FEDER, through COMPETE - Programa
Operacional Factores de Competitividade. The
authors also thank to the company ISA-Intelligent
Sensing Anywhere and the medical collaboration of
Instituto de Investigação e Formação
Cardiovascular, Clínica da Aveleira and Escola
Superior de Tecnologia da Saúde de Coimbra.
REFERENCES
Almeida, V., Pereira, T., Borges, E., Figueiras, E.,
Cardoso, J., Correia, C., Pereira, H. C., Malaquias, J.
L. and Simões, J. B. 2009. Synthesized cardiac
waveform in the evaluation of augmentation index
algorithms. In Proceedings of BIOSIGNALS 2010,
Valencia, Spain.
Borlotti, A., Khir, A. W., Rietzschel, E. R., De Buyzere,
M. L., Vermeersch, S. & Segers, P. 2012. Noninvasive
determination of local pulse wave velocity and wave
intensity: changes with age and gender in the carotid
and femoral arteries of healthy human. J Appl Physiol,
113, 727-35.
Boutouyrie, P., Brie, M., Collin, C., Vermeesch, S. and
Pannier, B. 2009. Assessment of pulse wave velocity.
Artery Research, 3, 3-8.
Gamble, G., Zorn, J., Sanders, G., Macmahon, S. &
Sharpe, N. 1994. Estimation of arterial stiffness,
compliance, and distensibility from M-mode
ultrasound measurements of the common carotid
artery. Stroke, 25, 11-6.
Gaszner, B., Lenkey, Z., Illyes, M., Sarszegi, Z., Horvath,
I. G., Magyari, B., Molnar, F., Konyi, A. & Cziraki, A.
2012. Comparison of aortic and carotid arterial
stiffness parameters in patients with verified coronary
artery disease. Clin Cardiol, 35, 26-31.
Hasegawa, M., Rodbard, D. & Kinoshita, Y. 1991. Timing
of the carotid arterial sounds in normal adult men:
measurement of left ventricular ejection, pre-ejection
period and pulse transmission time. Cardiology, 78,
138-49.
Hermeling, E., Reesink, K. D., Reneman, R. S. & Hoeks,
A. P. 2007. Measurement of local pulse wave velocity:
effects of signal processing on precision. Ultrasound
Med Biol, 33, 774-81.
Laurent, S., Boutouyrie, P., Asmar, R., Gautier, I., Laloux,
B., Guize, L., Ducimetiere, P. & Benetos, A. 2001.
Aortic stiffness is an independent predictor of all-
cause and cardiovascular mortality in hypertensive
patients. Hypertension, 37, 1236-41.
Laurent, S., Cockcroft, J., Van Bortel, L., Boutouyrie, P.,
Giannattasio, C., Hayoz, D., Pannier, B.,
Vlachopoulos, C., Wilkinson, I., Struijker-Boudier, H.
& European Network for Non-Invasive Investigation
of Large, A. 2006. Expert consensus document on
arterial stiffness: methodological issues and clinical
ANovelandLowCostAcousticbasedProbeforLocalPulseWaveVelocityEstimation-ExperimentalCharacterization
andin-VivoFeasibility
87

applications. Eur Heart J, 27, 2588-605.
Laurent, S., Katsahian, S., Fassot, C., Tropeano, A.,
Gautier, I., Laloux, B. and Boutouyrie, P. 2003. Aortic
stiffness is an independent predictor of fatal stroke in
essential hypertension. Stroke, 34, 1203-1206.
Maldonado, J., Pereira, T., Polonia, J., Silva, J. A., Morais,
J., Marques, M. & Participants in The, E. P. 2011.
Arterial stiffness predicts cardiovascular outcome in a
low-to-moderate cardiovascular risk population: the
EDIVA (Estudo de DIstensibilidade VAscular)
project. J Hypertens, 29, 669-75.
Mancia, G., De Backer, G., Dominiczak, et al.,
Management of Arterial Hypertension of the European
Society Of, H. & European Society Of, C. 2007. 2007
Guidelines for the Management of Arterial
Hypertension: The Task Force for the Management of
Arterial Hypertension of the European Society of
Hypertension (ESH) and of the European Society of
Cardiology (ESC). J Hypertens, 25, 1105-87.
Meaume, S., Rudnichi, A., Lynch, A., Bussy, C., Sebban,
C., Benetos, A. & Safar, M. E. 2001. Aortic pulse
wave velocity as a marker of cardiovascular disease in
subjects over 70 years old. J Hypertens, 19, 871-7.
Murgo, J. P., Westerhof, N., Giolma, J. P. & Altobelli, S.
A. 1980. Aortic input impedance in normal man:
relationship to pressure wave forms. Circulation, 62,
105-16.
Pannier, B. M., Avolio, A. P., Hoeks, A., Mancia, G. &
Takazawa, K. 2002. Methods and devices for
measuring arterial compliance in humans. Am J
Hypertens, 15, 743-53.
Pereira, H. C., Cardoso, J. M., Almeida, V. G., Pereira, T.,
Borges, E., Figueiras, E., Ferreira, L. R., Simões, J.,
Correia, C. 2009. Programmable testbench for
hemodynamic studies. IFMBE Proceedings 25/IV
1460ff.
Pereira, H. C., Pereira, T., Almeida, V., Borges, E.,
Figueiras, E., Simoes, J. B., Malaquias, J. L., Cardoso,
J. M. & Correia, C. M. 2010. Characterization of a
double probe for local pulse wave velocity assessment.
Physiol Meas, 31, 1449-65.
Pereira, H. C., Basílio, J. B., Malaquias, J., Pereira, T.,
Almeida, V., Borges, E., Figueiras, E., Cardoso, J. and
Correia C. 2011. Double Headed Probe for Local
Pulse Wave Velocity Estimation – A new device for
hemodynamic parameters assessment. In Proceedings
of BIOSIGNALS 2011, Rome, Italy.
Rabben, S. I., Stergiopulos, N., Hellevik, L. R., Smiseth,
O. A., Slordahl, S., Urheim, S. & Angelsen, B. 2004.
An ultrasound-based method for determining pulse
wave velocity in superficial arteries. J Biomech, 37,
1615-22.
Segers, P., Kips, J., Trachet, B., Swillens, A., Vermeersch,
S., Mahieu, D., Rietzchel, E., Buyzere, M. and Bortel,
L. 2009. Limitations and pitfalls of non-invasive
measurement of arterial pressure wave reflections and
pulse wave velocity. Artery Research,
3, 79-88.
Shoji, T., Emoto, M., Shinohara, K., Kakiya, R.,
Tsujimoto, Y., Kishimoto, H., Ishimura, E., Tabata, T.
& Nishizawa, Y. 2001. Diabetes mellitus, aortic
stiffness, and cardiovascular mortality in end-stage
renal disease. J Am Soc Nephrol, 12, 2117-24.
Willems, J. L., Roelandt, J., De Geest, H., Kesteloot, H. &
Joossens, J. V. 1970. The left ventricular ejection time
in elderly subjects. Circulation, 42, 37-42.
BIODEVICES2013-InternationalConferenceonBiomedicalElectronicsandDevices
88
