
Deriving Basic Law of Human Mobility using Community
Contributed Multimedia Data
Katarina Gavrić
1
, Dubravko Ćulibrk
1
and Vladimir Crnojević
2
1
Dept. of Industrial Engineering and Management, Novi Sad, Serbia
2
Dept. of Power, Electronic and Telecommunications, Faculty of Technical Sciences, Novi Sad, Serbia
Keywords: Human Mobility, Flickr, Multimedia, Geo – Referenced, Community – Contributed Data.
Abstract: In recent years, geo-referenced community-contributed multimedia data that is available from services such
as Flickr/YouTube, has been used to help understand patterns of human mobility, behavior and habits.
While this data is freely available for much larger regions of the world, it is understood that the quality of
such data is lower than that of data that can be obtained from mobile phone operators. This is probably the
reason why public data has not been considered for studies attempting to identify basic laws that govern
human mobility. In this study we explore the possibility of using Flickr data as an alternative to mobile-
phone-generated data when it comes to analyzing human mobility. To do this, we apply a recently published
approach to analysis of mobile phone data to the trajectories of 6404 Fickr users, derived from a dataset of 1
million images pertinent to the San Francisco/San Diego area. Our goal is to show that regularities that can
be observed using mobile phone data are present in the Flickr data and that the publicly available data has
the potential to enable researchers to conduct similar analysis at larger (continent/world wide) scales, with
possible applications to urban planning, traffic forecasting and the spread of biological and mobile-phone
viruses. The results presented show that Flickr data is suitable for such studies, and can be used as an
alternative to proprietary mobile-phone-use related data.
1 INTRODUCTION
Gonzales et al. recently showed how mobile-phone-
used data can be used to derive important
characteristics of human motion (Gonzalez et al.,
2008); (Wang et al., 2009). They were able to show
that, contrary to previous research, human
trajectories show a high degree of temporal and
spatial regularity and that each individual is
characterized by a time independent characteristic
length scale and a significant probability to return to
a few highly frequented locations. Geo-referenced
data that can be obtained from photo and video
publishing web-sites on the Internet has been used to
by various authors to analyze certain aspects of
human mobility. Most of the work has been focusing
on determining attractive locations where tourists
congregate, using clustering and data visualization
techniques (Mirkovic et al., 2011); (Andrienko et al.,
2009).
While online multimedia services provide
progressively larger amounts of data, available for
large regions of the planet, they are treated within
the research community as second-grade when
compared to the mobile-phone-use data that can be
obtained from the telecommunication companies.
This is to the fact that there is no control over the
accuracy and the sampling frequency of community-
contributed data. However, mobile-phone-use data is
rarely available for the scientific community at large
and even then can only be obtained for specific,
relatively small regions. In the study presented, we
show that publicly-available geo-referenced images
can be used as alternative to mobile-phone-use data,
when it comes to in-depth analysis of human
mobility patterns.
Following the approach used by (Gonzalez et al.,
2008), we show that the basic laws governing human
mobility can be derived using the publicly available
data for a specific region. This opens up the
possibility of using such data to conduct world-level
studies of human mobility.
The rest of the paper is organized as follows:
Section II presents a brief overview of related work.
Section III describes the methods used in analysis,
together with results obtained from used approach.
543
Gavri
´
c K., Ä ˛Eulibrk D. and Crnojevi
´
c V. (2013).
Deriving Basic Law of Human Mobility using Community - Contributed Multimedia Data.
In Proceedings of the 2nd International Conference on Pattern Recognition Applications and Methods, pages 543-546
DOI: 10.5220/0004256405430546
Copyright
c
SciTePress

Section IV concludes the paper and suggests
possible directions for further work.
2 RELATED WORK
Our work is motivated by and builds on recent
results both in understanding the patterns of
behavior, habits and movements of the people and
data mining. In particular we take much of our
motivation from the work presented in (Gonzalez et
al., 2008); (Wang et al., 2009). Both of these papers
have similar goals of combining geospatial
information with mathematical models in order to
extract some significant patterns of human motion.
In (Gonzalez et al., 2008) the authors address the
challenging problem of mathematically modeling
human mobility. Their study is based on two mobile-
phone-use derived datasets. The first was collected
by tracking 100 000 anonymized mobile phone
users, selected out of a sample of over 6 million
users. Their position was recorded any time thy
initiated a call or sent an SMS over a six-month
period. The second dataset captured the location of
206 users whose position was recorded every two
hours, for an entire week.
Analyzing user displacements between
consecutive positions they mathematically show that
their distribution is well approximated by a truncated
power law. The authors continue the analysis to
show that this type is of distribution captures a
convolution of individual Lévy flight trajectories
(Righton and Pirchford, 2007) and population based
heterogeneity.
Defining the radius of gyration (r
g
) of a single
user be the typical distance travelled by the user up
to time t, they show that the rescaling of the
distribution of displacements with this value causes
it to collapse into a single distribution, suggesting
that a single relative jump size distribution
characterizes all users, independent of their r
g
.
Finally, ranking of the locations visited by the users
reveals that the people devote most time to a few
locations, while spending their remaining time in 5
to 50 places.
In (Wang et al., 2009) the authors used the same
mobile phone data to study fundamental spreading
patterns that characterize a mobile virus (Bluetooth
and MMS) outbreak. While geo-referenced images
from Flickr are not suitable for modeling the MMS
virus outbreak, they can be used to analyze the
spread of biological viruses which are passed in a
fashion analogous to that of the Bluetooth viruses.
Thus, the results derived in this paper have potential
application in the domain of virus outbreak analysis
and prevention.
3 METHODS AND RESULTS
3.1 Human Mobility Patterns
In our research, we used dataset of 1 million
metadata records associated with Flickr images
pertinent to the San Francisco/San Diego area. The
content has been downloaded automatically using a
tool developed in our lab, which in turn relies on
Flickr public API and uses C URL library.
We used two datasets to explore the mobility
patterns of individuals. The first (S1) consists of all
the geo-referenced videos in the downloaded dataset,
the second (S2) is a subset of this data that is
comprised of data uploaded by users who
contributed images over a period of time longer than
a week. This was done in an attempt to eliminate the
contribution of tourists from S2, as we assumed that
users with just a few images over a short period of
time fall in this category.
To explore the statistical properties of Flickr
users’ mobility patterns, we first take a look at the
displacements between user’s successive positions.
We find that the distribution of displacements can be
described well using a truncated power law (1):
P(∆r) = (∆r + ∆r
0
)
-β
exp(-∆r/k) (1)
with exponent values β=1.65±0.15 (for S
1
) and
β=1.70±0.18 (for S
2
) (mean ± standard deviation),
Δr
0
=1km and cut-off value k= 50km (see Figure 1).
Note that the observed scaling exponent is between
β=1.75±0.15 observed in (Gonzalez et al., 2008) for
mobile-phone-use data and β=1.59 observed in
(Edwards at el., 2007) for bank-note tracking data.
This suggests that all three distributions capture the
similar fundamental mechanism driving human
mobility patterns. Δr
0
and cut-of value k observed
are also close to what was obtained in (Gonzalez et
al., 2008) (Δr
0
=
1.5km, k=80km). The difference in
the value of Δr
0
may be due to the fact that the data
used in this study is actually more precise in terms
of user’s position, as the mobile phone data had to
be approximated to the center of the network cell.
A plot of the Probability Density Function (PDF)
of the displacements is shown in Figure 1. As the
figure indicates, S2 fits the power law better, but the
general trend is presented in both datasets.
ICPRAM2013-InternationalConferenceonPatternRecognitionApplicationsandMethods
544
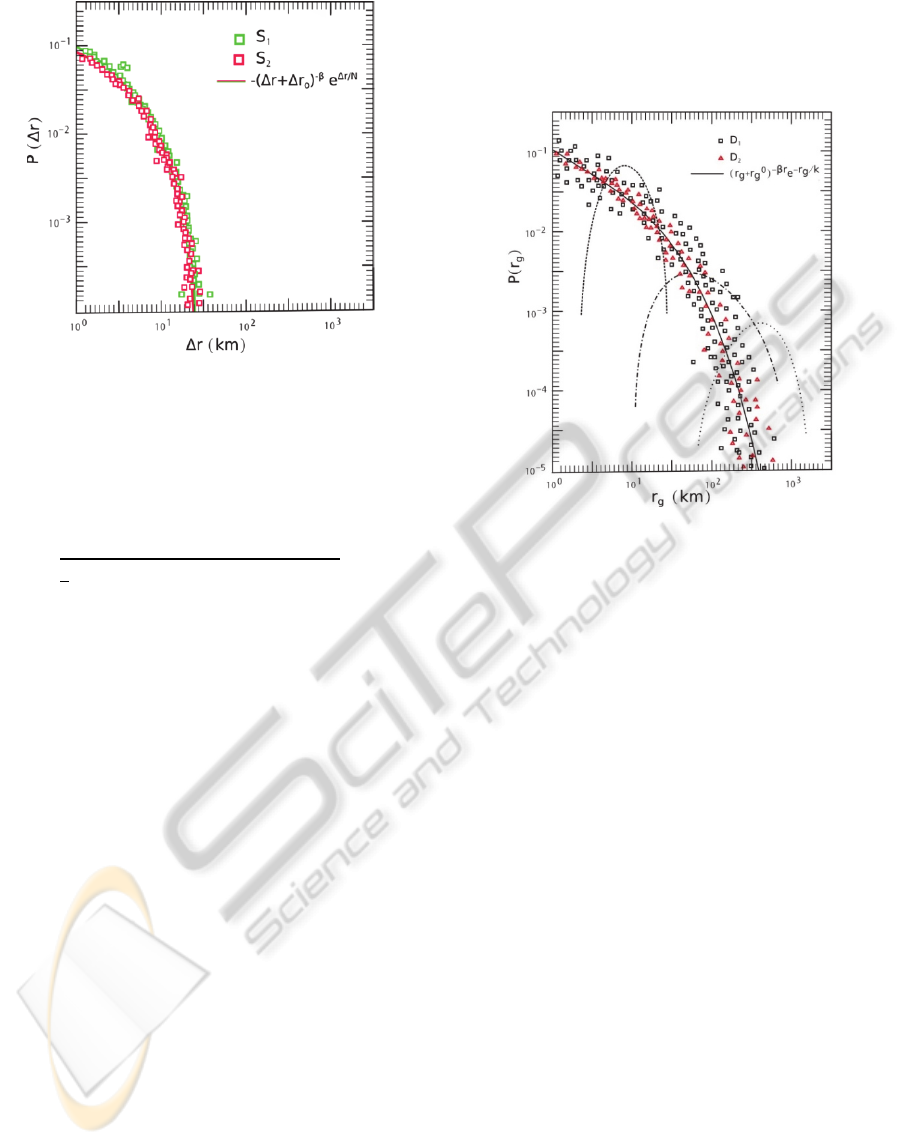
Figure 1: Probability density function P(∆r) of travel
distances obtained of the entire data set.
Next, we attempt to see if individual users
exhibit the same regularities of motion observed in
(Gonzalez et al., 2008). To do so, we first determine
the radius of gyration for all Flickr users in S
1
and S
2
(2):
r
g
=
∑
(2)
where x
cm
and y
cm
represent the centre of mass
position, calculated as (3):
x
cm
=
∑
/
(3)
y
c
m
=
∑
/
where (x
i
, y
i
) are the x and y coordinates of the
center of the cluster of positions visited by a single
user and n is the number of positions. We find that
the distribution of the radius of gyration P(r
g
),
shown in Figure 2, can also be approximated with
truncated power-law (4):
P(r
g
) = (r
g
+ r
g
0
)
-β
r
exp(-r
g
/k) (4)
with r
g
0
=8km, β
r
=1.75±0.25 and k=50km.
Lévy flight is characterized by high level of
heterogeneity, giving the possibility that equation (4)
could emerge from an ensemble of identical agents,
each following a Lévy flight. Therefore, we compare
P(r
g
) with the distributions of r
g
generated by
ensemble of agents following a random walk, Lévy
flight and truncated Lévy flight (Redner, 2001),
(Barabasi, 2005). An ensemble of Lévy agents
displays a significant degree of heterogeneity in r
g
,
yet this is not sufficient to explain the truncated
power law distribution P(r
g
) exhibited by Flickr
users phone users. Similar effect has been observed
in (Gonzalez et al., 2008) for mobile phone users.
Taken together, Figure 1 and 2 suggest that the
difference in the range of typical mobility patterns of
individuals (r
g
) has a strong impact on the truncated
Lévy behavior described by equation (1).
Figure 2: The distribution if P(r
g
), where r
g
(T) was
measured after T=12 months of observation. The dotted,
dashed and dot-dashed curves show P(r
g
) obtained from
the standard null models (Random walk, Lévy flight and
truncated Lévy flight).
If individual trajectories are described by Lévy
flight or truncated Lévy flight, then the r
g
should
increase with time as r
g
(t) ~ t
3(2+β)
(Havlin and Ben-
Avraham, 2002), for random walk, r
g
(t) ~ t
1/2
(Gonzalez et al., 2008). That is, the longer we
observe a user, the higher the chances that she/he
will travel to areas not visited before. This has been
proven for mobile phone users in (Gonzalez et al.,
2008). We expect the Flick users to behave in a
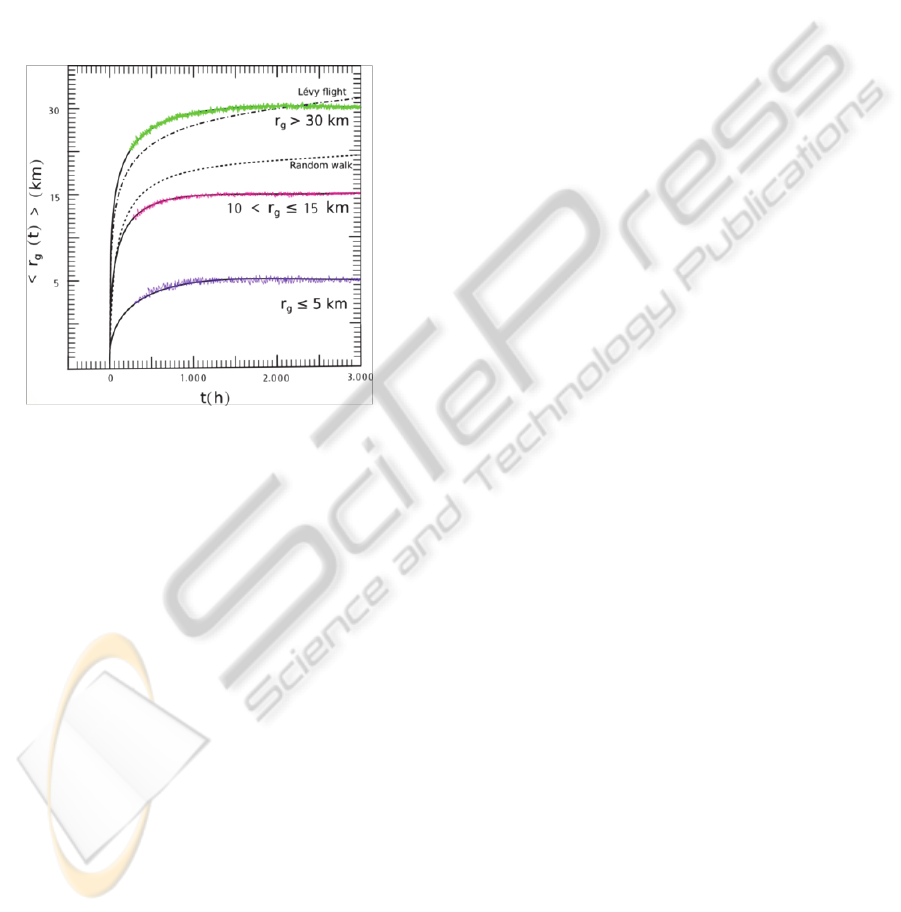
similar fashion.
To check this prediction, we measured the time
dependence of the radius of gyration for users whose
radius would be considered small (r
g
(T) ≤ 5 km),
medium (10 < r
g
(T) ≤ 15 km) or large r
g
(T) > 30
km. The result is shown in Figure 3. As it is a case
with the mobile phone users, the time dependence is
better approximated by a logarithmic increase, than
what we would expect for Lévy flight or random
walk models.
Finally, following the procedure done in
(Gonzalez et al., 2008) we selected users with
similar asymptotic r
g
(T) after T = 12 months, and
examine the jump size distribution P (∆r|r
g
) for each
group. The authors used this approach to observe
that the users with a small r
g
, usually travel over
small distances, while those with larger r
g
have a
DerivingBasicLawofHumanMobilityusingCommunity-ContributedMultimediaData
545
tendency to make longer trips. This cannot be
corroborated by our data. However, once the
distribution is rescaled with r
g
, the variance is
reduced and data collapsed into a single curve,
suggesting that that a single jump size distribution
characterizes all users, independent of their r
g
. This
has also been observed in (Gonzalez et al., 2008).
All the results presented in this section were
substantiated using the Kolmogorov-Smirnov test
(K-S test) for the goodness of fit of empirical data to
the fitted distributions (Righton and Pirchford,
2007).
Figure 3: Radius of gyration versus time, separated into
three groups according to their final r
g
(T), T = 12 months.
4 CONCLUSIONS
The paper presents the results of a study aimed at
deriving the basic laws that govern human mobility
and mathematical models of the process. Working
with dataset of meta data related to a set of over 1
million Flickr images, geo-referenced to the San
Francisco/San Diego area, we show that the tracks of
Flickr users seem to be governed by the same laws
that have previously been observed in studies based
on mobile-phone data and bank-note dispersal.
While there is significant heterogeneity within the
population, individual users exhibit significant
regularity and follow trajectories whose statistics are
largely indistinguishable after rescaling with the
radius of gyration of a user. These results represent
the first step toward an attempt of modeling and
understanding human activity patterns on a world-
wide scale. Our results indicate that the quality of
the data available through the Flickr online data
sharing and management system is comparable to
mobile-phone and bank-note dispersal data that has
been used in similar studies before. However, Flickr
data is readily available and covers most of the
World, which the former sources cannot match. This
fact opens avenues for addressing novel problems
and has the potential to improve our understanding
of complex networks of human mobility.
ACKNOWLEDGEMENTS
This paper was supported by the Ministry of Science
and Technological Development of Republic of
Serbia, under the grant number III-44002 and the
COST IC0903-MOVE Project.
REFERENCES
Gonzalez, M., Hidalgo, C., Barabasi, A. L., 2008.
Understanding individual human mobility patterns.
Nature, vol. 453, pp. 779-782.
Wang, P., Gonzalez, M., Hidalgo, C., Barabasi, L., 2009.
Understanding the spreading patterns of mobile phone
users. Science, vol. 324, pp. 1071-1076.
Mirkovic, M., Culibrk, D., Papadopoulos, S., et al., 2011.
A comparative study of spatial, temporal and content-
based patterns emerging in YouTube/Flickr, 3rd
International Conference on Computational Aspects of
Social Networks (CaSoN), pp. 189-194.
Andrienko, G., Andrienko N., Rinzivillo, S., Nanni, M.,
Pedreschi, D., 2009. Visual Analytics Toolkit for
Cluster-Based Classification of Mobility Data,
Springer, pp. 432-435.
Redner, A., 2001. A guide to first-passage process,
Cambridge University Press, Cambridge.
Barabasi, A. L., 2005. The origin of burst and heavy tails
in human dynamics. Nature, vol. 432, pp. 207-211.
Havlin, S., Ben-Avraham, D., 2002. Diffusion in disorder
media, Physics, vol. 51, pp. 187-292.
Edwards, A. M., Phillips R. A., Watkins, N. W., et al.,
2007. Revisiting Lévy flight search patterns of
wandering albatrosses, bumblebees and deer, Nature,
vol. 449, pp. 1044-1049.
Righton, D. W., Pirchford, J. W., 2007. Minimizing errors
in identifying Lévy flight behavior of organisms.
Journal of Animal Ecology, vol. 76, pp. 222-229.
ICPRAM2013-InternationalConferenceonPatternRecognitionApplicationsandMethods
546
