
Evolving Urbanisation Policies
Using a Statistical Model to Accelerate Optimisation over Agent-based Simulations
Marta Vallejo, David W. Corne and Verena Rieser
School of Mathematical & Computer Sciences, Heriot-Watt University, Edinburgh, U.K.
Keywords:
Agent-based Model, Genetic Algorithm, Statistical Model, Optimisation, Uncertaincy.
Abstract:
Agent-based systems are commonly used in the geographical land use sciences to model processes such as ur-
ban growth. In some cases, agents represent civic decision-makers, iteratively making decisions about the sale,
purchase and development of patches of land. Based on simple assumptions, such systems are able broadly to
model growth scenarios with plausible properties and patterns that can support decision-makers. However, the
computational time complexity of simulations limits the use of such systems. Attractive possibilities, such as
the optimisation of urban growth policies, tend to be unexplored since the time required to run many thousands
of simulations is unacceptable. In this paper we address this situation by exploring an approach that makes
use of a statistical model of the agent-based system’s behaviour to inform a rapid approximation of the fitness
function. This requires a limited number of prior simulations, and then allows the use of an evolutionary algo-
rithm to optimise urban growth policies, where the quality of a policy is evaluated within a highly uncertain
environment. The approach is tested on a typical urban growth simulation, in which the overall goal is to
find policies that maximise the ’satisfaction’ of the residents. We find that the model-driven approximation
of the simulation is effective at leading the evolutionary algorithm towards policies that yield vastly better
satisfaction levels than unoptimised policies.
1 INTRODUCTION
The main purpose of planning, in the context of ur-
ban and other land-use, is to improve the commu-
nity’s quality of life by creating a better social, eco-
nomical and physical environment. One of the most
urgent research issues within this broad field is the
study of mechanisms that can mitigate the ecologi-
cal degradation that is invariably linked with urban
expansion. What makes this particularly difficult is
that the process of urban expansion needs to achieve
effective and acceptable results at many time-scales.
For example, if a growing city builds quickly on the
majority of the green spaces available to it, it will
severely limit its further growth opportunities. One
possible option for maintaining a healthy urban envi-
ronment is by reserving a collection of arbitrary areas
to transform them into recreational parks. However,
the time planning and geographic distribution of these
spaces needs careful consideration to ensure the qual-
ity and quantity of environmental services provided to
the surrounding community (Forsyth and Mussachio,
2005).
Among other important functions, public open
space planning allows local authorities to protect cer-
tain areas from the urbanisation process, and thus
foster the formation of healthier urban environments.
From this point of view, local and central govern-
ments play perhaps the most crucial regulatory role
(moreso than national governments or international
organisations) in the control of land-use change in the
longer term.
Designing feasible long-term plans is not straight-
forward, mainly because of the many and varied un-
certainties that the future entails. However, there is
much active research in this area, whereby researchers
interested in urban planning and sustainability have
investigated a range of agent-based systems and sim-
ilar mechanisms to explore the consequences of dif-
ferent strategies (Parker et al., 2003; Sasaki and Box,
2003; Sanders et al., 1997). One of the most com-
mon interests in such work is the dynamics of urban
growth, which is linked with the relative distribution
of urbanised, industrial and green spaces and their im-
pact on quality-of-life issues, and how these depend
on the broad strategies in place for land-use (Robin-
son et al., 2012). In many agent based systems, a
typical agent represents a local government decision-
maker, or a recent immigrant deciding where to settle
within the growing city. Based on simple assump-
171
Vallejo M., Corne D. and Rieser V..
Evolving Urbanisation Policies - Using a Statistical Model to Accelerate Optimisation over Agent-based Simulations.
DOI: 10.5220/0004261001710181
In Proceedings of the 5th International Conference on Agents and Artificial Intelligence (ICAART-2013), pages 171-181
ISBN: 978-989-8565-39-6
Copyright
c
2013 SCITEPRESS (Science and Technology Publications, Lda.)

tions, such systems are able broadly to model land-
type distribution scenarios over time and influence
decision-makers and policy makers.
However, the computational time complexity of
simulations limits the use of these systems merely to
testing one hypothesis at a time. For example, such a
system may be set up and run to examine the potential
effects of a proposed new tariff for land purchase tax.
A more attractive prospect, however, would be to use
the system to help find an optimal tariff or, in general,
an optimal policy or strategy for the task in question.
This area of work however tends to be unexplored,
since the time required to run many thousands of sim-
ulations (as is typically required for optimisation) is
not a feasible strategy in practical situations.
In this paper we address this situation by wrapping
optimisation over the agent-based simulation process,
but use a rapidly accelerated model of the agent-based
simulation in place of the real knowledge. This re-
quires a limited number of prior simulations of the
agent-based urban growth system, and then allows the
use of an evolutionary algorithm to optimise urban
growth policies. The approach is tested on a typical
urban growth simulation, in which the overall goal is
to find policies that maximise the ’satisfaction’ of the
residents. A ’policy’, in this work, amounts to the
city authorities’ planned schedule for protection of a
specific set of green spaces.
Note that similar simulation-based approxima-
tions for optimisation are also used in other fields,
such as user simulations for spoken dialogue sys-
tems (Rieser and Lemon, 2011) or emulators for man-
aging uncertainty in complex models, such as simu-
lated climate models (MUCM).
In our case, the general objective of the model is
to design a planning process which lead us to find
the optimal subset of green spaces within the physi-
cal boundaries of the city. A green space can be de-
fined as a natural landscape located close to urban or
peri-urban areas. This definition can cover concepts
like county parks, areas of outstanding natural beauty,
natural reserves, forest parks or crown lands (Allison,
1975).
The selected agent-based model simulates the
growth of a city over a 50-year time-span. In each
year, different flows of incoming population lead to
pressure for development of new areas. Meanwhile,
individual areas have varying costs, based on a sim-
ple model that values proximity to green areas over
heavily-urbanised areas, and naturally evolve as the
city grows. The model is therefore dynamic in time
and space, and each simulation run will yield a dif-
ferent result. This in turn exacerbates the difficulty
of optimising directly over full simulation runs, since
several runs would be needed to evaluate the statisti-
cal properties of even a single policy. However, the
approach we use to obviate the need for full simula-
tion runs also addresses this issue, since it amounts
to importing and exploiting pre-calculated statistical
averages for each time-step in the simulation.
The remainder of the paper is organised as fol-
lows. Section II provides various introductory and
preliminary details, covering the urban planning prob-
lem, the role of agent based simulation, and evolution-
ary algorithms. Section III then provides a detailed
account of the models, assumptions and processes we
employ in our experiments. Section IV focusses on
the sources of uncertainty that are handled by our new
statistical genetic algorithm approach. Computational
experiments are specified in Section V, and the results
are presented and discussed in Section VI. Section VII
then draws some conclusions and we discuss further
research in Section VIII.
2 PROBLEM DEFINITION
Open green urban areas play an important role in
maintaining a healthy urban environment. Among
all their favourable effects, their crucial impact in the
economy, quality of life and in the local climate of the
cities (Costanza et al., 1998; Nowak and McPherson,
1993) can be highlighted. However their distribution
and location should be carefully studied by develop-
ing an adequate, long-term planning strategy.
2.1 Urban Open Space Planning
There is a lack of agreement about how to implement
and implant a given planning process and which mea-
sures should be selected. The most remarkable points
to discuss are:
• How to select adequate planning criteria.
• Deciding the most suitable size for the open space
according to the current and expected necessities.
• Where the open spaces should be located and how
they should be accessed.
• The design of the potential activities for these ar-
eas according to different age groups and cultures.
A problem that arises when these issues are tack-
led is that there exist a variety of approaches with
clear contradictory main goals. Among all of them,
the present work follows a demand approach where
the planning process should be based on attributes of
the specific target population. The necessity of provi-
sion of a set of services defines the pressure over the
ICAART2013-InternationalConferenceonAgentsandArtificialIntelligence
172

available open space. This pressure can be measured
by means of:
• Size of the urban population.
• Subjective personal preferences.
• Residential distribution.
• Density of the population.
2.2 Allocation of Resources
The problem domain of the present paper can be in-
cluded within the field of stochastic control theory.
The developed model represents a paradigm of alloca-
tion of resources within a sequential decision-making
simulator where a set of actions can be taken in each
sequence that is followed by the system.
Generally speaking, a sequential planning prob-
lem can be defined as follows: an environment which
can be described as a state-space set S and an action
set A where S and A are both finite. Each state s ∈ S is
dependent on the previous state of the system and the
action a ∈ A taken. The transition function δ controls
how actions modify the state of its environment.
s
t+1
= δ(s
t
,a) (1)
We define a policy Π such that the mechanism in
charge of selecting the next action is based on the cur-
rent perception of the environment. This perception
can be total or partial:
Π : S → A
Π(s
t
) = a
t
(2)
In turn, the action a influences as well its environ-
ment provoking the change of the current state. The
process starts in the state s
0
and by means of the se-
quential application of the policy Π, further actions
are chosen.
2.3 Cellular Automata & Agent-based
Modelling
The present study is based on the results collected in
a basic urban growth model created with the use of
Cellular Automata and Agent-Based Modelling tools.
The topological layout of the city is represented
by a Cellular Automata (CA). CA (Newmann, 1966)
was proposed for discrete space-time representation
of problems which obey their local physics. It is based
on the assumption that by means of local interactions,
the model is capable of representing complex phe-
nomena. The dynamics of the CA are generated by
a set of transition functions which define how cells
can evolve from one state to another.
The inhabitants who populate the city and their
dynamics are modelled with the use of an Agent-
Based Model (ABM) approach. ABM has been used
to understand the interconnections, interdependences
and feedbacks created among a set of heterogeneous
individual entities in order to fulfil their goals. Each
agent has an individual decision-making capacity ac-
cording to its personal role. In combination with the
CA approach, agents can be explicitly located and, in
this way, they can influence its environment and affect
the patterns formed in urban infrastructure.
ABM along with CA taking the role of repre-
senting land-use change dynamics have been applied
broadly in the field of urban development. Mention-
able is their use to simulate allocation decisions (Ot-
ter et al., 2001; Brown and Robinson, 2006) or in resi-
dential selection within a non-stationary housing mar-
ket (Devisch et al., 2009; Parker and Filatova, 2008).
On the other hand (Filatova et al., 2009) analyses how
these tools are applied to analyse how prices affect
urban agent behaviour. Finally, (Miller et al., 2004)
studied the role of transportation in the evolution of
an urban region.
2.4 Genetic Algorithm
Genetic Algorithm (GA) (Holland, 1975) it can be
defined as an heuristic that mimics the behaviour of
natural selection postulated by the English naturalist
Charles Darwin in the 19th Century (Darwin, 1861).
This search strategy is based on the assumption that
nature evolves by the course of new generations pre-
serving the species more suited to their environment.
The tools defined by a GA to improve the population
over time are the use of mechanisms like reproduc-
tion, mutation, crossover and selection.
Here we use GA to optimise the green space al-
location problem. GA has been successfully used to
solve complex spatial problems (Pukkala and Kurt-
tila, 2005). However, its performance in uncertain
environments has been questioned (Wu et al., 2006;
Rieser et al., 2011) due to the fact that a simple GA
has insufficient data to deal directly with uncertainty.
This weakness is the main reason why a GA, under
this kind of scenarios, should be defined carefully and
provided with the support of external tools in order to
overcome these difficulties and to be totally suitable
for this type of problems.
There exist different attempts and techniques that
can be applied to a GA to give it this extra functional-
ity. In (Qin et al., 2010) a Genetic-Algorithm-Aided
Stochastic Optimisation Model is applied to cope with
the uncertainty related to the study of air quality in
urban areas. Qin makes use of Monte Carlo simu-
EvolvingUrbanisationPolicies-UsingaStatisticalModeltoAccelerateOptimisationoverAgent-basedSimulations
173

lation techniques to measure the effectiveness of a
solution. Instead (Wang and Yang, 2009) resorts to
anti-optimisation techniques (local search) to over-
come the uncertainty generated by ageing presented
in many engineering problems and affects remarkably
the final performance of the system.
3 MODEL DESCRIPTION
The selected ABM-CA framework is used to repre-
sent a basic urban growth model with a monocentric
spatial structure based on the traditional Alonso’s ur-
ban economic model (Alonso, 1964). The strategy
of this model to explain the modern urbanisation pro-
cess is based on the maximisation of a utility func-
tion. Urban pattern formation is the consequence on
individual urban residence preferences which achieve
an economic competitive equilibrium between hous-
ing and commuting costs.
The physical layout of the city is configured by a
2-dimensional lattice of 50x50 cells. Each cell cor-
responds to a physical portion of the city and it can
be populated by more than one agent. Each of them
represents a family unit.
Figure 1 represents the development of a city in a
determined sequence of the simulation.
Figure 1: An image which represents the urbanisation dy-
namics where the monocentric city (green cells) spreads
their boundaries. This process convert rural cells (in grey)
into peri-urban areas (white cells).
The evolution of the city is ruled by an inter-
nal schedule or discrete-event box in which the num-
ber of defined events has always associated a deter-
mined time-horizon of finite duration. The dynamics
of agents and cells allow the model to evolve between
a set of predefined one-directional states. The rules
of transition define how cells and agents change their
state at each time step.
On the other hand, the types of the cell presented
in the grid can be broadly divided into two main
groups: urbanised and non-urbanised cells.
3.1 Urban Cells
Urban cells are cells that have been transformed
from native ecosystems into either impermeable sur-
faces or green areas formed normally by non-native
species (Byomkesh et al., 2010).
In the model, when cells receive the permission to
be urbanised, which figuratively means that dwellings
are constructed, they can allocate population that is
represented by agents. Agents decide their residence
location by searching a trade-off between their per-
sonal preferences, quality of life and their economi-
cal restrictions. This search involves the interaction
among different parameters of the model. The de-
cision is represented by the maximisation following
utility function:
maxU = (w, z, x, p : w > 0,z > 0,x ≥ 0, p > 0)
such that:
w − z − kx + p = 0
(3)
In the equation, x represents the distance from the
household to the Central Business District (CBD) that
is located in the centre of the lattice, w is the wage re-
ceived monthly. This quantity is defined by a uniform
random process and does not change through the life
time of the agent, z is the price of the residential good
and k is the constant marginal community cost. Fi-
nally, p represents the agent’s preferences. This pa-
rameter takes into consideration their personal level
of preference for houses located close to green areas.
In the agent definition a stochastic value which rep-
resents his acceptance to pay more for this kind of
houses, is generated. This parameter is an extension
of the economic competitive equilibrium described
by (Alonso, 1964). Following this utility function
agents populate the grid.
3.1.1 Prices of the Urban Cells
The prices of urban cells represents the amount of
money that agents have to pay regularly as a rental
cost and their values are dependant on the following
factors:
• The Demand. The demand is defined according
to the number of agents living in a given cell.
ICAART2013-InternationalConferenceonAgentsandArtificialIntelligence
174

– The demand for certain preferred locations in-
creases their price.
– The drop in the population in a cell decreases
its price.
– If one cell does not receive any new neighbour
during a determined period of time, the value of
their dwelling is reduced.
• Proximity to Green Areas. The proximity of a
green area is a factor which affects the final price
of the houses. This factor increment a 10% the
final price of the dwelling.
3.2 Non-urban Cells
Non-urban cells are cells that did not suffer a urbani-
sation transformation. At the beginning of the simu-
lation the model assigns an stochastic value to all the
non-urbanised cells. This parameter called BioValue
represents the ecological value of this parcel of land.
This value is assigned to each cell by a uniformly ran-
dom process U(0,1):
BioNeighbourValue
c
= 0
for each cell n in neighbourhood(c){
if(BioValue
n
0.7)
BioNeighbourValue
c
+ = 0.01
if(BioValue
n
0.3)
BioNeighbourValue
c
− = 0.01
}
CellValue
c
= BioValue
c
+ BioNeighbourValue
c
In the present model, if the cellValue of a cell is
bigger than 0.7 this cell is classified as a forest cell,
otherwise it will be assigned an agricultural. Both
types of cell have associated a different price based
on rural land prices in UK (Riley, 2002).
The belonging to each category is dynamic over
the time. Actually the model suffers a continuous
transformation in the state of their cells changing
from forest to agricultural. These uninterrupted trans-
formations represent the ecological degradation pro-
cess of the peri-urban areas provoked by the urban
expansion over the grid.
Local governments can adopt a wide range of
interventionist mechanisms to restrict the ownership
over the land and control its use. Among these mea-
sures the local authority can assume the proper own-
ership of the land and assign them partially or totally
the function of urban green spaces. One sucessful ex-
ample of the use of this mechanishm is the case of
Stockholm city (Passow, 1970). Thus, local govern-
ments act as a response to social requirements over
gardens and parks to provide a set of services based
on the proximity to potential users.
The model delegates the responsibility of select-
ing the best non-urbanised stands to a new special
agent called Municipality. This agent does not inter-
act with the rest of agents. His main goal consists
of managing the purchase and protection of green ar-
eas within the city by means of a monetary income
received periodically called budget.
The location of these areas is a crucial factor for its
future use. The selection is performed sequentially in
each lapse of time and is limited by the budget and
the configuration of the system in this precise mo-
ment. Once the purchase is done, the state of the cell
is changed to protected and the construction of urban
facilities within it is forbidden.
This selection process can be formulated as fol-
lows: if C is defined as the finite set of cells included
into the lattice, A the subset of cells that can be con-
sidered as a candidate cell to be purchased, P the sub-
set of cells that are protected and U the urbanised cells
such as A ⊂ C, P ⊂ C, U ⊂ C and A ∪ P ∪U =
/
0, then
the selection of the cells to be acquired in a given se-
quence of time t can be defined as:
∀ cell c ∈ C
price(c)
t
< budget
t
∧ c
t
/∈ {P,U}
=⇒ c
t
∈ A
(4)
Once the candidate cells are discriminated, the
purchasing process can be formalised as:
∀ cell a ∈ A
max
satis f action
δ(a)
t
=⇒ a
t
∈ P ∧ a
t
/∈ C
budget
t+1
= budget
t
− price
t
(a)
(5)
The function δ represents the metric that measures
the level of satisfaction of the population and takes
into account the monitoring of the distance to green
areas. See formula 6.
Every subset of selected cells has associated a
level of satisfaction of the population allocated within
the boundaries of the city. The model should select
the configuration of green areas which achieves the
highest possible level of satisfaction according to the
restrictions of the system during the considered period
of time. However, the huge number of possible com-
binatorial selections makes the task of performing an
exhaustive search of all different choices impossible
in a feasible amount of time.
4 SOURCES OF UNCERTAINTY
In the present model uncertainty can emerge from a
wide variety of sources. Apart from the fact that the
EvolvingUrbanisationPolicies-UsingaStatisticalModeltoAccelerateOptimisationoverAgent-basedSimulations
175

implementation of long-term plans always implies to
be able to cope with unpredicted future variations, the
complexity resultant from the multiple interactions
occur between the elements represented in the model
makes their management even more challenging.
Some factors which actively contribute to the in-
crement of the level of uncertainty are mentioned in
the list below:
4.1 Property Prices & Green Areas
In the model, the selection of green spaces exerts
a direct influence on the prices of the surrounding
urbanised cells. (Tyrv
¨
ainen and Miettinen, 2000;
Thorsnes, 2002) analyse this tendency demonstrating
how prices of home properties increase with the prox-
imity of urban parks. This aspect is included in the
model as the agents’ desire to live close to these areas
and is represented by the agent’s acceptance to pay
more for these specific locations. The implications of
the inclusion of these personal desires provoke a sig-
nificant growth in the demand and subsequently in the
price. All these factors affect the spatial spread of the
city and the patterns developed over the time.
4.2 Ecological Degradation Process
From the point of view of the non-urbanised cells,
the main parameter which involves a high level of un-
certainty is the relationship created between the land
price dynamics and the cells’ ecological value. Due to
the fact that this ecological value is also influenced by
the cells that form its neighbourhood as is defined in
the previous code. The consequence of this linkage is
that a significant change in a specific area of the lattice
spreads in all directions and can produce instability in
these eco-values of the surrounding cells.
This is the reason why the growth of the physical
boundaries of the city creates an ecological degrada-
tion process in the surrounding areas. This dynamic
influences the price of the non-urbanised cells that are
closely located and hence the purchasing process of
protected areas.
4.3 Urbanisation Process
The underlying process of urbanisation is in nature
partially random and mainly determined by two fac-
tors:
• The rules of transition of the cells.
• The demand level.
Firstly, the rules of transition of the cells are based
on preselected probabilities. Regarding the demand
level, the model has defined a constraint in order to
avoid transforming peri-urban into new urban cells if
there is an enough number of non-populated urban
cells in the city. A cell can be unpopulated if any
new adult agent considers this cell profitable enough
to move within it or because all agents allocated in-
side a determined cell have died and any new agent
has move inside.
The model is designed so that it is necessary to
have a minimum population density in all urbanised
cells to achieve the enough level of demand which al-
low the system to build new neighbourhoods. This
characteristic was added to avoid an unrealistic spread
of the city due to the behaviour of the rules of transi-
tion of the cells.
The knowledge of the urbanisation process is cru-
cial: the set of candidate cells to be protected are re-
stricted to the non-urbanised ones and hence, in the
protection procedure, we need to be aware of the com-
plete state of the cells in each time step.
4.4 Flows of Population
Another significant characteristic of the model is that
the described city is a non-closed-system. This means
that there are income flows of new population com-
ing from migration as well as new offspring resulted
from the current settled population. The dynamics of
these flows are not fixed and predictable. However
they play a relevant role in the final population dis-
tribution within the city because it is not possible to
guess in advance where they are going to be allocated.
Subsequently, the density of each future neigh-
bourhood cannot be totally predicted in advance even
if there exists a general preference to live close to the
city centre in line with the Alonso model. In con-
clusion, this effect means that as we do not know the
population distribution it is not possible to know the
percentage of population directly affected by a deter-
mined location of a new green area.
5 CASE STUDY
5.1 Configuration of the GA
5.1.1 Encoding
A GA evolves through time a constant size popula-
tion of individuals as well called chromosomes cho-
sen randomly from the set of candidate solutions. In
the present paradigm an individual is encoded as a se-
quential selections of cells grouped in a predefined
ICAART2013-InternationalConferenceonAgentsandArtificialIntelligence
176

number of time steps. Each of these selections rep-
resents a gene of the individual and can contain from
0 to n protected cells chosen by the Municipality in
one of the sequences of time. The superior limit n
is bounded by the maximum budget available in this
time step.
Linked with each subset of cells selected in each
interval, its budget is stored. The budget can be de-
fined as the amount of money that the Municipality
can assign to the purchase of urban parks. It consists
of the remaining funds resulted from the last transac-
tion made by the Municipality plus possible new in-
comes. The individual value of the budget is always
insufficient to buy any non-urbanised cell.
5.1.2 Selection Scheme & Mutation Process
There exist many selection schemes for GA, among
them the present model uses tournament selec-
tion (Goldberg, 1990) that is a robust and simple to
code selection mechanism for GA based on the idea
of holding a tournament between a group of competi-
tors randomly selected among the population.
Mutation is a tool used to maintain the diversity.
The mutation process alters one or more values of the
genes inherited from the parent. In our case a muta-
tion consists of changing which cell/s will be trans-
formed into a green area in a determined sequence of
time. Additionally if the price of the swapped cells is
different, the associated budget value is updated.
5.1.3 Fitness Function
As we have already mentioned, optimising the selec-
tion of the best recreational areas in a period of time
with the only use of a classical GA approach is not
possible under a high uncertainty environment.
In the previous section we listed the different
sources of uncertainty that the optimisation procedure
should cope with. In spite of all of them, we should
be able to assess how feasible a given solution can be
in the future. In a GA paradigm this is done by the use
of a fitness function. This function can be nonlinear,
discontinuous or even nondifferentiable.
To measure the value of a determined green area,
the model can use different kind of metrics according
to which aspect or aspects want to be emphasized. In
the current model the quality of a solution or satisfac-
tion represents the accumulative satisfaction achieved
by each person settled on the city with respect to
the topological distribution of green areas in the grid.
Concretely it is associated with the distance between
him and a green area.
(Giles-Corti et al., 2005) states that the distance
to a green area influences the frequency of use and
the activities undertaken. According to this crite-
rion, green areas can be classified into the following
groups:
• Access within a short walk. If the green area can
be reached within less than 300 meters.
• Access within a long walk. The distance objective
is ranged from 300 to 600 meters.
• Access with help of any means of transport. If the
distance is larger than 600 meters.
The same study concludes that people do not gen-
erally use a green area if it is located beyond a thresh-
old of 300-400m. Following this approach the pro-
cess of calculation the fitness function can be defined
as follows:
If A is the set of agents living in the city, P is the
set of protected cells and C is the set of cells defined
in the grid such as P ⊂ C, then for a given time t:
∀ agent a ∈ A
∀ protected cell c ∈ P
δ(a) = min
distance
(a,c)
s(a) =
3 if δ(a) = 1
2 if δ(a) = 2
1 if δ(a) = 3
0 otherwise
Θ =
n
∑
i=0
s(a
i
)
(6)
We define δ as the function that calculates the dis-
tance from the location of a given agent a to the clos-
est green area in the grid using Manhattan distance.
Besides we define s as the function which calculates
the individual satisfaction achieved by a given agent
a. Finally, Θ represents the total satisfaction achieved
by the population of size n in the lattice in time step t.
This fitness function is, in turn, linked directly
with the spatial spread of the city and the population
density of each stand. However, to be able to use a fit-
ness function, it is necessary to know the location of
the entire population in each time step and make this
information available to the algorithm as input data.
5.2 Data Collected from Simulation
Runs
The optimisation method overcomes this aforemen-
tioned lack of knowledge by the use of data gath-
ered from the non-optimised version of the simula-
tion. This data should describe what is the most likely
topological development of the city and the popula-
tion evolution in terms of number and location that
can occur in the future.
EvolvingUrbanisationPolicies-UsingaStatisticalModeltoAccelerateOptimisationoverAgent-basedSimulations
177

The collected data retrieved during the multiple
runs of the non-optimised simulation includes the fol-
lowing elements:
• Due to the fact that only non-urbanised cells can
be candidate to be protected it is necessary to
know when each cell is more likely to be ur-
banised. This data is used to know if in a given
instant of time a cell can receive the status of pro-
tection or not. The non-optimised simulation an-
notates in each run when the different cells are ur-
banised.
• Density distribution. The simulation collects sta-
tistical data about the amount of agents living in
the city and their precise location in the grid in
every time step. This information is necessary to
calculate the fitness function.
5.3 Defined Assumptions
Once the statistical data is gathered, it is necessary
to define two common assumptions used as a point
of departure in all the components of the optimisa-
tion framework. The involved parameters in these as-
sumptions are the budget and the ecological scenario.
5.3.1 The Budget
The stochastic budget assigned to the municipality in
each sequence of time is decided in advance and is
shared by all individual solutions of the GA. This fact
is critical because of the accumulative nature of the
budget and the possible interdependence between the
sequence of choices undertaken.
Dealing with the budget in the optimisation phase
as currently is defined, can arise a potential problem
in the gene mutation process. We recall that the in-
formation encoded in a gene is composed by a set of
cells to be protected and the remaining budget in a
given time step.
Due to the fact that non-urbanised cells can have
different prices, a single modification in the selected
cells of a gene can influence substantially in the
amount of money used in the future selection of cells.
This change could entail the appearance of inconsis-
tencies encoded of the future choices into the chro-
mosome if the former and the new cell involved in
the mutation process are different enough in price that
the remaining budget for posterior purchases could
lead to a significant different scenario. This prob-
lem is caused because the election of the budget in
each sequence of time, is not independent from on-
ward choices and one decision could condition future
purchases.
5.3.2 Ecological Scenario
The second assumption refers to the ecological con-
figuration of the lattice at its point of departure. The
scenario is defined by the initial random generation
of the ecological values in each cell. An example of
ecological values assigned to the grid can be seen in
Figure 2.
The optimisation process shares the same initial
scenario for all individuals. The same values are
the base for the non-optimised simulations in which
statistical data is gathered and also for the final test
where the real optimality achieved by the GA out-
come is measured.
Figure 2: Environmental values and the effect of the urban-
isation process. The range of colours from green to black
depicts the possible ecological values of the cell. Notice
that in the centre of the lattice, where the city is located, the
black eco-values represent the biological degradation or the
metropolitan area.
5.4 Methodology Followed
The main components which form the data flow of the
optimisation process are:
• The non-optimised simulation.
• The GA algorithm.
• The test component.
The point of departure of the following workflow
consists of the definition of the initial model configu-
ration as it was mentioned in the previous section and
the assignation of the values for the budget and the
ecological values of the lattice.
Secondly, the non-optimised version of the simu-
lation should be run the necessary amount of times to
retrieve enough comprehensive knowledge about the
dynamics of the model: the topological spread of the
city and population density.
ICAART2013-InternationalConferenceonAgentsandArtificialIntelligence
178
Once this data is gathered, the GA algorithm can
be carried out. In this phase the GA population is
generated and evolved for 2500 iterations, assuring
its convergence. For each new generation, the possi-
ble candidate cells should satisfy the following con-
straints to cope with the restrictions derived from the
management of an uncertain future:
• New selected cells must not have been already se-
lected for this individual neither in the past nor in
the future in order to avoid inconsistencies.
• The model tries to verify that in a real situation the
selected cells are unlikely to be already urbanised.
Due to the GA cannot infer a priori what is the
possible state of these cells, it should resort to the
collected knowledge stored previously in the sys-
tem. This data depicts the behaviour of the city
and based on it the GA algorithm should discern
what is the most plausible topological layout of
the city in this concrete sequence of time.
The concept of tolerance is used to decide the
level of confidence in which a cell can be selected
to be protected. The more tolerance is permitted,
the more inconsistencies can occur when the real
simulation performs the testing of the solution.
The value for this value used in the experiments
is zero, that means that it is not allowed to protect
the cell if in any of the simulations performed in
the non-optimised phase this cell was urbanised at
this point in time.
• Every time a new individual solution is generated,
the optimisation component should be able to ap-
ply to it the fitness function to measure the quality
of the new solution. However, this fitness function
requires to know which amount of population will
be affected by the choices included into the solu-
tion from the beginning to the end of the simula-
tion.
For this purpose the optimisation component
makes again use of the collected data, estimating
the density of the population in the surrounding
areas and calculating the fitness using Formula 6.
Once the optimisation phase has been concluded
and the final individual solution with the highest fit-
ness is generated, the test phase is carried out. The test
component uses the output data from the GA phase to
check the viability of the protected cells. This output
data defines the cells that have to be selected in each
lapse of time.
These simulations run in a modified version of the
model where the selection of green spaces is done
in a deterministic way meanwhile the rest of factors
and interactions maintain its dynamical nature and its
complex and unpredictable behaviour. The main pur-
pose of this test step consists of:
• Measuring the real satisfaction of the population.
• Detecting inconsistencies and incompatibilities of
the selected cells.
6 COMPUTATIONAL RESULTS
The results were calculated as averaged over 20 re-
peated optimisations, all of them in compliance with
the assumptions and restrictions commented in previ-
ous sections.
Figure 4 plots two functions which represent the
efficiency achieved during 500 ticks of the simulation
cycle. The function in red depicts the amount of sat-
isfaction achieved by the population when the cell se-
lection is performed randomly meanwhile the results
achieved in a test simulation by the GA approach are
represented in blue.
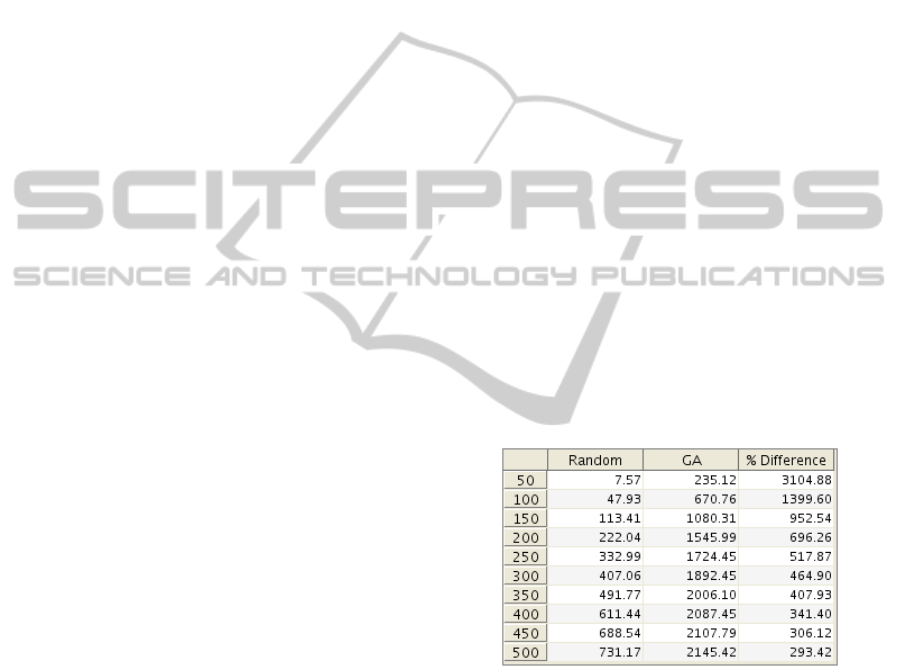
Numerically, the same achieved results are shown
in Table 3 where the data has been discretised and
averaged with a periodicity of 50 ticks of the clock.
The first column shows the non-optimised satisfac-
tion, the second represents the GA-optimised satisfac-
tion and the third column calculates the percentage of
improvement of applying GA.
Figure 3: Efficiency grouped per each 50 generations.
From these results we can state that GA outper-
forms clearly the non-optimised version, fact that
only on its own is not really noteworthy. However
our main goal with this development was to find a
easy methodology to use the Genetic Algorithm ap-
proach into a high uncertainty environment and over-
coming the computational time complexity inherited
of this kind of optimisation. We develop a new robust
methodology able to deal with uncertainty without the
help of any other extra tool or pre-knowledged distri-
bution.
One limitation of the stochastic random approach
is that the efficiency achieved depends strongly on the
EvolvingUrbanisationPolicies-UsingaStatisticalModeltoAccelerateOptimisationoverAgent-basedSimulations
179
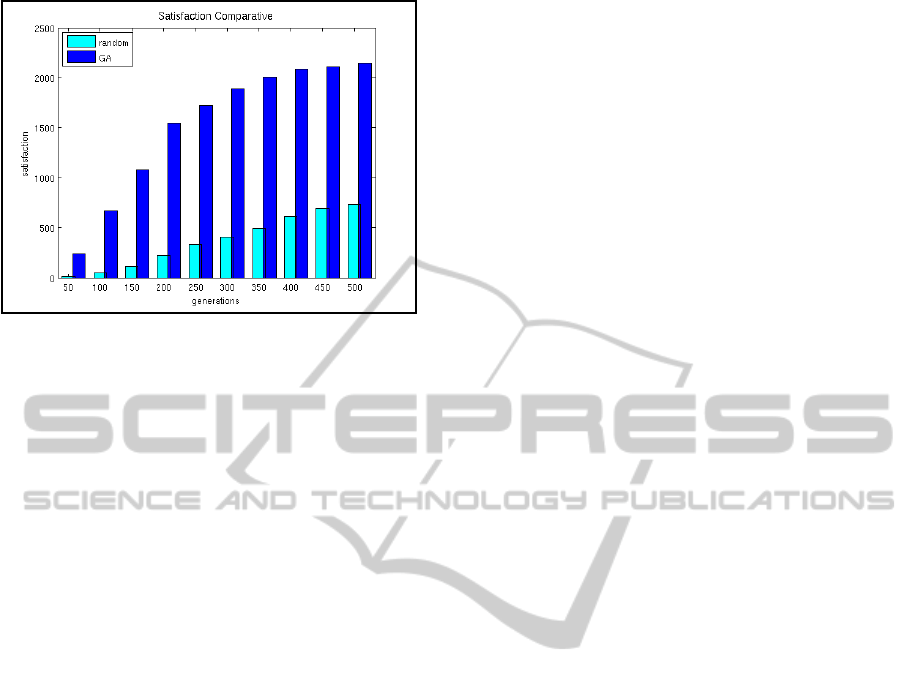
Figure 4: Discretised version of the satisfaction achieved by
the two approaches.
extension of the land analysed. On the other hand, a
possible drawback of the present approach is that it
requires to perform a large number of simulations be-
fore the optimisation can be carried out even if indi-
vidually each of them are not costly significant.
7 CONCLUSIONS
This paper reports on results from a proof-of-concept
study, which show that statistical model approxima-
tions can be used for policy optimisation. In particu-
lar, we show how we can capture and represent uncer-
tainty in an Agent-based Model using data from sim-
ulated runs and find optimal urban planning policies
using genetic algorithms.
The strategy is tested in a monocentric urban
model based on Alonso’s model where the main ob-
jective of the experiment is to distribute a set of green
protected areas throughout the lattice with the goal of
achieving the maximum satisfaction from the inhab-
itants of the city. An individual is considered to be
’satisfied’ if a green area is placed close enough to the
location of his residence.
The main observation that we draw from the work
presented here is that the appropriate prior use of un-
optimised simulations was effective in guiding the
GA to achieve successful outcomes. The specific ap-
proach we took is potentially applicable to a wide
range of applications which concern sequential deci-
sion making and require time-consuming simulations
to evaluate decisions.
8 FURTHER RESEARCH
The results on our case study suggest there is consid-
erable promise in our approach. The ability to suc-
cessfully address a wider range of optimization prob-
lems of this kind could lead to a new generation of
tools for use in urban planning.
However, in the meantime, various aspects of the
approach need further investigation. Among them are
three main directions:
Evaluation of Statistical Simulation-based Ap-
proaches for ABM Optimisation. Related research
fields, such as optimisation of natural dialogue strate-
gies, make use of similar simulation techniques to ap-
proximate real-world behaviour. In the case of spo-
ken dialogue systems, for example, user simulations
are build from small data set of real user interactions.
Similarly, we simulate the (uncertain) behaviour of an
ABM by estimating transition probabilities, i.e. pos-
sible impact of planning decisions, from a small set of
model runs. In future work, we want to explore how
evaluation techniques for user simulations can be ap-
plied to estimate the quality and policy impacts of our
ABM simulations (Rieser and Lemon, 2011).
Improving GA to Include Uncertainty for Sequen-
tial Decision Making Problems. In the previous ex-
periments we have used a variant of genetic algo-
rithms which does not explicitly encode uncertainty
endured by the model environment. In future work,
we plan to investigate advanced evolutionary algo-
rithms, such as X Classifier Systems (Wilson, 1995)
for sequential decision tasks, which explore similari-
ties between evolutionary approaches and Reinforce-
ment Learning and other a priori more traditional ap-
proaches like Reinforcement Learning.
Improve the Complexity of the Urban Model. In
particular, we plan to increment the complexity of our
current metric including factors like size of the urban
park and quality. We will also develop a new eco-
logical metric based on preserving the ecosystems of
the surrounding areas of the city and conduct exper-
iments to compare the trade-off between our current
metric and the new one.
REFERENCES
Allison, L. (1975). Environmental planning: A political and
philosophical analysis. Allen and Unwin (London).
Alonso, W. (1964). Location and land use. Publications of
the Joint Center for Urban Studies.
Brown, D. G. and Robinson, D. T. (2006). Effects of hetero-
geneity in residential preferences on an agent-based
model of urban sprawl. Ecology and Society, 11(1).
Byomkesh, T., Nakagoshi, N., and Dewan, A. (2010). Ur-
banization and green space dynamics in greater dhaka,
ICAART2013-InternationalConferenceonAgentsandArtificialIntelligence
180

bangladesh. Landscape and Ecological Engineering,
pages 1–14. 10.1007/s11355-010-0147-7.
Costanza, R., d’Arge, R., de Groot, R., Farber, S., Grasso,
M., Hannon, B., Limburg, K., Naeem, S., O’Neill,
R., Paruelo, J., Raskin, R., Sutton, P., and van den
Belt, M. (1998). The value of the world’s ecosystem
services and natural capital. Ecological Economics,
25(1):3–15.
Darwin, C. (1861). On the Origin of Species by Means of
Natural Selections: Or the Preservation of Favoured
Races in the Struggle for Life. Murray.
Devisch, O., Timmermans, H., Arentze, T., and Borgers, A.
(2009). An agent-based model of residential choice
dynamics in nonstationary housing markets. Environ-
ment and Planning A, 41(8):1997 2013.
Filatova, T., Parker, D., and van der Veen, A. (2009). Agent-
based urban land markets: Agent
´
s pricing behavior,
land prices and urban land use change. Journal of Ar-
tificial Societies and Social Simulation, 12(1):3.
Forsyth, A. and Mussachio, L. (2005). Designing small
parks : a manual for addressing social and ecologi-
cal concerns.
Giles-Corti, B., Broomhall, M. H., Knuiman, M., Collins,
C., Douglas, K., Ng, K., Lange, A., and Donovan,
R. J. (2005). Increasing walking: How important is
distance to, attractiveness, and size of public open
space? American Journal of Preventive Medicine,
28(2, Supplement 2):169 – 176. ¡ce:title¿Active Liv-
ing Research¡/ce:title¿.
Goldberg, D. E. (1990). A note on boltzmann tourna-
ment selection for genetic algorithms and population-
oriented simulated annealing. Complex Systems,
4:445–460.
Holland, J. (1975). Adaptation in natural and artificial sys-
tems. The University of Michigan Press.
Miller, E. J., Hunt, J. D., Abraham, J. E., and Salvini, P. A.
(2004). Microsimulating urban systems. Comput-
ers, Environment and Urban Systems, 28(1-2):9 – 44.
Geosimulation.
Newmann, J. V. (1966). Theory of self-reproducing au-
tomata. Arthur W. Burks ed. (University of Illinois
Press, Urbana IL).
Nowak, D. and McPherson, E. (1993). Quantifying the im-
pact of trees: the chicago urban forest climate project.
Unasylva, 44(173):39–44.
Otter, H. S., van der Veen, A., and de Vriend, H. J. (2001).
Abloom: Location behaviour, spatial patterns, and
agent-based modelling. Journal of Artificial Societies
and Social Simulation, 4.
Parker, D. C. and Filatova, T. (2008). A conceptual design
for a bilateral agent-based land market with heteroge-
neous economic agents. Computers, Environment and
Urban Systems, 32(6):454 – 463. GeoComputation:
Modeling with spatial agents.
Parker, D. C., Hoffmann, M. J., Deadman, P., Parker, D. C.,
Manson, S. M., Manson, S. M., Janssen, M. A., and
Janssen, M. A. (2003). Multi-agent systems for the
simulation of land-use and land-cover change: a re-
view.
Passow, S. S. (1970). Land reserves and teamwork in plan-
ning stockholm. Journal of the American Institute of
Planners, 36(3):179–188.
Pukkala, T. and Kurttila, M. (2005). Examining the per-
formance of six heuristic optimisation techniques in
different forest planning problems. Silva Fennica,
39(1):6780.
Qin, X., Huang, G., and Liu, L. (2010). A genetic-
algorithm-aided stochastic optimization model for
regional air quality management under uncertainty.
Journal of the Air & Waste Management Association,
60(1):63–71.
Rieser, V. and Lemon, O. (2011). Reinforcement Learn-
ing for Adaptive Dialogue Systems: A Data-driven
Methodology for Dialogue Management and Natural
Language Generation. Theory and Applications of
Natural Language Processing. Springer.
Rieser, V., Robinson, D. T., Murray-Rust, D., and Rounsev-
ell, M. (2011). A comparison of genetic algorithms
and reinforcement learning for optimising sustainable
forest management. In GeoComputation.
Riley, C. (2002). Comments on mills & evans. Proceedings
of seminar on Land Use Regulation, Lincoln Institute
for Land Policy. Cambridge Mass.
Robinson, D., Murray-Rust, D., Rieser, V., Milicic, V., and
Rounsevell, M. (2012). Modelling the impacts of
land system dynamics on human well-being: Using an
agent-based approach to cope with data limitations in
koper, slovenia. Computers, Environment and Urban
Systems. Special Issue: Geoinformatics 2010, 36(Is-
sue 2):164–176.
Sanders, L., .Pumain, D., Mathian, H., Gurin-Pace, F., and
Bura, S. (1997). Simpop: a multiagent system for
the study of urbanism. Environment and Planning B:
Planning and Design, 24(2):287–305.
Sasaki, Y. and Box, P. (2003). Agent-based verification of
von th
¨
unen’s location theory. Journal of Artificial So-
cieties and Social Simulation, 6.
Thorsnes, P. (2002). The value of a suburban forest
preserve: Estimates from sales of vacant residential
building lots. Land Economics, 78(3):426–441.
Tyrv
¨
ainen, L. and Miettinen, A. (2000). Property prices
and urban forest amenities. Journal of Environmental
Economics and Management, 39(2):205 – 223.
Wang, N. and Yang, Y. (2009). Target geometry match-
ing problem for hybrid genetic algorithm used to de-
sign structures subjected to uncertainty. In Evolution-
ary Computation, 2009. CEC ’09. IEEE Congress on,
pages 1644 –1651.
Wilson, S. W. (1995). Classifier fitness based on accuracy.
Evolutionary Computation, 3(2):149–175.
Wu, J., Zheng, C., Chien, C. C., and Zheng, L. (2006). A
comparative study of monte carlo simple genetic al-
gorithm and noisy genetic algorithm for cost-effective
sampling network design under uncertainty. Advances
in Water Resources, 29(6):899 – 911.
EvolvingUrbanisationPolicies-UsingaStatisticalModeltoAccelerateOptimisationoverAgent-basedSimulations
181
