
Semi-supervised Discovery of Time-series Templates for Gesture Spotting
in Activity Recognition
H
´
ector F. Satiz
´
abal, Julien Rebetez and Andres Perez-Uribe
IICT, University of Applied Sciences (HES-SO), Yverdon-les-Bains, Switzerland
Keywords:
Time Series Clustering, Template Discovery, Dynamic Time Warping, Activity Recognition.
Abstract:
In human activity recognition, gesture spotting can be achieved by comparing the data from on-body sensors
with a set of known gesture templates. This work presents a semi-supervised approach to template discovery
in which the Dynamic Time Warping distance measure has been embedded in a classic clustering technique.
Clustering is used to find a set of template candidates in an unsupervised manner, which are then evaluated by
means of a supervised assessment of their classification performance. A cross-validation test over a benchmark
dataset showed that our approach yields good results with the advantage of using a single sensor.
1 INTRODUCTION
Activity recognition is a research and application
topic that has been gaining interest in the last years
among the machine learning and pattern recognition
community. Identifying the activities performed by
a person can be useful for a lot of practical applica-
tions. In general, the activities executed by a user give
a meaningful context to the devices surrounding him
and therefore, these devices could change their be-
haviour as a function of their context. A large amount
of previous works focus on activity recognition using
a large number of sensors either in a single body lo-
cation (Lara et al., 2012), as well as in multiple body
locations (Sagha et al., 2011; Stiefmeier et al., 2008).
Our work is motivated by the use of as few sensors as
possible, hence we have tested the use of a single sen-
sor located in the right forearm. Moreover, we con-
sider the recent “history” of the sensor data instead of
basing the activity recognition on the features of the
raw sensor data during a single window of time. We
propose to use a semi-supervised approach for find-
ing gesture “fingerprints” that we further use as tem-
plates to perform gesture spotting. Several works in
the literature also coped with this issue. Ko et al. (Ko
et al., 2005) compared a group of pre-defined tem-
plates with the incoming signal using the Dynamic
Time Warping distance measure for performing con-
text recognition. Stiefmeier et al. (Stiefmeier et al.,
2008) used time-series quantization and an approach
based on a measure of distance between sequences
similar to the Longest Common Sub-Sequence simil-
arity measure. In this work, we decided to use a two-
steps approach in which (i) the incoming sequences
are grouped in an unsupervised manner in order to
find good candidates to gesture templates, and (ii) the
candidates are evaluated in a supervised manner by
comparing them with the ground truth (i.e., labels in
the database). The paper is organized as follows. Sec-
tion 2 makes an overview of the dataset, Section 3
gives the details about the features that were com-
puted from the acceleration data, Section 4 explains
the semi-supervised approach for gesture template
discovery, Section 5 exposes the results we found with
our approach, and Section 6 shows the conclusions we
drew from our experiments.
2 THE DATASET
We used a dataset from the UCI repository (Frank and
Asuncion, 2010) devised to benchmark human activ-
ity recognition algorithms called the OPPORTUNITY
Activity Recognition Dataset (Roggen et al., 2010).
For each one of the 4 subjects in the dataset there are
five daily activity sessions and one drill session which
has about 20 repetitions of some pre-defined actions.
We used the drill session of the first subject (S1) for
our tests. Moreover, we used only one sensor from the
72 available: the RLA inertial unit located in the right
forearm. The classification goals were the following
mid-level annotations:
573
F. Satizábal H., Rebetez J. and Perez-Uribe A. (2013).
Semi-supervised Discovery of Time-series Templates for Gesture Spotting in Activity Recognition.
In Proceedings of the 2nd International Conference on Pattern Recognition Applications and Methods, pages 573-576
DOI: 10.5220/0004268805730576
Copyright
c
SciTePress

Open/close fridge Open/close dishwasher
Open/close 3 drawers Open/close two doors
Open/close two doors Turn light on/off
Clean the table Drink standing/seated
3 DATA TRANSFORMATION
AND FEATURE EXTRACTION
As a first step we used a band-pass filter between
0.1 Hz and 1 Hz to extract the motility component of
the acceleration (Mathie et al., 2003). We then used
a sliding window of 16 samples
1
, overlapped 50 % to
compute some characteristic features. We computed
the average of the signal and the angle of the best lin-
ear segment that approximates the acceleration signal
within the window of 16 samples.
4 SEMI-SUPERVISED
DISCOVERY OF TEMPLATES
A template T for a given gesture G
i
is a sequence of
values S
j
which is closer to the sequences S generated
when gesture G
i
is executed, than to the sequences S
generated when other gestures G
k
(k 6= i) are executed.
This section describes the main steps of our approach
for discovering gesture templates:
1. Use raw data from a single accelerometer as input.
2. Band-pass filter to extract motility components.
3. Extract average and angle features.
4. K-means to create an alphabet.
5. K-medoids to find a vocabulary of common
words.
6. Select templates using f (0.5) score.
7. Perform gesture spotting using f (1) score.
4.1 Measures of Distance between
Sequences
There are several manners for assessing the similarity
or the distance between two sequences x = (x
0
, ..., x
n
)
and y = (y
0
, ..., y
n
). The simplest way to measure the
distance is to think of x and y as ordinary vectors in
R
n+1
and to use the Euclidean distance. Although ap-
propriate for short sequences, it does not cope well
with small delays or phase changes that are common
in longer sequences. On the other hand, the Dynamic
Time Warping (DTW) distance is robust to small lo-
cal variations in the speed of the sequences (Berndt
1
∼0.5 s given that signals are sampled at 30 Hz.
and Clifford, 1994), allowing the comparison of time
series that are similar but locally out of phase.
4.2 Quantization of the Time-series
We employed vector quantization to transform the
multi-dimensional signal of feature values (i.e., 3
axes, 2 features per axis) in a sequence of “symbols”.
This process makes the system less sensitive to noise
and outliers. We tested different codebook sizes, from
50 to 200. The size of the codebook affects the preci-
sion of the comparisons made by the measures of dis-
tance. We used the k-means algorithm (MacQueen,
1967) to build the codebook.
4.3 Unsupervised Sequence Clustering
We used unsupervised clustering to discover common
sequences which are good candidates to be gesture
templates. Unsupervised clustering groups similar se-
quences and links each group of sequences to a pro-
totype sequence. This natural grouping of similar se-
quences may (or not) correspond to the gestures done
by the person wearing the accelerometers.
We used the k-medoids algorithm (Kaufman and
Rousseeuw, 1987) for creating the groups of se-
quences
2
. We found groups of sequences of differ-
ent lengths, from 12 to 24 symbols in order to have
template candidates of different lengths.
4.4 Supervised Template Discovery
The prototype sequences found in an unsupervised
manner are candidates to be gesture templates. Thus,
each candidate was evaluated as a template for each
gesture. We used the f (β) score (Rijsbergen, 1979)
which estimates how accurately a candidate classifies
a particular gesture as such.
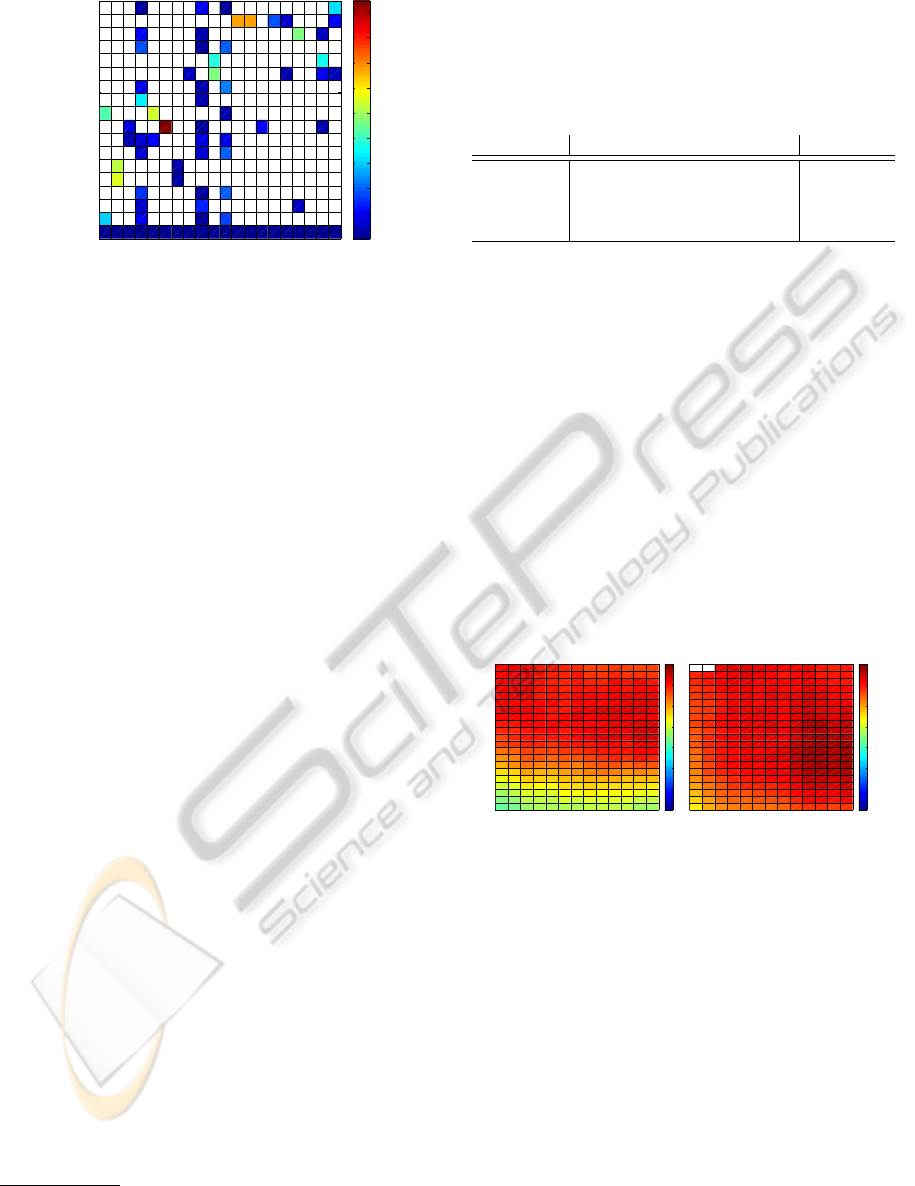
As an example, Figure 1 shows the f (0.5) score
3
obtained by using each one of a set of 20 prototypes
in detecting the gestures in the S1 Drill dataset. As
it can be seen in Figure 1, prototype 12 and 13 have
high scores (near to 0.7) for the gesture “drink from
cup”, and the prototype number 6 is a good tem-
plate for the “toggle switch” gesture. Moreover, it
2
This algorithm is very similar to the k-means algo-
rithm, with the difference that prototypes are not computed
by averaging the members of the group, but by choosing the
observation (sequence) that is closer to all the observations
in the group.
3
We give more emphasis to the precision than to the re-
call. Since several templates per gesture are allowed, we are
interested in finding templates matching correctly with the
gestures with as less false positives as possible, paying less
attention to the false negatives.
ICPRAM2013-InternationalConferenceonPatternRecognitionApplicationsandMethods
574
2 4 6 8 10 12 14 16 18 20
Null
Close Dishwasher
Close Drawer 3
Close Drawer 2
Close Door 1
Close Door 2
Close Drawer 1
Close Fridge
Toggle Switch
Open Dishwasher
Open Drawer 3
Open Drawer 2
Open Door 1
Open Door 2
Open Drawer 1
Open Fridge
Drink from Cup
Clean Table
0.1
0.2
0.3
0.4
0.5
0.6
0.7
0.8
0.9
Figure 1: Supervised discovery of templates. The colours in
the matrix represent the f (0.5) score of each one of the pro-
totypes when used for matching the annotated gestures. The
vertical axis corresponds to the gestures, and the horizontal
axis correspond to the prototype sequences.
can be seen that prototype 2 is a good template for
two activities (“close door 2” and “close door 1”) and
thus, these activities may be too similar and should be
merged. The automatic selection of gesture templates
is achieved by setting a threshold value th
templates
that
is compared with the f (0.5) score of the potential se-
quence prototypes. Prototypes having a f (0.5) score
higher than the th
templates
are selected as templates for
a given gesture
4
. More than one template per gesture
is allowed.
4.5 Gesture Spotting
Gestures in an incoming acceleration signal can be
spotted by comparing the incoming sequences with
the pre-defined templates. If an incoming sequence is
found to be sufficiently similar to one of the templates
of a given gesture, then this sequence can be labelled
as an occurrence of that gesture. We computed the
distance threshold as: threshold = mean(distance) −
th
sd
∗ std(distance) where th
sd
is a parameter that
modulates at how many standard deviation the thresh-
old is located from the average of the distance over the
whole dataset.
5 RESULTS
In this section we present some of the results of the
semi-supervised discovery of templates.
5.1 Parameter Exploration
The whole setup involves several parameters, and the
4
In this example there are some gestures without a valid
template. That is because for the sake of exmeplification we
intentionally kept a small number groups.
performance of the spotting depends of them. Table 1
shows a list of the parameters that were modified dur-
ing the experiments and the values we tested.
Table 1: A list of the parameters that were explored during
the tests, their description and their values.
Parameter Description Value
k k-means alphabet size [100, 250]
k
word
k-medoids vocabulary size [50, 100]
th
templates
Template selection threshold [0.3, 0.6]
th
sd
Gesture spotting threshold [1.5, 2.5]
Figure 2 shows the average f (1) score for all the
gestures in the S1 Drill dataset. We tested different
values of k, k
word
, th
templates
and th
sd
. In the case of
the Euclidean distance, varying parameter th
sd
(verti-
cal axis of each coloured grid) makes the f (1) change
more than varying parameter th
templates
(horizontal
axis of each coloured grid). Moreover, having more
candidate templates produces higher average values
of f (1). On the other hand, when using the DTW
distance, both parameters th
sd
and th
templates
make
the f (1) score to change and, as in the case of the
Euclidean distance, having more candidate templates
produces higher average values of f (1). An interest-
ing results is that, as expected, the use of the DTW
distance produces higher values of f (1) score than us-
ing the Euclidean distance.
0.3 0.325 0.35 0.375 0.4 0.425 0.45 0.475 0.5 0.525 0.55 0.575 0.6
1.5
1.55
1.6
1.65
1.7
1.75
1.8
1.85
1.9
1.95
2
2.05
2.1
2.15
2.2
2.25
2.3
2.35
2.4
2.45
2.5
th template
th classification
f1 ab 150 d 100
0
0.1
0.2
0.3
0.4
0.5
0.6
(a) Euclidean.
0.3 0.325 0.35 0.375 0.4 0.425 0.45 0.475 0.5 0.525 0.55 0.575 0.6
1.5
1.55
1.6
1.65
1.7
1.75
1.8
1.85
1.9
1.95
2
2.05
2.1
2.15
2.2
2.25
2.3
2.35
2.4
2.45
2.5
th template
th classification
f1 ab 150 d 100
0
0.1
0.2
0.3
0.4
0.5
0.6
(b) DTW.
Figure 2: Some results of parameter exploration with k =
150 and k
word
= 100. Each matrix of colours is built by
using the corresponding distance for comparing sequences,
and by changing two parameters: th
templates
on the horizon-
tal axis, and th
sd
on the vertical axis. The scale of colours
goes from 0 to 0.7.
5.2 Intra Drill Cross-validation
We employed the results showed in Section 5.1 for
selecting appropriate parameters for the selection of
gesture templates, and performed cross-validation
tests to assess the performance of the approach for
semi-supervised gesture spotting. We split the S1
Drill dataset in 20 parts, one per run, and performed
20 tests (i.e., leave-one-run-out cross-validation).
Each time we discovered the templates with 19 parts
and left the remaining part of the dataset for validating
Semi-supervisedDiscoveryofTime-seriesTemplatesforGestureSpottinginActivityRecognition
575

Table 2: Average f (1) score for the cross validation test. T stands for training and V stands for validation tests. The parameters
used are shown in the table.
Distance k k
words
th
templates
th
sd
T (µ, σ) V (µ, σ)
Euclidean 200 75 0.55 2.2 (0.61, 0.09) (0.43, 0.34)
DTW 200 75 0.55 1.9 (0.68, 0.08) (0.59, 0.32)
the approach by computing the f (1) score. Table 2
summarizes the results of the cross-validation test
As it can be seen from Table 2, using the Eu-
clidean distance for comparing sequences gives poor
results in the validation datasets. As expected, using
the Dynamic Time Warping distance yields better re-
sults since DTW is more appropriate for comparing
sequences given that it allows a non-uniform align-
ment between the two sequences being compared.
6 CONCLUSIONS
This paper presents a method for detecting gesture
templates in a semi-supervised manner. The experi-
ments demonstrated that using Dynamic Time Warp-
ing as the distance measure for the k-medoids algo-
rithm gave the best results when spotting gestures.
Our results for the cross-validation test are compa-
rable to the ones obtained by Sagha et al. (Sagha
et al., 2011). Both contributions use a window of
16 samples overlapped 50% and the average as fea-
ture. The main difference between both contributions
is that Sagha et al. use the information in a single
window for inferring the gestures, whereas we use the
information in a sequence of feature values from mul-
tiple adjacent windows. Amongst the tested classi-
fiers, they found that 1-NN has the best performance
with an average f (1) score of 0.53 on subject 1. It
is important to note that they use all the upper body
sensors while we only use one sensor located on the
right forearm (RLA). We obtained a validation per-
formance of 0.59 over subject 1, which is very close
to the best results found by Sagha et al. Moreover,
our approach has the advantage of using less sensors
and of not requiring the whole dataset in memory to
classify new gestures.
Finally, by requiring ground truth only for the
template selection stage (but not to find the candi-
dates), our approach for template discovery could be
used in a system that can create its group of templates
incrementally. For example, a system which asks for
user annotation when a previously unseen template
is discovered. The method is therefore more flexible
than a fully supervised method where all the possible
gestures would have to be defined beforehand.
ACKNOWLEDGEMENTS
The authors would like to thank Daniel Roggen and
the team of the wearable computing laboratory at
ETHZ for their valuable input. This work is part of
the project SmartDays founded by the Hasler Foun-
dation.
REFERENCES
Berndt, D. J. and Clifford, J. (1994). Using Dynamic Time
Warping to Find Patterns in Time Series. In Proc. of
KDD-94: AAAI Workshop on Knowledge Discovery
in Databases, pages 359–370.
Frank, A. and Asuncion, A. (2010). UCI machine learning
repository.
Kaufman, L. and Rousseeuw, P. J. (1987). Clustering by
means of medoids. Statistical Data Analysis Based on
the L
1
-Norm and Related Methods, pages 405–416.
Ko, M. H. et al. (2005). Online context recognition in multi-
sensor systems using dynamic time warping. In Proc.
of the International Conference on Intelligent Sensors,
Sensors Networks and Information Processing., pages
283 – 288.
Lara, O. D. et al. (2012). Centinela: A human activ-
ity recognition system based on acceleration and vi-
tal sign data. Pervasive and Mobile Computing,
8(5):717–729.
MacQueen, J. B. (1967). Some methods for classification
and analysis of multivariate observations. In Proc. of
the fifth Berkeley Symposium on Mathematical Statis-
tics and Probability, volume 1, pages 281–297.
Mathie, M. et al. (2003). Detection of daily physical ac-
tivities using a triaxial accelerometer. Medical and
Biological Engineering and Computing, 41:296–301.
Rijsbergen, C. J. V. (1979). Information Retrieval.
Butterworth-Heinemann, 2nd edition.
Roggen, D. et al. (2010). Collecting complex activity
datasets in highly rich networked sensor environ-
ments. In 2010 Seventh International Conference on
Networked Sensing Systems, pages 233–240.
Sagha, H. et al. (2011). Benchmarking classification tech-
niques using the Opportunity human activity dataset.
In IEEE International Conference on Systems, Man,
and Cybernetics.
Stiefmeier, T. et al. (2008). Wearable activity tracking in car
manufacturing. Pervasive Computing, IEEE, 7(2):42–
50.
ICPRAM2013-InternationalConferenceonPatternRecognitionApplicationsandMethods
576
