
The Wireless Sensor Network and Local Computational Unit in the
Neighbourhood Area Network of the Smart Grid
Zoya Pourmirza and John M. Brooke
School of Computer Sicence, University of Manchester, Oxford Street, Manchester, U.K.
Keywords: Smart Grid, Communication Network, Wireless Sensor Network, Energy Efficiency, Cluster based
Communication.
Abstract: The Smart Grid intends to provide good power quality, energy cost reduction and improve the reliability of
the electricity Grid. Electricity Grids exist across a wide hierarchy of voltages and spatial scales. In this
paper we particularly investigate the deployment of monitoring systems in the urban environment,
specifically in a university campus that is embedded in a city. Monitoring at this level of the Grid is very
underdeveloped, since most current Grids are controlled centrally and the response of the neighbourhood
area is not generally monitored or actively controlled. We develop a communications architecture that can
integrate sensor network applications. We provide both for sensors that directly measure the electricity
activity of the network and also sensors that measure the environment (e.g. temperature) since these provide
information that can be used to anticipate demand and improve control actions. Energy efficiency is a major
design driver for our architecture. Finally we analyse the optimal number of clusters in a wireless sensor
network for collecting and transmitting data to the local control unit for applying finer-grained control.
1 INTRODUCTION
In planning for future electricity supply issues such
as increased energy usage, urbanization, reduction in
personnel, global warming and conservation of
natural resources need to be considered. As the
result some countries have investigated the
transformation of their existing power grid to the so-
called Smart Grid. A Smart Grid adds a
communication network to the power network. Until
now most research has focused mainly on wide area
and home area communications networks.
Contrariwise we have investigated communications
in the neighbourhood area network (street level or
local area network) in the distribution sub-Grid. At
this level there is currently a lack of monitoring and
predictive real-time system control. We have
proposed an ICT architecture to integrate sensing,
computation and decision-making to enable
prediction of the future state of the sub-Grid in the
real-time. A Wireless Sensor Network (WSN) is
considered as an essential component of the
monitoring function. The WSN is responsible for
monitoring and collecting real-time data from the
field. It will send live data to a Local Control Unit
(LCU) to provide more accurate prediction. Since
these sensors are envisaged to be battery powered
our system design is aimed at investigating the
energy constraint problem of WSNs.
In this paper we focus on an urban area (street
level) of the Smart Grid, with the aim to support
Smart Grid applications. The remainder of this paper
is organized as follows: Section 2 demonstrates the
abstract view of our proposed architecture, section 3
discusses the deployment view, section 4 quantifies
the optimal number of clusters required in the
neighbourhood area of the Smart Grid. Finally
section 5 presents conclusions and future works.
2 THE COMMUNICATION
ARCHITECTURE
Noticing that the predictive real-time system
requires real-time information, our proposed
architecture (Pourmirza and Brooke, 2012) intends
to collect real-time data, analyse them, convert them
to information and finally based its action up on
them. It is a modular architecture that combines the
peer-to-peer and hierarchical architectures, to utilize
various communication technologies for transmitting
84
Pourmirza Z. and M. Brooke J..
The Wireless Sensor Network and Local Computational Unit in the Neighbourhood Area Network of the Smart Grid.
DOI: 10.5220/0004270900840088
In Proceedings of the 2nd International Conference on Sensor Networks (SENSORNETS-2013), pages 84-88
ISBN: 978-989-8565-45-7
Copyright
c
2013 SCITEPRESS (Science and Technology Publications, Lda.)
data. It represents the integration of sensor networks
and distributed computation.
The difference between our architecture and
other communication architectures in the Smart Grid
is that we are particularly linking it to the area in the
sub-Grid, where we are concerning about the energy
efficiency of the communication system. An
example of the recommended communication
network for the Smart Grid, bases itself on the
Gossip algorithm (Krkoleva et al., 2011) that
provides robust communication. It is believed to be a
suitable candidate for sub-Grid applications in Smart
Grid systems. However, since it does not take the
energy efficiency of the system in to account, it is
not the optimal solution for the WSN in our grid.
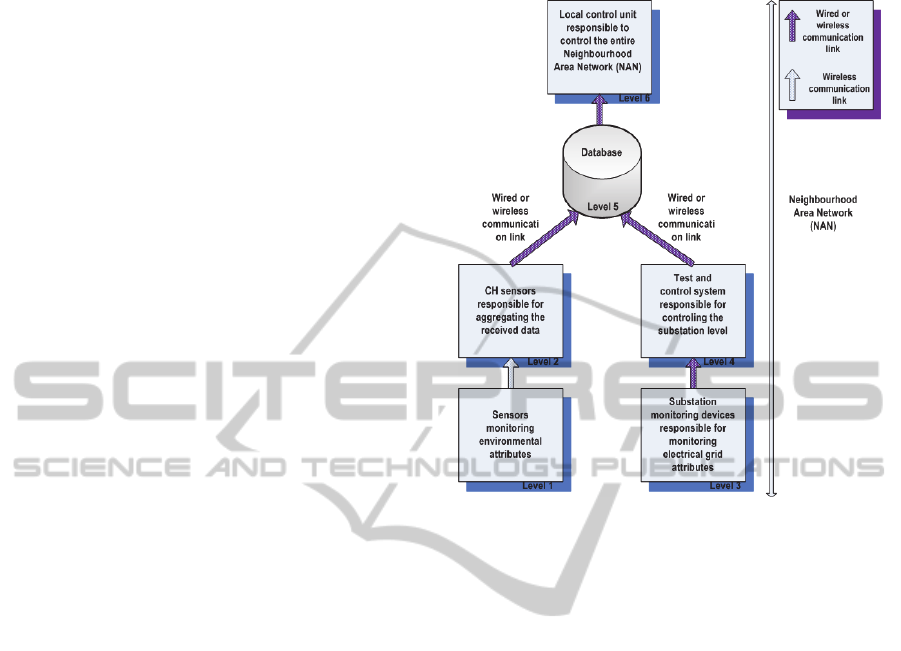
Our proposed architecture consists of six layers.
The first three layers are responsible for sensing,
measuring and collecting data. The other layers
present the database layer and two control layers.
In this paper we focus on the first two layers of
the architecture that are considered as a WSN. Due
to the energy constraint drawback of wireless
sensors, we intend to reduce their energy
consumption. As a result the cluster based
communication algorithm for WSN has been
selected as a method of communication.
Consequently, the first layer of the architecture
which is composed of hundreds of sensors situated
in the street areas are grouped into clusters, sending
their data via Bluetooth directly to the more
powerful sensor designed to be the Cluster Head
(CH). Since Bluetooth with extended antenna can
cover up to 100 meters, we believe it is a good
candidate for providing communication within the
clusters. These sensors sense attributes such as
temperature, humidity, traffic, motion, occupancy
and so on. The CHs, the second layer of the
architecture, are responsible for transmitting the
received data to the database via wireless LAN (e.g.
IEEE 802.11b) or cellular technology.
The third layer consists of few sensing units
located at the substation communicating via FTP and
TCP for transmitting live data to the test and control
unit using wired and wireless technologies such as
GPRS. These units monitor three phase voltages,
currents, frequency, and power factors and so on.
The fourth layer is a test and control unit that is
responsible for applying control over the substations
only. The fifth layer is the DB layer that will store
the aggregated data received from layers below, and
feed the LCU with collected data. The LCU, that is
the top layer will apply control over the entire
neighbourhood area. It can access sensing units
directly in emergency situations, or indirectly
through the DB layer in normal conditions.
Figure 1: Abstract view of the proposed architecture.
We present evidence (Section 4) that the proposed
architecture will bring energy efficiency to the
communication network. Given that the energy for
data transmission is higher than energy for data
computation (Heinzelman et al., 2000), by reducing
the transmission range and adding more computation
unit we may achieve an energy efficient architecture.
3 DEPLOYMENT
AND ASSUMPTIONS
This architecture is going to be deployed in the
university sub-Grid. The university campus is
embedded in a city, containing streets and road. The
whole campus is connected by rectangular grid.
The relevant WSN would be the streets
connecting the campus buildings (first and second
layer of the architecture). The relevant electrical
sensing would be the substations (third layer) that
are equipped with monitoring systems. In this
project the sensors cannot be deployed anywhere in
the grid. Since we are dealing with an urban area the
sensors are located at fixed locations. We choose to
put the sensors on the street level, which means we
are dealing with a rectangular grid.
The proposed environment is a heterogeneous
WSN in which the CHs are more powerful sensors
TheWirelessSensorNetworkandLocalComputationalUnitintheNeighbourhoodAreaNetworkoftheSmartGrid
85

than the cluster members. Since the sensors and CHs
are static and the CHs are predefined there is no
need to establish a connection between the sensors
and the CHs at the beginning of each round of
transmission. Establishing a connection happens
only once during the network lifetime, thus we
ignore the energy spent for handshaking in our
analysis.
For modelling the energy consumption of the
neighbourhood area network (NAN), we could
locate the LCU either in the centre or corner of each
area. Since neighbourhood areas need to talk
together, we have located the LCU at the corner of
the area to make their communication easier.
Moreover, having the LCU at the corner of one
neighbourhood area makes it at the centre of four
neighbourhood areas (figure 2). Thus by having one
LCU we can serve four neighbourhood areas, which
is efficient for installation costs and maintenance.
Figure 2: Each LCU (shown as a green rectangle) serves
four Neighbourhood Area Networks (NANs).
4 COMMUNICATION ENERGY
CONSUMPTION COST
The WSN suffers from the lack of resources such as
shortage of power and processing capabilities.
Difficulties arise when the deployed sensors in the
Smart Grid are short on power, thus a specific area
of the grid is no longer being monitored at a
sufficient rate. Given that real- time data is being
used in the control layer, this may result in wrong
decision making in the grid. In order to reduce the
energy limitation drawback of the wireless sensor,
we examine the energy consumption cost of a
network, and identify the optimal topology of the
WSN for the specific applications. Depending on the
purpose of the sensor network, the networking
topology, communication protocol and Quality of
Service (QOS) requirements may vary. This will
affect the design of the WSN architecture.
We create two scenarios. The first scenario is
direct communication where each sensor transmits
its data to the database layer in our architecture to be
controlled by LCU. The second scenario is cluster-
based communication, where a number of sensors
are grouped in to clusters and CHs are responsible
for compressing and transmitting the collected data
to the database. The result shows that cluster based
communication is more energy efficient than direct
communication in our specific network. A study on
the WSN (Prakash et al., 2009), also confirms our
result that the cluster-based networks provide more
energy efficiency. Their result allows the sensors to
be placed anywhere in a 2-D region, here we show
that the result also applies when the sensors are
constrained to be on a rectangular grid.
In the WSN each sensor consists of the sensing
unit, processor unit, and transmission unit. Each of
these units consumes energy while sensor is running.
In our analysis we have used a first order radio
model described in (Heinzelman et al., 2000) for
analysing the energy spent in transceiving the data,
energy used for sensing, and energy consumed for
data computation. First the sensors will spend the
energy on sensing the K bits of data (
. In order
to send the sensed data, the sensor will spent energy
for running the transmitter circuitry (
) and
energy for transmitting k-bit messages to destination
located at the distance d (
). Although the energy
spent during the communication does not quite scale
with the distance, but using the sensor coordinates
for analysing the distance is an approximation of
how much energy will be spent during the
communication (Heinzelman et al., 2002).
Moreover in the sensors which are responsible
for receiving, compressing and sending the data to
the next destination, the energy is used for running
the reception circuitry (
) plus the energy for
receiving the data (
) and energy for computation
(
). Given that the energy spent for a single
transmission is n times bigger than the energy spent
for single instruction execution (Hingne et al.,
2003), we assume the energy spent in computation
is
/. Table 1 demonstrates the energy
calculations used in our analysis and table 2 define
the parameters used in our calculations.
With the aim to achieve the most energy efficient
topology of a grid we should find the optimal
number of cluster in our specific network. As such
we divide the network in to different number of
clusters. We kept the number of sensors in the NAN
fixed and created networks with 4 clusters, 6
clusters, and so on, ending with 16 clusters. We
assumed that the CHs consume two times more
energy than the normal sensors. Then we simulate
each network by varying the number of nodes in the
clusters, cluster shapes and locations for 12 different
SENSORNETS2013-2ndInternationalConferenceonSensorNetworks
86
configurations, all of which preserve the number of
clusters, to estimate the variance. Since in reality we
are not always able to deploy the sensors in the most
optimal topology, we consider the average of these
12 configurations.
Table 1: Energy consumption for each section.
Energy calculation
Definition
Energy for sensing data
Energy for starting up the
transmitter circuitry
Energy for transmitting
data
Energy for computation
Energy for starting up the
reception circuitry
Energy for receiving data
Table 2: Parameter definition and representative values.
Parameter Value Definition
5∗10
Energy disseminated
by the radio per bit to
run the transceiver and
sensor circuitry
10
J b/m
⁄
Energy spent per bit
per m
2
for the transmit
amplifier
0.66 watt
Power used in
transmitter circuitry
0.395 watt
Power used in receiver
circuitry
0.001 second Start up time
2000 bits Number of bits of data
variable
Distance between
sending sensor and
receiving sensor
variable
Number of nodes in
each cluster
variable Number of clusters
3
Computation to
communication ratio
2
Compression ratio(e.g.
K bits of data are
compressed to k/2)
In this analysis we consider a rectangular grid in
which the LCU is located at the corner of the
network. Given these network assumptions, we
analyzed the total energy consumption in each
scenario. The total energy spent in the system is the
sum of energy spent by each individual sensor for
sensing and sending data to its CH called
,
plus the energy spent by the CHs to receive the
sensed data, compress them and send the
compressed data to the LCU called
.
(1)
1
1/
(2)
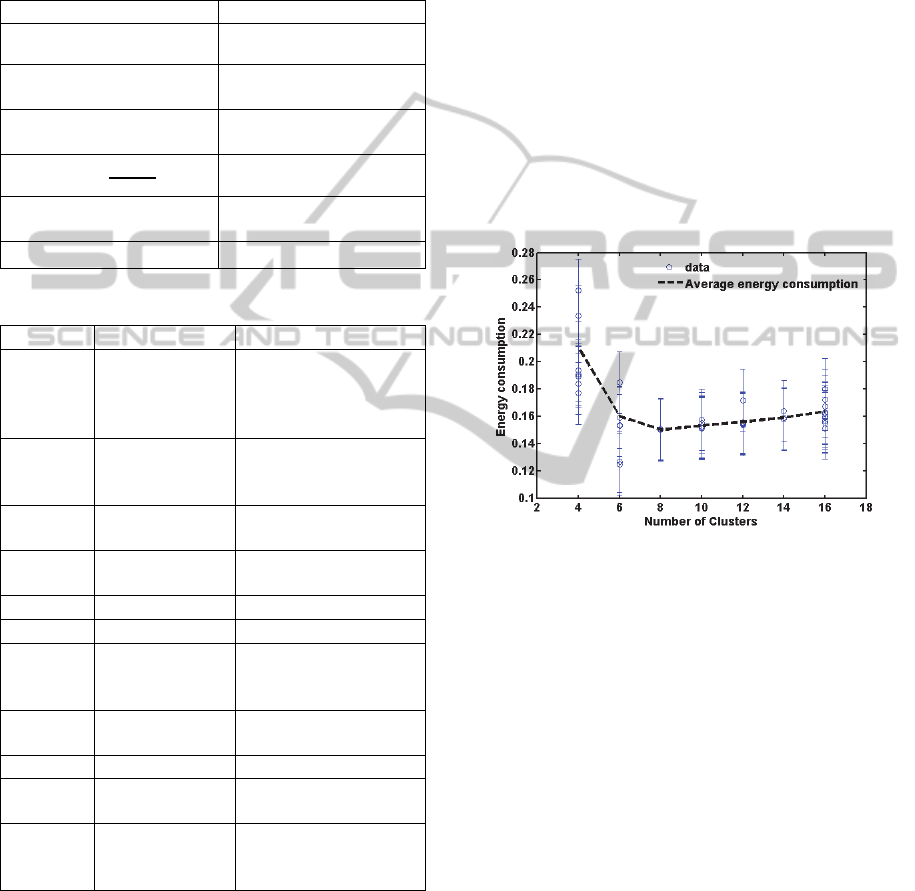
Figure 3 plots total energy consumption against the
number of clusters. The curve shows a minimum at
8 clusters. It also shows that the variation between 6
and 14 clusters is very small, i.e. the shape of the
minimum is asymmetric. The result that the
minimum occurs at 8 clusters is a function of the
total size of our grid (10x10) and the amount of
energy consumed by the CHs; however, the methods
could be used on grids of arbitrary size and CHs.
Figure 3: Energy cost analysis of a grid with different
number of clusters.
Additionally it has been concluded that the shape
and location of the clusters are also determining
factors for energy consumption. The results show
that if the clusters are rectangular, then the best
result is when the rectangle is square. Also we
observed that if we allow cluster sizes to be
different, then if smaller clusters
are near the LCU,
and bigger clusters are located farther from the LCU,
this improves energy efficiency. Figure 4 compares
the total energy consumption of a grid with 12
clusters, with different topologies. It shows how the
different arrangement of the sensors offers optimal
energy efficiency.
5 CONCLUSIONS
This paper has considered the neighbourhood sub-
Grid level of the electrical network where
monitoring has not previously been deployed. We
TheWirelessSensorNetworkandLocalComputationalUnitintheNeighbourhoodAreaNetworkoftheSmartGrid
87
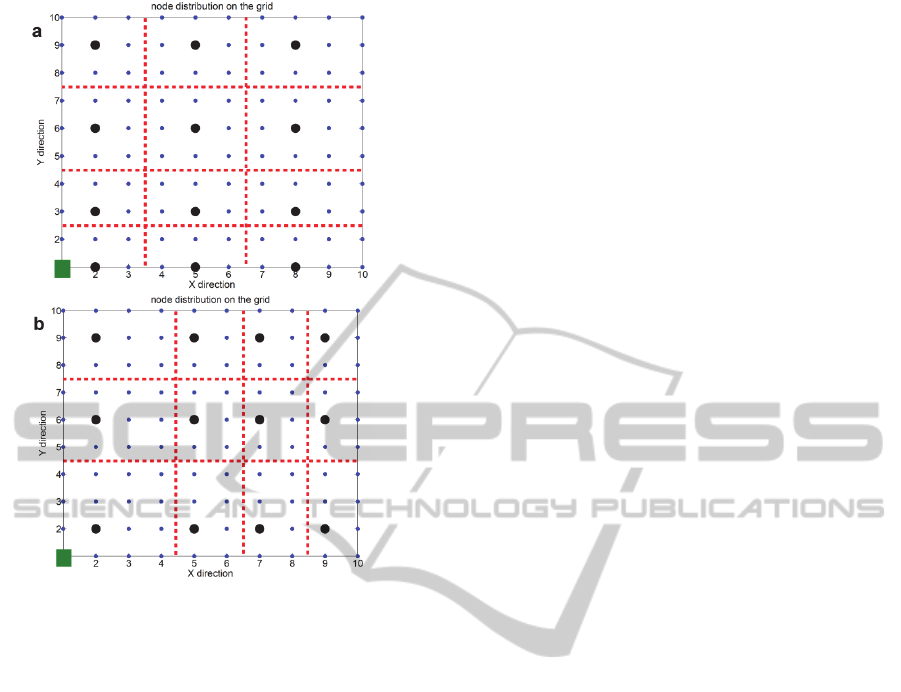
Figure 4: The effect of clustering location (CH is the black
circle) on the total energy consumption. In the first
topology E=0.1551, while in the second one E=0.1781.
have proposed a communication network
architecture and analysed its design in terms of
offering energy efficiency for a local control system.
We evaluated experimentally a WSN placed on a
rectangular grid representing a city environment.
The results confirm, for this environment, previous
results that cluster based communications are more
energy efficient than direct communications. By
varying the number of clusters we established that
there exists an optimal number of clusters in terms
of energy efficiency, for a given size of rectangular
grid. For a given number of clusters there are
particular arrangements of the clusters that give a
deeper minimum. Thus the number of clusters, their
shapes and the way the clusters are geographically
grouped are important in energy efficiency of the
system.
Finally a further study needs to investigate the
optimal data reduction algorithm to be used in the
WSN. The final stage of our work is to use the
collected data from the sensors to calibrate a
simulation that then can be used to test strategies for
control of the campus grid, providing a pattern for
control of local Smart Grids.
REFERENCES
Heinzelman, W., Chandrakasan, A. & Balakrishnan, H.
2002. An Application-Specific Protocol Architecture
for Wireless Microsensor Networks. IEEE
Transactions On Wireless Communications, 1, 660-
670.
Heinzelman, W. R., Chandrakasan, A. & Balakrishnan, H.
2000. Energy-Efficient Communication Protocol for
Wireless Microsensor Networks. In: Proceedings of
the 33rd Hawaii International Conference on System
Sciences-Volume 8, 2000. 820485: IEEE Computer
Society, 1-10.
Hingne, V., Joshi, A., Houstis, E. & Michopoulos, J. 2003.
On the grid and sensor networks. In: Grid Computing,
2003. Proceedings. Fourth International Workshop
on, 17 Nov. 2003 2003. 166-173.
Krkoleva, A., Borozan, V., Dimeas, A. & Hatziargyriou,
N. 2011. Requirements for implementing gossip based
schemes for information dissemination in future power
systems. In: Innovative Smart Grid Technologies
(ISGT Europe), 2011 2nd IEEE PES International
Conference and Exhibition on, 5-7 Dec. 2011 2011. 1-
7.
Pourmirza, Z. & Brooke, J. 2012. An experimental
communication architecture for monitoring and
control of sub-grids. In: smartgreens 2012 - 1st
International Conference on Smart Grids and Green
IT Systems, 2012 Porto, Portugal. 67-72.
Prakash, G. L., Chaitra, K. M., Poojitha, K. & Divya, R.
K. 2009. Effect of Clustering on Energy Efficiency
and Network Lifetime in Wireless Sensor Networks.
World Academy of Science, Engineering and
Technology 55, 526-531.
SENSORNETS2013-2ndInternationalConferenceonSensorNetworks
88
