
Evidence for the Relationship between Pilot Effectiveness, Surface
Anomalies, and Operational Efficiency Data
Daniel Howell
1
and Sherry Borener
2
1
MCR Federal LLC, 2601 Mission Point Blvd. Suite 320, Beavercreek, OH, U.S.A.
2
Federal Aviation Administration Aviation Safety Analytical Services, 800 Independence Ave., SW, Washington, DC, U.S.A.
Keywords: Aviation, Airports, Fatigue, Operational Efficiency, Taxi Time.
Abstract: To justify an investment in a safety-related program, the U.S. Federal Aviation Administration must develop
a business justification with a positive return on investment. While the assumed value of an avoided
aviation accident is quite large, the rarity of such events many times makes a business case built strictly on
safety metrics untenable. It is therefore helpful to examine if there are efficiency or capacity impacts related
to the investment. One area of interest to the aviation safety community is fatigue and pilot effectiveness.
Previous research has examined the connection between operator fatigue and accident frequency. In this
study, we examine the relationships between pilot effectiveness, measured surface anomalies, and archived
operational efficiency data at Atlanta Hartsfield-Jackson International Airport and Memphis International
Airport to provide evidence to support future taxi path conformance or crew rest requirement investments.
1 INTRODUCTION
Catastrophic airport surface accidents are thankfully
rare. To justify an investment in a safety-related
program the U.S. Federal Aviation Administration
(FAA) must develop a business justification with a
positive return on investment. While the assumed
value of an avoided accident is quite large, the rarity
of such events many times makes a business case
built strictly on safety metrics untenable. It is
therefore helpful to examine if there are efficiency
or capacity impacts related to the investment. For
example, the Airport Surface Detection Equipment –
Model X (ASDE-X) system is often described as a
runway-safety tool that enables air traffic controllers
to detect potential runway conflicts by providing
detailed coverage of movement on runways and
taxiways. While a reduction in projected accidents
played a role in the benefits estimate, the majority of
the quantified benefits in the final FAA business
case were related to possible increases in airport
efficiency related to better identification of aircraft
and better awareness of queue position and
sequence. (FAA, 2005)
The System Safety Management Transformation
program (SSMT), managed by the Office of
Aviation Safety Analytical Services, offers an
integrated safety management approach that will
provide a proactive strategy for building increased
safety into the air transportation system. SSMT
supports the FAA as it develops and implements
NextGen and manages the transition from the
current National Airspace System (FAA, 2011).
Because the investment decisions that are needed to
implement NextGen changes depend on the
complete business case and not just the safety case,
SSMT is developing benefits estimates that include
both safety and efficiency.
One area of interest to the SSMT program and
the wider safety community is fatigue and pilot
effectiveness. Previous research has examined the
connection between operator fatigue and accident
frequency for motor vehicles (Folkard, 2003 and
Blanco, 2011), the railroad industry (Hursh, 2009),
and aviation (Goode, 2003). Because aviation
accidents are so rare, we believe that relationships
between pilot effectiveness and operational
efficiency metrics will also be required to justify
related investments. In this study, we examine the
relationships between pilot effectiveness, measured
surface anomalies, and archived operational
efficiency data at two airports.
88
Howell D. and Borener S..
Evidence for the Relationship between Pilot Effectiveness, Surface Anomalies, and Operational Efficiency Data.
DOI: 10.5220/0004273302360241
In Proceedings of the 2nd International Conference on Operations Research and Enterprise Systems (ICORES-2013), pages 236-241
ISBN: 978-989-8565-40-2
Copyright
c
2013 SCITEPRESS (Science and Technology Publications, Lda.)

2 DESCRIPTION OF DATA AND
DATA SOURCES
2.1 Surface Anomaly Data
The ASDE-X system represents the most detailed
source of surveillance data available for airport
surface operations. Although the primary purpose of
ASDE-X is to support Air Traffic Control Tower
staff with a real-time display of the position of
airport objects (aircraft and vehicles), there are many
additional potential applications of the surveillance
data received by the system.
As support to the SSMT project, the Saab Sensis
Corporation developed algorithms and processes to
detect and characterize anomalies on the airport
surface and estimate the effect of these anomalies on
airport efficiency using the ASDE-X surveillance
feed (Waldron, 2009 and Borener, 2011). The
algorithms used in this study extracted three
categories of potentially anomalous behavior on the
airport surface: 1) sudden stops, 2) irregular turns
and 3) route excursions.
For this study the anomaly algorithms discussed
in the previous paragraph were applied to several
months of operations during calendar year 2010 at
two airports: Atlanta Hartsfield-Jackson
International Airport (ATL) and Memphis
International Airport (MEM).
2.2 Pilot Effectiveness Data
GRA, Inc. provided pilot effectiveness data
produced by CrewPairings, Inc. for the same airports
(ATL and MEM) as were used in the surface
anomaly study. The effectiveness values were
simulated values created using historical data over
three years (2008-2010) sent by six carriers to the
FAA for use in the January 2012 Flightcrew
Member Duty and Rest Requirements Rulemaking
(FAA, 2012). While the dates of the pilot
effectiveness data do not exactly overlap the surface
anomaly data, the SSMT program believes that it is
reasonable to use the entire dataset because it is
likely that pilot work schedules have been consistent
during the dataset time period. The data is limited
by the fact that it only represents 6 carriers and may
not be representative of the entire industry.
The pilot effectiveness score is a measure of
cognitive speed that indicates ability to perform a
given task. The scale is from 0 to 100. An
effectiveness score of 77 is roughly equivalent to
performance with a blood alcohol concentration
(BAC) of 0.05 and an effectiveness score of 100 is
equivalent to being completely rested. In certain
cases the effectiveness scores exceed 100, such as in
the case of a person receiving an afternoon nap prior
to the peak of the circadian rhythm.
In the following analyses, the data were
compiled to find mean and median effectiveness
values in 15-minute bins throughout the day for
arrivals and departures separately.
2.3 ASPM Operational Data
The Aviation System Performance Metrics (ASPM)
database is an online archive of operational data
compiled by the FAA Office of Policy and Plans
(FAA APO, 2012). The database provides
information on individual flight performance and
information on airport efficiency.
ASPM creates a record for each commercial
flight that includes a gate out (Out) time, a takeoff
(Off) time, a landing (On) time and a gate in (In)
time. Some of these times are gathered automatically
by ARINC using the automated Aircraft
Communications Addressing and Reporting System
(ACARS). The non-ACARS takeoff and landing
times in ASPM are estimates based on actual flight
track data and are quite accurate. However, the gate
in and out times for non-ACARS flights are based
on historical averages and may be incorrect by
several minutes for a particular flight (Howell,
2005). For analyses involving taxi times, we do not
use all the ASPM taxi times recorded in the
database, only those that have verified ARINC
OOOI data.
3 DATA ASSIMILATION AND
ANALYSIS
Data from the three sources described in Section 2
came in different formats and time intervals.
Construction of a useful data set for analysis
involved creation of variables that combine the
available data.
In the following analyses we start with the
ASPM individual flight records (as described in
Section 2.3) and modify the other data sources to
form additional information for each flight.
3.1 Binning Pilot Effectiveness
The Pilot Effectiveness data was isolated by values
for arrival and departure pilots and also binned into
EvidencefortheRelationshipbetweenPilotEffectiveness,SurfaceAnomalies,andOperationalEfficiencyData
89

15-minute periods. The median and mean values per
bin were calculated and associated with the Out time
for departures and the On time for arrivals. The
Pilot Effectiveness values represent an average over
multiple days in different years, not a record of
individual days during one year. The result is that
the pilot effectiveness scores are assumed to be the
same for each 15-minute period on each day in the
analysis. This is obviously a large simplification;
however, the SSMT program believes that it is
reasonable to use the entire dataset because it is
likely that pilot work schedules have been consistent
during the dataset time period.
As mentioned in Section 2.1, the anomaly data
used in our study did not have specific flight
information attached, so we did not attempt to
attribute anomalies to specific flights in the
following analyses. Instead we counted and
recorded the number of departure and arrival
anomalies that the airport experienced during either
the taxi-out time (from Out to Off) or taxi-in time
(from On to In) for each flight. Using this method
we are examining the system impact of an anomaly
as opposed to the impact of an anomaly on an
individual flight.
3.2 Surface Demand Estimation
A 2002 study (Idris, 2002) found the main factor
determining taxi-out time was queue length. Using
the ASPM individual flight data we do not have
enough information to determine specific runway
queue lengths over the time spans involved.
However, if we define a more general “Surface
Demand Out” for an aircraft to be the number of
takeoffs between an aircraft’s pushback and takeoff,
we can have a general measure that should relate to
runway queues.
We can also define a “Surface Demand In” as the
number of gate arrivals between an aircraft’s landing
and gate arrival as a measure related to congestion
an aircraft may experience as it approaches the gate.
The results section displays many graphs
associated with trends in Surface Demand In and
Out. The data shown in the graphs is limited to
values below the 95
th
percentile because many of the
larger surface demand values do not have enough
data to show a stable mean.
3.3 Relationship between Taxi Times
and Surface Demand
Previous studies have shown the trend in taxi time
with surface demand (Howell 2005 and 2007).
Because surface demand is a major predictor for
both taxi-out and taxi-in time, most of the analyses
presented in Section 4 are shown as variations in the
trend with surface demand.
4 RESULTS
The wealth of data described in Sections 2 and 3
suggest numerous different avenues for exploration
and several possible analysis techniques. As a first
step, we focus on using the data to answer the
following questions:
Can we detect a relation between anomalies and
taxi time?
Can we detect a relation between pilot
effectiveness and anomalies?
4.1 Anomalies and Taxi Time
To look at this question, we examine the trend in
taxi time vs. surface demand but segregate the data
between flights where the total anomalies
experienced during taxiing was above or below a
median value. Table 1 displays the median values
for the number of total anomalies (arrival +
departure) that occur per flight at each of the airports
during taxi-out and taxi-in.
Table 1: Median number of total anomalies that occur
during taxi-out and taxi-in.
Total anomalies that occur on surface (Median)
Airport During Taxi-out During Taxi-in
ATL 10 5
MEM 1 1
Figure 1 presents plots of the average taxi time vs.
the surface demand segregated by number of
anomalies. The error bars represent the 95 percent
confidence interval around the mean.
For both airports the average taxi-out time for
each value of surface demand out is greater when the
total number of anomalies is above the median.
Similarly, the average taxi-in time for each value of
surface demand in is greater when the total number
of anomalies is above the median.
Using the data behind the charts in Figure 1, we
can also develop some idea of the overall average
taxi time difference between aircraft experiencing
more or less anomalies. The average values in
Figure 1 are multiplied by the frequency of flights at
each surface demand value to find a total time
difference over the period of study (right side
ICORES2013-InternationalConferenceonOperationsResearchandEnterpriseSystems
90
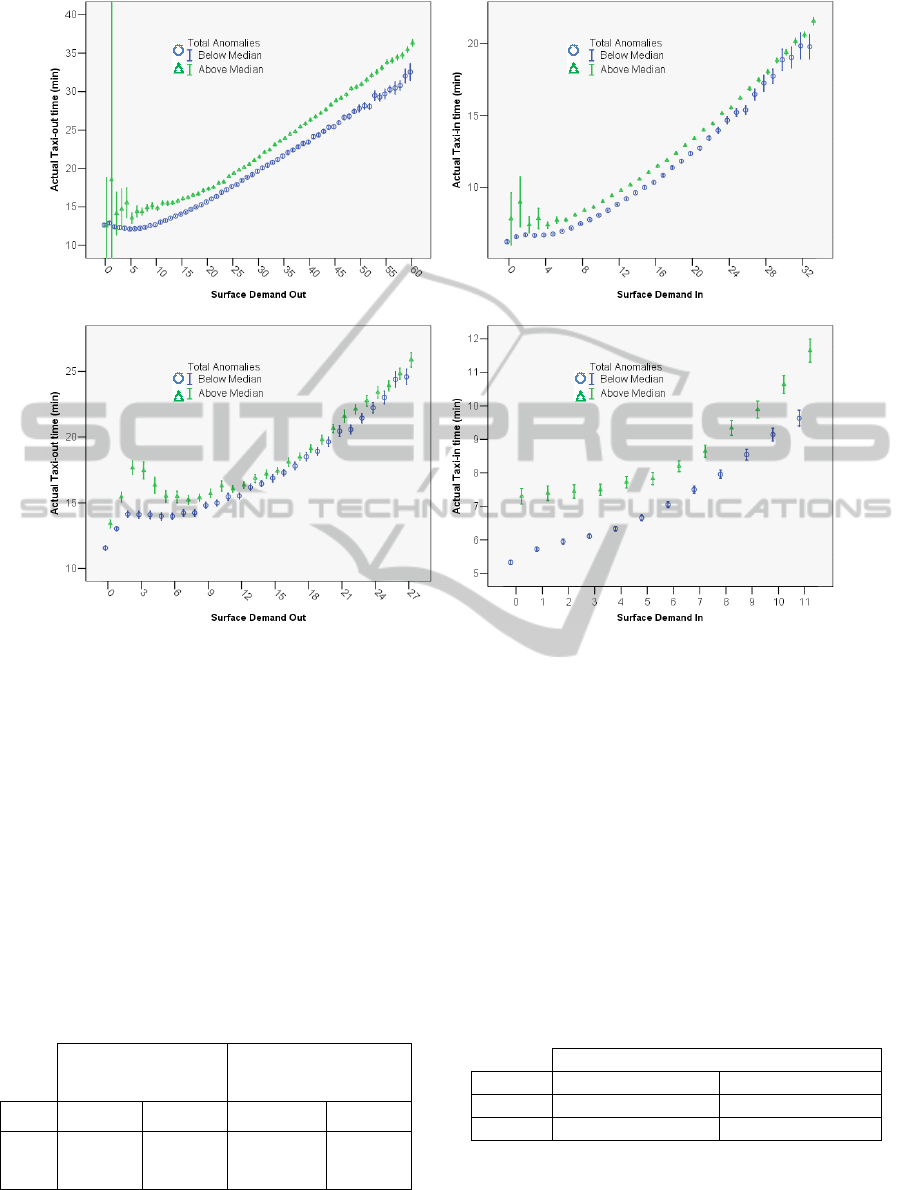
Figure 1: Taxi time vs. Surface Demand segregated by number of anomalies.
of Table 2). Dividing this result by the total number
of flights produces an overall average difference per
flight (left side of Table 2).
Table 2 shows the average difference in taxi time
is between 1.3 and 2.3 minutes for departures and
between 1 and 1.5 minutes for arrivals, comparing
times when the total anomalies are above and below
the median. The difference represents a large
opportunity in decreasing annual taxi-time if there is
a mechanism to reduce total anomalies.
Table 2: Average difference in taxi times between aircraft
when the airport is experiencing above or below the
median number of anomalies.
Average per aircraft
difference (min)
Annual airport
difference (hours)
Apt Departure Arrival Departure Arrival
ATL 2.27 1.01 16,877 7,465
MEM 1.29 1.45 3,123 2,563
4.2 Pilot Effectiveness and Anomalies
To look at this question, we examine the same trend
as was plotted in Figure 4 but segregate the data
between flights where the median pilot effectiveness
for flights departing or arriving during the same
period was above or below the overall median value.
Table 3 displays the median values for the overall
pilot effectiveness for arrivals and departures
separately as reported in the available data. It is
interesting to note that the median is greater than 90
at all sites and operations.
Table 3: Median Pilot Effectiveness recorded per
operation and airport.
Pilot Effectiveness (Median)
Airport Departures Arrivals
ATL 97.17 96.48
MEM 90.63 92.53
Figure 2 presents plots of the number of
departure anomalies vs. the surface demand out and
arrival anomalies by surface demand in segregated
by pilot effectiveness. The error bars represent the
ATL
MEM
EvidencefortheRelationshipbetweenPilotEffectiveness,SurfaceAnomalies,andOperationalEfficiencyData
91
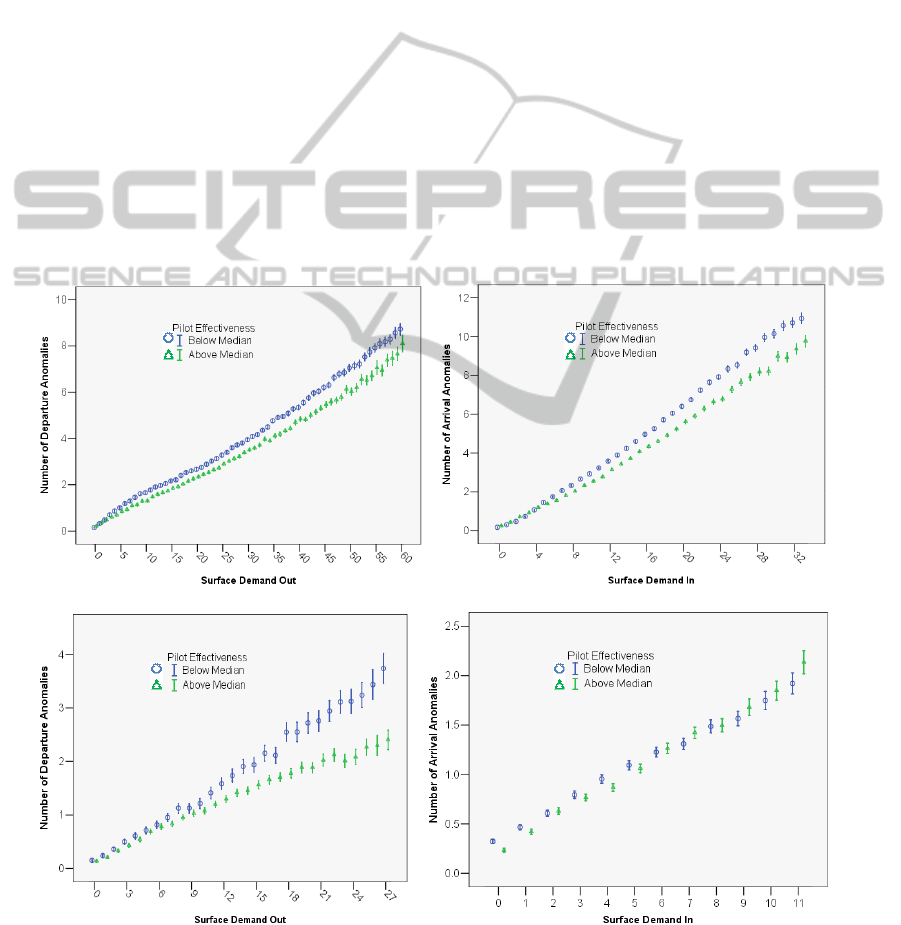
95 percent confidence interval around the mean. For
both airports the average number of departure
anomalies for each value of surface demand out is
greater when the departure pilot effectiveness is
below the median. This is the expected result since
lower values of pilot effectiveness relate to greater
fatigue.
However, the trend between number of arrival
anomalies and arrival pilot effectiveness is not as
clear. For ATL, average number of arrival
anomalies for each value of surface demand in is
greater when the arrival pilot effectiveness is below
the median, but no real trend exists for MEM.
It is possible that the median is not a good
threshold for segregating the data, but this does not
really explain the difference seen between the
departure and arrival results. Changes to the
threshold and different attempts at binning the data
will be attempted in future analyses.
Using the data behind the charts in Figure 2, we
can also develop some idea of the overall average
difference in number of anomalies seen between
aircraft arriving or departing during times of high or
low pilot effectiveness. The average values in
Figure 2 are multiplied by the frequency of flights at
each surface demand value to find an annual
difference in the anomalies seen by flights arriving
or departing during high and low periods of pilot
effectiveness over the period of study (middle of
Table 4), the same value as a percentage of the total
number of anomalies experienced (right side of
Table 4), and an average difference per flight (left
side of Table 4).
Table 4 shows the average difference in the
number of anomalies is less than 1 per flight,
comparing times when the pilot effectiveness is
above or below the median. On a per flight basis the
difference is not great, but represents a 13 to 26
percent difference in the annual number of departure
anomalies seen at these airports. As stated
previously, the trend with arrival anomalies is not as
clear.
Figure 2: Number of anomalies vs. Surface Demand segregated by pilot effectiveness scores.
ATL
MEM
ICORES2013-InternationalConferenceonOperationsResearchandEnterpriseSystems
92

Table 4: Average difference in number of anomalies when airport experiencing above or below the median pilot
effectiveness scores.
Average difference in anomalies
seen per aircraft during taxi
Annual airport difference in
number of anomalies
Percent difference in annual
number of anomalies
Airport Departures Arrivals Departures Arrivals Departures Arrivals
ATL 0.48 0.51 7,707 16,740 13% 14%
MEM 0.34 0.00 4,327 40 26% 0%
5 CONCLUSIONS
In this report we presented an analysis meant to find
evidence for correlations between pilot
effectiveness, surface anomalies, and operational
efficiency data gathered from three separate data
sources. The following conclusions can be stated:
Aircraft that are taxiing during periods with a
higher number surface anomalies experience, on
average, a longer taxi time even for the same
amount of surface demand (congestion).
Aircraft that depart during periods of low
departure pilot effectiveness experience, on
average, more departure anomalies. (Similar
results for taxi-in were not as clear).
Correlations like those above can be used to help
support safety-related investments using an
operational efficiency approach. For example, a
surface taxi path conformance program (either based
in the Air Traffic Control Tower or in the cockpit)
could use the relationship between taxi time and
anomalies to hypothesize a taxi time savings if
anomalies were reduced. The taxi time savings could
then be monetized in terms of reduced aircraft direct
operating costs and passenger value of time.
Similarly, a project looking at reducing pilot fatigue
through new crew rest requirements could use the
correlations to claim a reduction in anomalies and
associated taxi time in addition to accident risk
reduction.
REFERENCES
Blanco, M., Hanowski, R., Olson, R., Morgan, J.,
Soccolich, S., Wu, S.C., and Guo, F., 2011. The
Impact of Driving, Non-Driving Work, and Rest
Breaks on Driving Performance in Commercial Motor
vehicle Operations. Federal Motor Carrier Safety
Administration Report FMCSA-RRR-11-017.
Borener, S., Knickerbocker, C.J., Levy, B.S., Waldron, T.,
2011. Causality of surface movement anomalies at
KJFK airport. Presented at the 30th IEEE/AIAA
Digital Avionics Systems Conference (DASC), Seattle,
Washington.
Federal Aviation Administration Air Traffic Organization
Terminal Services, 2005. Business Case Analysis
Report for Airport Surveillance Detection Equipment,
Model X (ASDE-X). Washington D.C.
Federal Aviation Administration Aviation Safety
Analytical Services, 2011. System Safety Management
Transformation Program Plan Version 2.0.
Washington D.C.
Federal Aviation Administration, 2012. Flightcrew
Member Duty and Rest Requirements. Final Rule
2120-AJ58. [Online] URL:
http://www.faa.gov/regulations_policies/rulemaking/re
cently_published/media/2120-AJ58-FinalRule.pdf
[Accessed July 2012].
Federal Aviation Administration Office of Policy and
Plans (APO), 2012. Aviation System Performance
Metrics (ASPM) [Online]. URL: https://aspm.faa.gov/
[Accessed July 2012].
Folkard S., and Tucker P., 2003. Shift work, safety and
productivity, Occupational Medicine, 53 (3), pp. 95-
101.
Goode, J.H., 2003. Are pilots at risk of accidents due to
fatigue? Journal of Safety Research, 34 (3), PP. 309-
13.
Howell, D., 2005. Effect of Surface Surveillance Data
Sharing on FedEx Operations at Memphis
International Airport. Air Traffic Control Quarterly,
(13) 3, pp. 231-251.
Howell, D., Flanders, I. and Shema, S., 2007. Using
Surface Demand Trends to Evaluate Multiple Airport
Surface Initiatives. Presented at AIAA 7th Aviation
Technology, Integration, and Operations Conference,
Belfast, Northern Ireland, AIAA-2007-7765.
Hursh, S.R., 2009. Validation of the SAFTE Model of
Fatigue and Performance. Institutes for Behavior
Resources, Johns Hopkins University briefing.
Idris, H., Clarke, J-P., Bhuva, R., and King, L., 2002.
Queuing Model for Taxi-Out Time Estimation. Air
Traffic Control Quarterly, 10 (1), pp. 1-22.
Saab Sensis Corporation (2012) SSMT Update. Saab
Sensis Corporation June 2012 briefing to FAA Office
of Aviation Safety Analytical Services.
Waldron, T., Borener, S., Knickerbocker, C.J., Levy, B.S.,
2009. Extracting Potential Precursors to Airport
Surface Movement Incidents Using Available Ground
Surveillance. 6
th
Eurocontrol Safety R&D Seminar,
Munich, Germany.
EvidencefortheRelationshipbetweenPilotEffectiveness,SurfaceAnomalies,andOperationalEfficiencyData
93
