
OR-based Eco-efficiency Measuring for Economic-ecological
Trade-offs Analysis
L. Lauwers
1,2
and J. Van Meensel
1
1
Institute for Agricultural and Fisheries Research, Burg. Van Gansberghelaan 115, Merelbeke, Belgium
2
Department of Agricultural Economics, Ghent University, Coupure Links 653, Ghent, Belgium
Keywords: Eco-efficiency, Productive Efficiency, Data Envelopment Analysis, Materials Balance Principle.
Abstract: Traditional eco-efficiency measurements insufficiently support trade-offs analysis. The objective of the
paper is to explore trade-offs analysis support from the branch of productive efficiency analysis techniques.
The paper focuses on the linear programming based data envelopment analysis (DEA) models, adjusted for
an analogous treatment of the economic and environmental outcomes. In particular, the models are adjusted
for the materials balance principle. They allow for differentiating between win-win and trade-offs while
substituting for inputs or outputs. Their results are obvious for simple production processes, but the message
gets blurred with multiple inputs, outputs and outcomes. The paper explores multiple economic-ecological
trade-offs with materials-balance-based efficiency DEA models with a simple illustrative case of 62 typical
pig firms. Separate DEA models calculate technical, economic and the efficiency for nutrient, water and
energy use. Mutual win-wins and trade-offs are shown. Shortcomings are discussed and further model
adjustments based on directional distance functions, instead of radial ones, are proposed.
1 INTRODUCTION
Eco-efficiency indicators integrate economic and
ecological values in a ratio key figure (Dahlström
and Ekins, 2005) and compare performances on a
discrete basis. They fail to derive more continuous
management information on how an outcome, e.g.
the economic one, evolves when trying to improve
another, e.g. the environmental one. One solution is
to consider the underlying production process, and
to analyse drivers for both economic and
environmental outcomes. The production process is
a physical transformation of inputs into outputs
(Coelli et al., 2005). As such, it contains no
economic or ecological value, unless more
information is provided. Prices are necessary to
derive costs, revenues and profit. When linking
production data with materials balance information
also ecological values can be derived (Coelli et al.,
2007); (Lauwers, 2009).
Huppes and Ishikawa (2005) and Kuosmanen
and Kortelainen (2005) show how eco-efficiency
can be measured with frontier models. Reviews of
environmentally adjusted frontier models are given
by Tyteca (1996), Scheel (2001) and Lauwers
(2009). Two types exist: parametric stochastic and
non-parametric data envelopment analysis (DEA)
models. The first draws a functional form
enveloping a set of observed data, the second
envelops data with a piece-wise linear frontier. In
this paper, we concentrate on the non-parametric
methods, based on linear programming. An on-going
discussion in literature is how to incorporate the
environmental outcome in the production model and
to derive eco-efficiency. This paper will shortly
summarize this state-of-the-art in order to allow the
reader to get pace with the modelling challenges.
The objective of the paper is to explore multiple
economic-ecological trade-offs with materials-
balance-based efficiency DEA models. Trade-offs
are illustrated with one economic, profit, and three
environmental outcomes from a simple illustrative
case of 62 typical pig finishing firms. Besides DEA
models for calculating technical efficiency and
economic efficiency, similar models are conceived
for calculating the efficiency for nutrient, water and
energy use. This allows to derive their mutual win-
wins and trade-offs. Shortcomings are discussed and
further model adjustments are proposed.
339
Lauwers L. and Van Meensel J..
OR-based Eco-efficiency Measuring for Economic-ecological Trade-offs Analysis.
DOI: 10.5220/0004276201410144
In Proceedings of the 2nd International Conference on Operations Research and Enterprise Systems (ICORES-2013), pages 141-144
ISBN: 978-989-8565-40-2
Copyright
c
2013 SCITEPRESS (Science and Technology Publications, Lda.)

2 MODELS OF PRODUCTIVE
EFFICIENCY ANALYSIS
This section shortly describes, first, how productive
and eco-efficiency differ, but to a certain extent are
interlinked and, second, how these differences and
similarities can appropriately be modelled.
2.1 Productive and Eco-efficiency
Firms differ in efficiency to transform inputs into
outputs. For measuring a firm’s efficiency, frontier
functions are used. Frontier functions represent the
efficient transformation, this is no other firm can be
found that use less input for the same output, or
generates more output with the same input. The
distance of a firm’s input-output configuration to the
frontier is a measure for technical efficiency.
When price information is added to the physical
input-output transformation, economic outcomes
such as profit can be derived. More, the optimal
input-output combinations that maximise profit can
be searched. The concept of optimal combination of
input is measured as allocative efficiency.
The production process has various outcomes.
We consider an outcome as issuing from the net
utility or disutility of the set of outputs, corrected for
the sacrifices that had been put into the
transformation. As such, outcome is distinguished
from the mere physical output. When prices of
inputs (P
Xi
) and output (P
Yj
) are known, economic
margin (Π), e.g. profit, can be calculated as:
Π = ∑P
Y
j
* Y
j
- ∑ P
Xi
* X
i
(1)
The pressure a firm exerts on the environment is
another outcome, e.g. the nitrogen balance is an
indicator for disutility from by-products resulting
from pig finishing. When nitrogen contents of inputs
(N
Xi
) and output (N
Yj
) are known, the balance (B)
can be calculated similar to the economic margin:
B = N
Xi
* X
i
- ∑N
Y
j
* Y
j
(2)
Eco-efficiency measures how much profit is
obtained over the (potential) environmental burden:
Π / B (3)
2.2 Data Envelopment Models
Technical efficiency, TE, (θ) can be measured with a
linear programming model drawing a piece-wise
linear envelop around the data set. The general form
is described by the formula (4) – (7). For each farm
i, with (x
i
, y
i
) as input –output configuration, another
LP and efficiency score (θ) is obtained. Each
solution also gives a vector of weight λ that
determines the envelop, or production frontier. This
technique of deriving the frontier and a TE score is
called DEA, data envelopment analysis. Technical
inefficiency, as the distance from the actual (x
i
, y
i
)
to the frontier, can be measured in various way, the
model (4)-(7) measures TE from a radial input –
minimising perspective:
min
θ
,
λ
Θ (4)
s.t. - y
i
+ Y λ ≥ 0 (5)
θx
i
- X λ ≥ 0 (6)
λ ≥ 0 (7)
with:
(x
i
, y
i
) the input –output of farm i;
Y is the output matrix of all n firms;
X is the input matrix of all n firms;
λ is a scalar of weights.
With price information p
i
, economic efficiency
scores can be measured from similar models. The
model (8)-(11) results in a cost-minimising vector
x°
i
for each firm i:
min
λ
,
x°i
p
i
x°
i
(8)
s.t. - y
i
+ Y λ ≥ 0 (9)
x°
i
- X λ ≥ 0 (10)
λ ≥ 0 (11)
with:
(x
i
, y
i
) the input –output of farm i;
Y is the output matrix of all n firms;
X is the input matrix of all n firms;
λ is a scalar of weights;
p
i
is the vector of input prices
The economic efficiency CE is then calculated from
the observed cost-minimizing vector and the overall
optimum, OO (12), which then can be decomposed
in a technical, TE, and an allocative efficiency,
CAE, component (13).
CE= p
i
x°
i
/ OO (12)
CAE= CE / TE (13)
We build similar models with the resource use
coefficients n
i
, w
i
, and e
i
instead of the prices p
i
, and
search for the resource use minimizing vector.
Similar to (12), nitrogen (NE), water (WE) and
energy (EE) use efficiency can be calculated. As TE
remains the same over the four efficiency
ICORES2013-InternationalConferenceonOperationsResearchandEnterpriseSystems
340
measurements, the various environmental efficiency
scores then leads to nitrogen use allocative
efficiency (NAE), water use allocative efficiency
(WAE) and energy use allocative (EAE) score.
Scores estimate improvement potentials. TE
scores show the physical improvement margin,
which will not differ across the various outcome-
optimisation models. Regardless whether we want to
minimise cost or resources use, a radial contraction
of inputs will proportionally save on both objectives.
The interpretation of AE concerns the substitution of
inputs and provides a differentiated picture of trade-
offs.
3 RESULTS
3.1 The Pig-finishing Case
The pig-finishing process is used as a case with kg
marketable pig as desired output and feed and
piglets as the main variable inputs. In the short run,
the number of pig places (capital input) and labour
can be considered as fixed. The finishing activity
starts with a piglet of 23 kg and ending with a hog of
about 113 kg. This takes about 140 days, thus each
pig place can be occupied by more than one piglet
per year to finish as a marketable pig. A set of 62
typical farms are drawn from an original data panel
of about 300 farms over 3 bookkeeping years (2007-
2009). Summarizing statistics are given in table 1.
Table 1: Statistics of the data set of 62 typical farms.
Feature Mean Minimum Maximum
Y, tonnes marketable pig /year 262 56 771
Pig price, euro/kg 1.12 0.96 1.20
Nitrogen content pig, kg/kg 0.026 0.026 0.026
Feed input, kg/year 633 143 1944
Feed price, euro/kg 0.23 0.17 0.26
Nitrogen content feed, 0.025 0.025 0.025
Water use, liter per kg 1.59 1.06 2.22
Energy use, MJoule/kg 3.40 3.40 3.40
Number of piglets per year 2467 484 6216
Price per piglet 40 31 52
Nitrogen content, kg/ piglet 0.58 0.52 0.65
Water use, liter/piglet 462 328 614
Energy use, MJoule/piglet 827 718 971
3.2 Efficiency Analysis
Results of the various efficiency measures issuing
from the input-minimising approach, are given in
table 2. TE is 0.90, so improvement margins on the
farm set is about 10%. Cost allocative efficiency is
0.97, improvement margin is about 3%. Total cost-
minimising potential is about 13%. Improvement
potential on environmental performance is larger for
nitrogen, smaller for water and energy use.
Table 2: Statistics on the efficiency indicators.
Efficiency indicator Average Minimum MaxiMum
Technical efficiency 0.903 0.786 1
Cost allocative efficiency 0.969 0.846 1
Nitrogen all. efficiency 0.918 0.737 1
Water use all. efficiency 0.986 0.932 1
Energy use all. efficiency 0.977 0.879 1
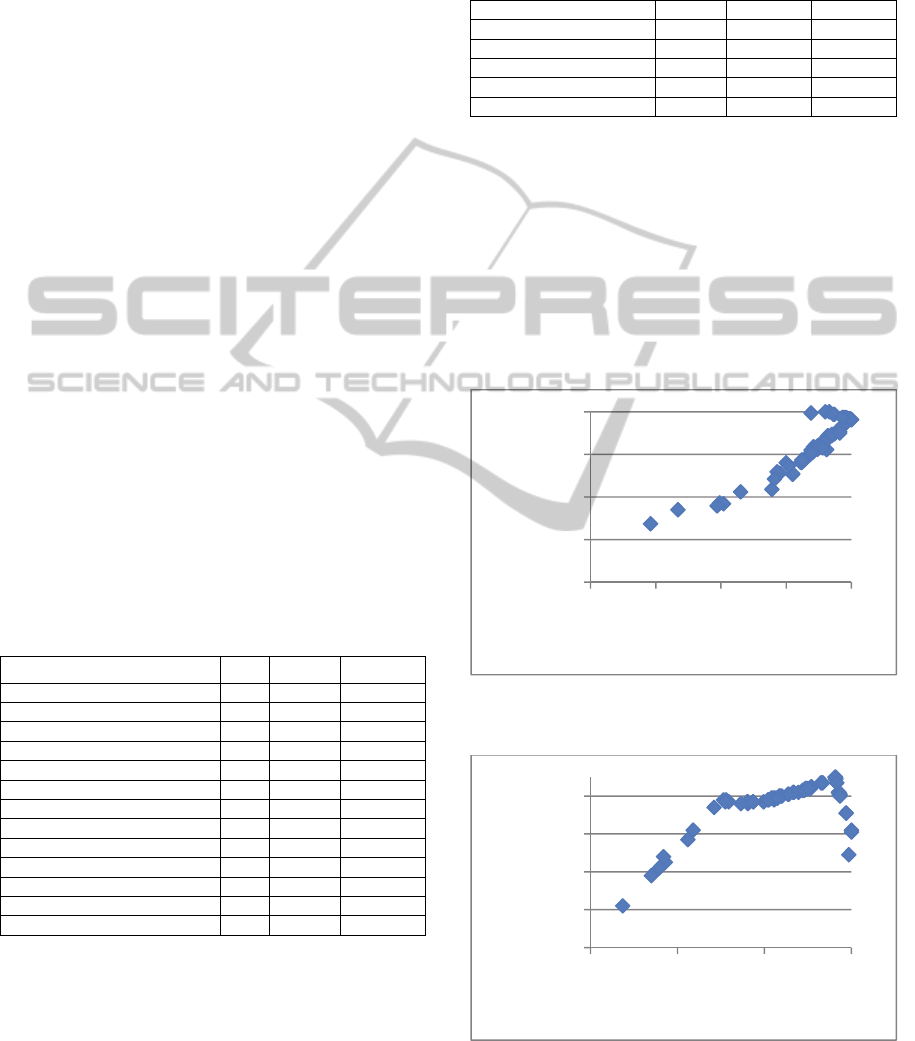
3.3 Trade-offs Analysis
Figure 1 show the link between CAE and NAE. A
majority of farms face a win-win when substituting
inputs for optimising costs: they will also win on
environmental performance. A minority faces trade-
offs. This confirms theoretical derivations (Lauwers,
2009). More atypical is, e.g. the link between NAE
and WAE (Figure 2). Other pairwise comparisons
yielded much more blurred information.
Figure 1: Win-win and trade-offs between cost (CAE) and
nitrogen allocative efficiency (NAE).
Figure 2: Win-win and trade-offs between nitrogen (NAE)
and water use allocative efficiency (WAE).
0,600
0,700
0,800
0,900
1,000
0,800 0,850 0,900 0,950 1,000
NAE
CAE
0,910
0,930
0,950
0,970
0,990
0,700 0,800 0,900 1,000
WAE
NAE
OR-basedEco-efficiencyMeasuringforEconomic-ecologicalTrade-offsAnalysis
341

4 DISCUSSION
The research reported in this paper confirms, to
some extent, previous trade-offs analysis results,
found for only one economic and one environmental
performance indicator (Van Meensel et al., 2010).
However, challenging observations are made and
needs further discussion. Some of the pair-wise
trade-off analyses deviate strongly from the ideal-
type differentiation between win-wins and trade-
offs. Moreover, extra inputs, e.g. labour and capital,
further blur this picture. Finally, improvement
margins seem rather low, which is not a big
problem, because small differences at the cost
minimisation side will be leveraged to bigger
relative differences at profit level, but the problem
rather becomes one of detecting causal links.
As the conventional approach show some
inconveniencies, other types of models need to be
explored on their ability to provide equivalent
information. From literature, we see at least three
eligible types of directional distance functions: one
based on a directional vector that is firm-specific
(see also Picazo-Tadeo et al., 2012), another based
on a profit maximisation model (see e.g. Singbo and
Lansink, 2010), and finally a similar one for
materials balance minimisation.
5 CONCLUSIONS
Environmentally adjusted data envelopment models,
built in an analogous way to the economic efficiency
model, yield allocative efficiency scores that support
economic-ecological trade-offs analysis. This
confirms that earlier work can be generalised, but
the multiple outcome (economic plus three
environmental) comparison that has been done in
this paper reveals that other paths for a more
integrated eco-efficiency and trade-offs analysis are
necessary. Eligible is the use of directional distance
functions.
REFERENCES
Coelli, T. J., Rao, D. S. P., O’Donnell, C. J., Battese, G.,
2005. An introduction to efficiency and productivity
analysis. Springer, New York.
Coelli, T., Lauwers, L., Van Huylenbroeck, G., 2007.
Environmental efficiency measurement and the
materials balance condition. Journal of Productivity
Analysis, 28, 3-12.
Dahlström, K., Ekins, P., 2005. Eco-efficiency trends in
the UK steel and aluminium industries: differences
between resource efficiency and resource productivity,
Journal of Industrial Ecology, 9, 171-188.
Huppes, G., Ishikawa, M., 2005. A framework for
quantified eco-efficiency analysis. Journal of
Industrial Ecology, 9, 25-41.
Kuosmanen, T., Kortelainen, M., 2005. Measuring eco-
efficiency of production with data envelopment
analysis. Journal of Industrial Ecology, 9, 59-72
Lauwers, L., 2009. Justifying the incorporation of the
materials balance principle into frontier-based eco-
efficiency models. Ecological Economics, 68, 1605-
1614.
Picazo-Tadeo, A. J., Beltran-Esteve, M., Gomez-Limon J.
A., 2012. Assessing eco-efficiency with directional
distance functions. European Journal of Operational
Research, 220, 798-809.
Scheel, H., 2001. Undesirable outputs in efficiency
valuations. European Journal of Operational
Research, 132, 400-410.
Singbo, A.G., Oude Lansink, A., (2010). Lowland farming
system inefficiency in Benin (West Africa): directional
distance function and truncated bootstrap approach.
Food Security, 2, 367-382.
Tyteca, D., 1996. On the measurement of the
environmental performance of firms - a literature
review and a productive efficiency perspective.
Journal of Environmental Management, 46, 281-308.
Van Meensel, J., Lauwers, L., Van Huylenbroeck, G.,
2010. Communicative diagnosis of cost-saving options
for reducing nitrogen emission from pig finishing.
Journal of Environmental Management, 91, 2370-
2377.
ICORES2013-InternationalConferenceonOperationsResearchandEnterpriseSystems
342
