
DAAPMed: A Data-aware Anchor Point Selection Tool for Medical
Models in VR Environments
Eva Moncl
´
us Lahoya, Pere-Pau V
´
azquez Alcocer and Isabel Navazo
´
Alvaro
ViRVIG-LSI, Universitat Polit
`
ecnica de Catalunya, c. Jordi Girona 1–3, Edif. Omega, 08034 Barcelona, Spain
Keywords:
3D interaction, 3D selection, Medical Visualization, Virtual Reality.
Abstract:
There is a number of problems where the analysis of medical datasets requires the selection of anchoring points
in 3D space, such as the measurement of anatomical structures (i.e. lengths of bones), pathological structures
(i.e. tumors), and the measurement of other elements such as the air contents in the lungs or the gut. Previous
research indicates that measurement tasks can be usually carried out more efficiently in VR environments than
in desktop-based systems. However, there is a lack of tools for measurement support for medical models in
VR environments. This paper presents a new VR-based interaction technique, Data-Aware Anchor Points for
Medical models (DAAPMed), specially focused on the efficient selection of 3D points in datasets rendered
using methods with semi-transparency such as Direct Volume Rendering. We will show that our method is
effective, precise, and reduces the amount of movements required to set the anchor points as compared with
other classical techniques based on clipping planes.
1 INTRODUCTION
In medical applications, the quantitative analysis of
spatial relations between structures is crucial for
many tasks such as diagnosis, treatment and surgical
planning, and documentation. These measurements
include, among others, the extension of pathological
structures or the distance between pathological struc-
tures and structures at risk (blood vessels). In the field
of Neurosurgery, for instance, distance between the
brain surface and the ventricles is an important pa-
rameter that may determine the surgical trajectory. In
a different field, digestologists are interested in per-
forming a morpho-volumetric analysis of the amount
of air in different organs such as the gut or the lungs,
for diagnostic purposes. In order to carry out these
quantitative analyses, researchers set several anchor
points using medical images as a support (Accarino
et al., 2009). However, the use of these 2D images
does not facilitate the perception of the relative posi-
tion of the structures, and as a consequence, it is often
rough for accurately locating anchor points and thus
obtaining precise 3D magnitudes.
Advances in volume visualization allow for the
3D reconstruction and analysis of anatomical struc-
tures from a stack of intensity-based images acquired
from, usually, CT or MRI modalities. Initial al-
gorithms identified and extracted the isosurfaces of
the anatomical structures as triangle meshes. This
process is time-consuming and loses contextual in-
formation. Later methods directly render the vol-
ume (Direct Volume Rendering, or DVR) by assign-
ing color and opacity to the samples as a function
of its density by using pre-defined transfer functions.
Semi-transparencies provide a means to increase the
amount of information visible to the users, and fa-
cilitate establishing spatial relationships between el-
ements such as the skin and the bones. This led the
development of new techniques for anchor point defi-
nition in desktop-based applications. However, occlu-
sions still remain as a problem for the selection. This
is often addressed with the introduction of clipping
planes showing the volume cut mapped on them.
Reitinger et al. (Reitinger et al., 2006) found that
measurement tasks can be carried out more efficiently
in a Virtual Reality environment than in a desktop
setup. The cost reduction of VR systems and GPUs
is helping the introduction of such systems in surgi-
cal planning and diagnose. Stereo vision facilitates
the perception of the relative position of anatomical
structures, although occlusion remains as a research
problem.
The purpose of this paper is to provide an easy-
to-use tool for the fast and accurate selection of 3D
points on the implicitly defined surfaces of anatomi-
cal structures present in a volume dataset in a virtual
308
Monclús Lahoya E., Vázquez P. and Navazo Álvaro I..
DAAPMed: A Data-aware Anchor Point Selection Tool for Medical Models in VR Environments.
DOI: 10.5220/0004287603080317
In Proceedings of the International Conference on Computer Graphics Theory and Applications and International Conference on Information
Visualization Theory and Applications (GRAPP-2013), pages 308-317
ISBN: 978-989-8565-46-4
Copyright
c
2013 SCITEPRESS (Science and Technology Publications, Lda.)

environment. It is important to note that we are not
interested in selecting a concrete structure, but a point
on it, without any previous surface extraction nor seg-
mentation process. Additionally, the occlusion prob-
lem remains, as well as the fact that a VR selection
environment is not familiar to medical experts.
The contributions of our paper are threefold:
• DAAPMed: An anchor point selection tool suit-
able for medical models in VR environments that
enriches the selection ray trajectory with the infor-
mation of candidate anchor points. These are au-
tomatically computed by performing an on-the-fly
isosurface detection along the ray (see Figure 1).
• A series of visual cues that provide feedback on
the ray position through the use of mirror views
and supporting planes.
• A user study that analyzes the accuracy and per-
formance of the selection, and compares with the
classical selection using clipping planes.
The implementation of all these components (both
GPU and CPU) guarantees real-time feedback and in-
teraction. This is an important issue in VR environ-
ments which require rendering the model twice.
The user study showed that our technique is effec-
tive, with an accuracy compared to a selection tool
in a desktop-based application with a mouse, and
more efficient. Furthermore, it also reduces the ef-
forts (hand displacements) and time required for the
selection as compared with a classical clipping plane
technique in a Virtual Reality environment.
Figure 1: User interacting with a model using the
DAAPMed metaphor.
2 RELATED WORK
In a pioneer work, Hinckley et al. (Hinckley et al.,
1994a) proposed a 3D user interface for pre-operative
neurosurgical planning based on the physical manip-
ulation of familiar real-world objects (head, cutting-
plane and stylus-shaped props) in free space to access
and manipulate a virtual model. This approach offers
the possibility of selecting anchor points in a brain
model. They use a clipping plane to access occluded
or interior points in the brain and then select anchor
points on it as the intersection of the linear trajectory
defined by the stylus and the cutting-plane. Qi and
Martens (Qi and Martens, 2005) also focused in de-
signing a 3D (tangible) user interface for the manip-
ulation of a clipping plane into a volume dataset in a
small size VR system (based on a 14” display), but
their system does not provide any selection mecha-
nism. More recently, Song et al. (Song et al., 2011)
propose the use of a touch mobile for manipulating
(positioning and orienting) a slicing plane. Since their
objective is exploration, they do not address the prob-
lem we are concerned with: anchor point selection.
Preim et al. (Preim et al., 2002) introduced a set of
applicable tools for the computation of distances, an-
gles, and volumes in 3D visualizations. The tools
are 3D virtual objects such as a distance line, a
ruler and angular measurements that are manipulated
using the mouse in a desktop-platform. They al-
low to determine anchor points on the surface of
the pre-segmented anatomical structures. Rossling et
al. (R
¨
ossling et al., 2010) proposed a method for the
automatic determination of different distance−based
measures (shortest distance, diameters and wall thick-
ness) also on segmented anatomic structures. The
necessity of this kind of tool is justified by the fact
that manual distance calculation is tedious and impre-
cise in single 2D slices, and although it is possible
to achieve an accurate result in 3D, it would also be
tiresome. However, completely automatic measure-
ments are difficult to generalize due to the great va-
riety of problems and anatomical structures. Notice
that both previous approaches (Preim et al., 2002;
R
¨
ossling et al., 2010) work on triangle mesh repre-
sentations, so a surface extraction process is needed
previously to use them. Moreover, they always se-
lect the nearest visible point and they do not deal with
semi-transparent models.
Reitinger et al. (Reitinger et al., 2006) presented a 3D
measurement toolkit developed for liver surgery espe-
cially tailored for a VR platform. Their measurements
include distance, volume, and angles. Their evalua-
tion indicated that VR-based measurement tools have
a sufficient benefit compared to 2D desktop-based
systems in terms of task completion time. In terms
of accuracy, slightly better results in most of the tasks
were achieved. The anatomical structures models
(liver, vessels,...) are computed through segmentation
DAAPMed:AData-awareAnchorPointSelectionToolforMedicalModelsinVREnvironments
309

from CT scans and they are represented by opaque tri-
angle meshes where the user may select points by us-
ing a virtual pencil. Hagerdorn et al. (Hagedorn et al.,
2007) proposed a set of tools for performing measure-
ments in a virtual reality visualization environment.
A 3D Rubberbanding line for selecting free points in
the scene is proposed. They use clipping planes for
accessing interior parts of the volume dataset. Their
scene is also composed by triangle meshes.
Segmentation and surface extraction are time con-
suming operations. To overcome this problem, Has-
treiter et al. (Hastreiter et al., 1998) suggest direct
volume rendering of the entire data volume, giving
insights to interior and superimposed information. In
order to inspect interior structures, independent clip-
ping planes provide an intuitive way to virtually cut
off parts of the volume data set. Then, anchor points
can be interactively placed on the clipping planes.
Gallo et al. (Gallo et al., 2008) present a Virtual Real-
ity system for the exploration of volume datasets us-
ing a Wiimote. Apart from the basic interaction tech-
niques for navigating they propose a mechanism of
selection of points based on the classical ray-casting
technique adding the mechanism of fishing reel in
which the users can move the cursor closer or farther
away by using two buttons in order to accurately lo-
cate a mark. Unfortunately, points’positions are not
aware of the isosurfaces and no visual cue is used to
reveal the cursor when it is moved into an occluded
region.
Many researchers have investigated 3D object se-
lection techniques for general -non medical- VR ap-
plications where the objects are represented by polyg-
onal meshes; they focused on improving the user ex-
perience in this kind of tasks (Bowman et al., 2004).
Ray-based techniques (Mine, 1995) have shown a bet-
ter performance than point-based techniques. These
former approaches are usually based on a cone or a
ray. Since our interest is on accurate anchor point
selection, we only consider ray-based tools. In or-
der to solve the inherent problem of multiple inter-
section candidates, several disambiguation techniques
have been proposed. Olwal et al. (Olwal and Feiner,
2003) describe the flexible pointer, a ray cursor tech-
nique that allows users to point around objects with
a curved arrow, to select fully or partially obscured
objects. It is important to note that most of these VR
selection metaphors are focused on selection and ma-
nipulation of objects (not points) in populated scenar-
ios, and thus they were not specially concerned about
accuracy in point selection.
Grossman et al. (Grossman and Balakrishnan,
2006) explored 3D selection techniques for volumet-
ric displays and proposed new ray cursor techniques
which provide disambiguation mechanisms for multi-
ple intersected targets. The Depth Ray tool augments
the ray cursor with a depth marker. The position of
this marker is changed dynamically moving the hand
forwards and backwards. As the hand also controls
the placement of the ray cursor, the two phases could
potentially interfere with each other. To solve it, they
propose the Lock Ray, a similar technique, where se-
lection and disambiguation phases are carried out se-
quentially, in a two-step process. First the user selects
the ray. Once it is locked, the depth marker appears.
Then, forward and backward hand movements fix the
depth marker and the intersected target closest to it is
highlighted in red indicating that it can be selected by
releasing the button.
Our approach also decouples the selection and dis-
ambiguation phases in two sequential steps (Gross-
man and Balakrishnan, 2006), though using a cy-
cling method for candidate selection (Hinckley et al.,
1994b). In contrast to these previous works, we
work directly with the captured volume dataset (using
DVR) without any kind of costly preprocess to extract
the isosurfaces.
3 DAAPMED METAPHOR
Our objective is a user-friendly, efficient, accurate
anchor point selection technique that facilitates get-
ting measurements in VR environments with medical
models. We also require ease of use and limiting the
amount of effort the user has to perform. In contrast
to normal desktop environment, where working with
a mouse allows the user to rest the arm, in 3D en-
vironments the user usually does ample arm move-
ments and has no surface to rest. With the objec-
tive of facilitating the integration with the special-
ists’ clinical work, we directly use the captured vol-
ume dataset rendered using DVR with a transfer func-
tion that shows semi-transparent and opaque struc-
tures (see Figures 1 and 2).
As a first approach, we extended and adapted to
3D the classical desktop point selection using a clip-
ping plane (see Figure 3). However, as shown in our
user study, this metaphor requires quite a long time
and large movements from the user, because the cor-
rect definition of a clipping plane suitable for poste-
rior point selection is difficult. In order to overcome
these limitations we have developed a ray-based ap-
proach that uses the data information to facilitate the
ray setting and point selection, reducing time and dis-
placements.
GRAPP2013-InternationalConferenceonComputerGraphicsTheoryandApplications
310
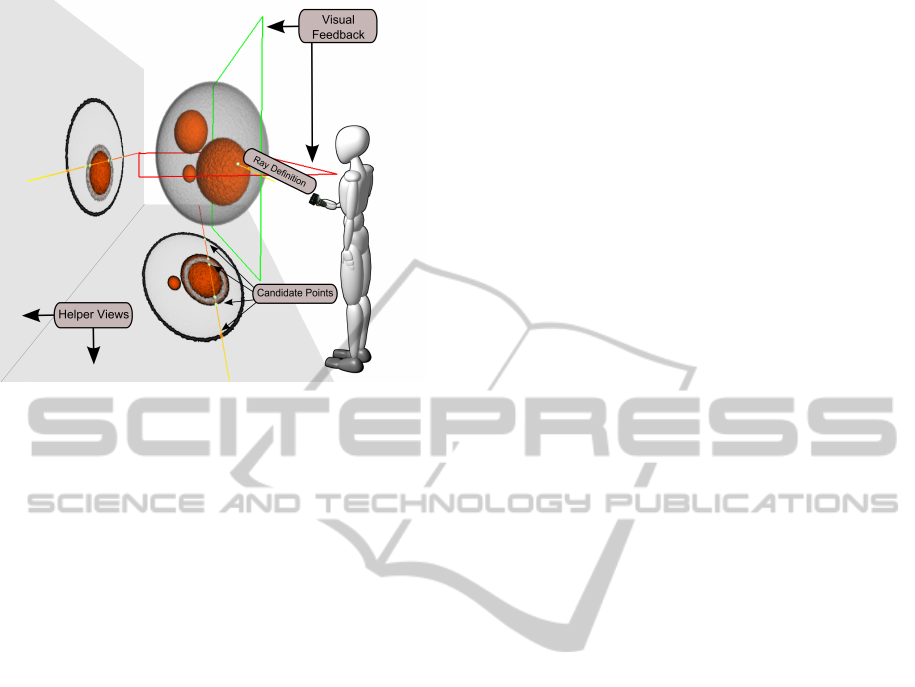
Figure 2: DAAPMed metaphor: A ray is used for selection,
and a couple of supporting planes help the user to locate
it in relation to the 3D structures. Potential anchor points,
represented by colored small spheres, are computed as the
intersections of the ray with the isosurfaces. Finally, Helper
Views provide a better perception of the ray position as well
as aids disocluding interior candidate points. Notice that the
bottom view shows that the large orange sphere is hollow.
3.1 Data aware 3D Selection Metaphor
Studies have shown that ray-based selection tech-
niques often result in faster selection times than hand
extension techniques in VR environments (Bowman
et al., 1999). Unfortunately, as commented previ-
ously, ray cursor techniques have an inherent prob-
lem: the ray may intersect multiple objects. A na
¨
ıve
approach simply selects the first target which is in-
tersected; however, it becomes very difficult or even
impossible to select occluded points. Thus a more
sophisticated method is required. The DAAPMed
metaphor has three main components (see Figure 2):
• Ray Cursor Tool. It casts a pointing ray through
the volume. The ray path visualization is enriched
with the candidate selection points and its sup-
porting planes, which provide a better insight of
its position and orientation.
• Helper Views. We provide two views that help
to understand the position of the ray inside the
volume. This extra-visualization is inspired by
the Magic Mirrors View (K
¨
onig et al., 1999), but,
instead of showing the whole model, our view
shows the model clipped by a plane that enables
the possibility of showing the ray trajectory with-
out any occlusion.
• Disambiguation Mechanism. Once the ray is
locked, we may select among the different in-
tersections of the ray with the isosurfaces in the
model. We adopt the same solution as Hinck-
ley (Hinckley et al., 1994b) cycling from one tar-
get to the next.
The key difference with previous selection meth-
ods is the ability to work with volumetric models by
automatically generating candidate points through a
rapid isosurface detection. Moreover, we also add vi-
sual cues that facilitate the understanding of the ray
position and orientation, and disocclude inner inter-
section points.
Figure 2 shows all the components involved in the
metaphor. In this example, the dataset consists of four
spheres of different materials. The metaphor works as
follows: when the user presses the back button of the
input device, the selection task starts and the ray is
painted with a gradient color from red to yellow (in
this way we provide users with a visual cue of the
depth of the ray). Throughout this process, the sys-
tem continuously computes the proper set of candi-
date points. This set is composed by all the intersec-
tions of the ray with the implicitly defined isosurfaces.
Upon button release, the last ray shown is locked,
meaning that the selection phase has finished and the
disambiguation task begins. The nearest candidate
point is marked in orange (default selection) and the
rest of the points are in white. The joystick provided
by the input device allows the user to cycle between
all the candidate points. This is convenient because
it reduces movements. Since candidate points may
have a random distribution, tracking the user’s move-
ment to reach all the candidate points without a large
arm movement (as proposed in (Grossman and Bal-
akrishnan, 2006)) would be difficult and might result
in large varying patterns for different rays of the same
volume.
As the 3D ray is painted over the volume, it is
sometimes difficult to interpret how the volume is tra-
versed. In order to give the user a second cue on the
intersection of the ray with the volume, we provide
the Helper Views. These showed to be of great utility,
since some candidate points are usually occluded by
other parts of the volume (Figure 1 shows a snapshot
of our technique and the accompanied video details
the interaction process). We augment the visualiza-
tion of the volume models with a wireframe represen-
tation of the cutting planes used in the Helper Views
in order to provide the users with a visual feedback of
the placement of such planes.
3.2 Implementation Details
In this section we give some details on how the isosur-
faces are detected in real time as well as on how the
DAAPMed:AData-awareAnchorPointSelectionToolforMedicalModelsinVREnvironments
311
Helper Views are created. One key difference with
other anchor point selection methods is the automatic
detection of isosurfaces on-the-fly along the pointing
ray. Since we have a non-segmented model, this iso-
surfaces must be determined in real-time, as they de-
pend on the transfer function. Throughout all the pro-
cess we use a DVR method using a GPU-based ray
casting.
3.2.1 Ray - Isosurface Intersection Detection
Volumetric models can be seen as a 3D scalar func-
tion f : V ⊆ ℜ
3
→ ℜ (e.g. density value of a mate-
rial). Let T F : ℜ → ℜ
4
be the transfer function used
in the volume rendering algorithm, that assigns color
and opacity to a scalar property. First of all, we have
to define the conditions that a point p of the volume
dataset V must fulfill to be considered a boundary-
surface candidate point. These are:
1. p must belong to a visible material. This
condition can be expressed formally as
opacity(T F( f (p))) > 0.0
2. p must belong to the boundary of a well-defined
isosurface. This condition is satisfied if:
(a) The gradient at point p, ∇ f (p), has to be well
defined. This means that k∇ f (p)k is larger than
a certain threshold. This threshold is automati-
cally set by a previous analysis of the range of
the magnitudes of the gradient.
(b) There exists a change in the sign of the direc-
tion of the gradient at p at the neighborhood
of p. This property expresses the fact that the
boundary passes through p.
Since the detection of the boundary condition
(2.b) may not be real-time in a VR environment, the
information necessary to test this condition is precom-
puted. This is carried out by applying a 3D edge de-
tection process (Monga et al., 1990) to the volume V
and storing the result in a 3D texture which consists
of a value per voxel that indicates the possibility of
being crossed by the boundary of a surface. The sec-
ond condition is tested by checking whether p belongs
to a boundary voxel. Our system guarantees testing
at least a point for each voxel intersected by the ray,
thus the accuracy of our approach is related to voxel’s
size. As shown in Section 4, we obtain an accuracy
comparable to that of both a clipping plane selection
approach and to a desktop application which works
with a triangle mesh models (not a volume model) for
the anatomical structures. This is due to the fact that
surface extraction methods also have an accuracy pro-
portional to the voxel size. Its computation is compa-
rable to the model loading time.
3.2.2 Helper Views
The goal of Helper Views is to provide additional in-
formation on the exact position of the ray inside the
volume. These views are drawn on two fixed planes,
located to the left (YZ) and bottom (XZ) of the vol-
ume dataset (see Figure 2). Images displayed on these
image planes are generated with the same algorithm
used for rendering the volume dataset but clipping it
by the plane that contains the ray and is the most par-
allel to each of the image planes YZ and XZ, respec-
tively. This has a main advantage: it shows the candi-
date points that lie inside the volume, therefore facili-
tating ray selection without previous manipulation of
the volume (i. e. clipping).
These views can also be adjusted by the user: they
can be rotated, moved, and the image projected onto
them may be zoomed. We provide a default orien-
tation with the planes slightly oriented towards the
viewer and at a relatively small distance from the ob-
ject that seems usable for several models. This default
orientation has been decided after a previous infor-
mal experiment with users that did not participate in
the user study. To facilitate its manipulation, the pro-
jection onto the Helper View plane is stored in a tex-
ture; therefore, the different operations on these views
come at no cost. Figure 2 shows the placement and the
visualization of the Helper Views design. The visual-
ization of the cut volume dataset is enhanced with an
illustrative motif:view-dependent contours computed
by using a Sobel kernel in order to enhance the sil-
houette of the clipped region.
4 EVALUATION AND RESULTS
We have conducted a formal user study to evaluate
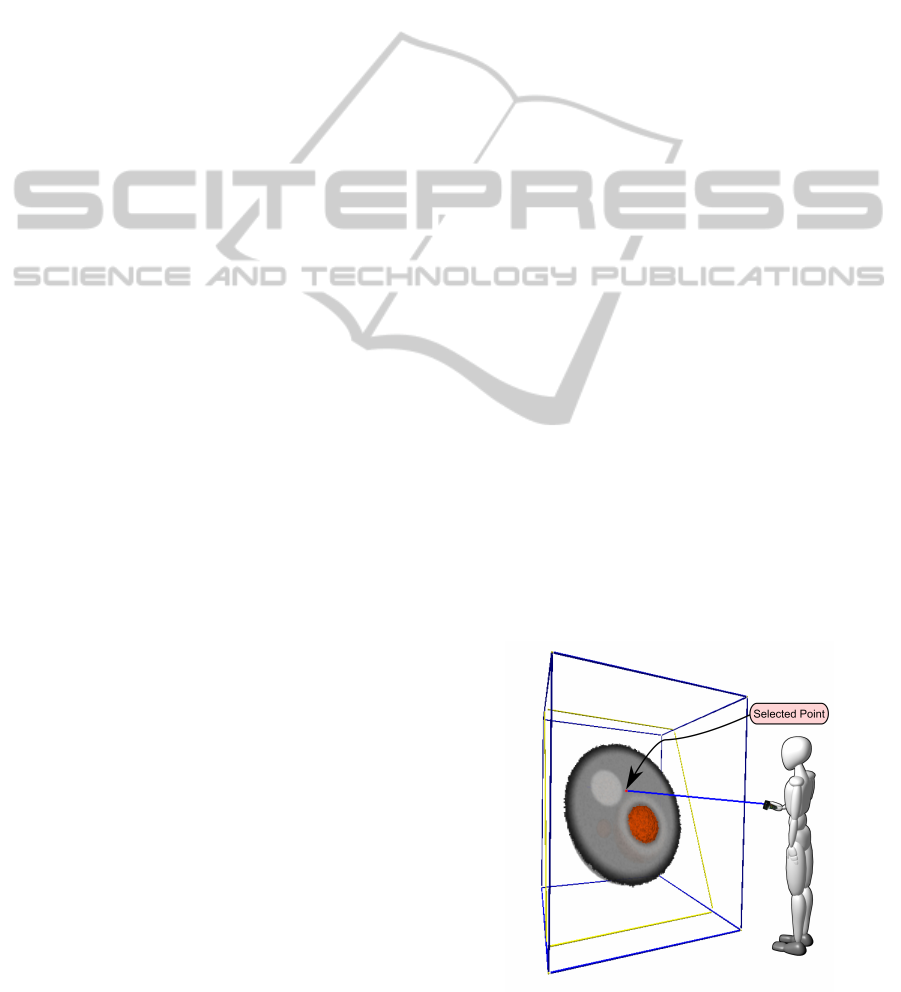
Figure 3: Adaptation to VR of the clipping plane technique
for selecting points located on it.
GRAPP2013-InternationalConferenceonComputerGraphicsTheoryandApplications
312

the accuracy, efficiency and ease of use of our ap-
proach. We take as a reference an implementation of
the Clipping Plane (CP) selection method, since it is a
technique that has been widely used in medical appli-
cations (see Section 4.1 for the details of our imple-
mentation). Furthermore, we have also compared the
precision of our technique with a typical desktop ap-
plication based on triangle meshes (see Section 4.3).
The results show that our technique is as accurate as a
desktop-based method and exhibits good timings. We
also found that the users required far less movement
with our system than with CP.
We performed the user study in an immersive vir-
tual reality setup composed of a 2.7 × 2 meters pas-
sive stereo PowerWall. Users were tracked using
an Intersense IS-900 Motion Tracking System device
consisting on a Head Tracker and a MiniTrax Wanda
with a joystick and five programmable buttons.
4.1 Design Details of the Clipping Plane
Technique in Virtual Reality
In order to compare our selection technique with the
classical approach for anchor point selection using
clipping planes (CP), we ported this metaphor the fol-
lowing way. Two buttons of the input device allows
the user to set the action to be performed: rotate or
translate the clipping plane. While the user is press-
ing the selected button, the clipping plane is rotated or
translated accordingly to the user’s hand movement.
The rotation is based in the paradigm of the Rolling
Ball (Hanson, 1992). The translation is always done
in the direction of the plane’s normal. Once the plane
is fixed, the user can select a point on it using the ray-
cursor paradigm. By pressing another button, the user
indicates the desired point, so every point inside the
volume, belonging to the plane, could be a candidate
point to be selected. However, due to changes in the
holding forces done by users when pressing or releas-
ing a button, called Heisenberg effect (Bowman et al.,
2002), the accuracy of the selection may be affected.
In order to solve this problem, we enhanced the visu-
alization of the ray with a freezing timer.
4.2 Test 1: Synthetic Points
Medical doctors often address two different point
selection problems: selection of well-established
anatomical points and distance measurement. As a
consequence, we decided to test two different tasks:
one regarding the selection of some specific points
and the other focused on performing the calculation
of certain measure.
In this first test, the points and distances shown to
he users are synthetic in the sense that they do not be-
long to relevant anatomical points common in medical
environments. In Section 4.3 we will address a case
more related to practical medicine.
In these experiments, we want to evaluate the effi-
ciency and the accuracy of our proposal with respect
the CP technique. Throughout the tests, we measured
several magnitudes that will provide information on
the amount of displacement (and thus, effort) each
technique requires. We recorded the following indi-
cators for each of the experiments in the test:
• Task Completion Time. We measured the amount
of time devoted to complete each experiment.
• Input Device Footprint. We measured the length
of the total path followed by the device to com-
plete each task.
• User Footprint. It measures the user displacement
inside the VR environment.
• Accuracy: This value measures the error in the se-
lection with respect to the reference points, taking
into account the dimension of the voxel dataset as
a metric of the error made.
• Hit Rate. This variable tracks the number of hits
the user has to do. Since each introduced point
may be changed if it is not satisfactory, we also
count the number of times a point is selected be-
fore its validation.
Data Preparation. We prepared two different
datasets. The first one was used for training, while
the other was used for the test. The training model
consisted of a set of four spheres of different material
(see Figure 4-left). The second model consisted of
a typical model in volume visualization, a CT tooth
dataset using a transfer function that enhanced the
outside and inner shape of it (see Figure 4-right).
Figure 4: The training (left) and testing (right) datasets. The
figures show the anchor points to be selected in the first ex-
periment.
Subjects and Procedure. 17 subjects participated in
the evaluation; 13 male and 4 female, ranging be-
tween 23 and 63 years old. Subjects were asked to
classify (as Low, Medium or High) their experience
in a VR setup, experience with input devices and ex-
pertise in 3D application. All of the participants were
DAAPMed:AData-awareAnchorPointSelectionToolforMedicalModelsinVREnvironments
313
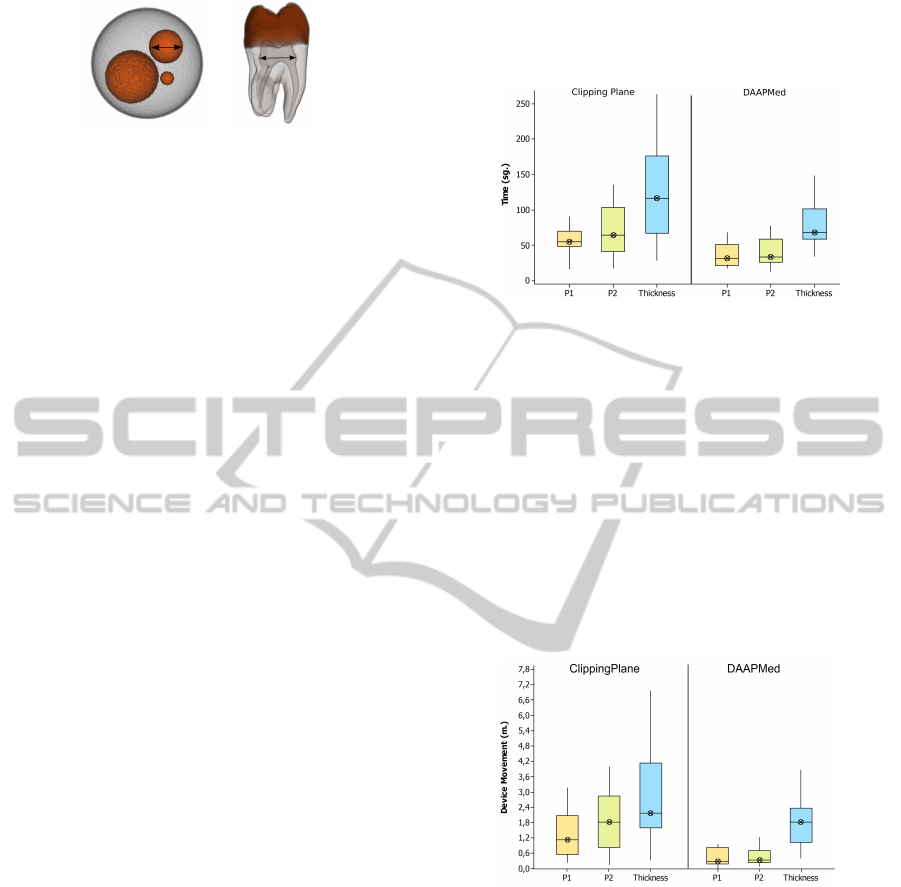
Figure 5: Images that show the second experiment descrip-
tion, as presented to the participants in the test.
people from our department. Computer scientists at
different levels of studies (master and PhD students)
and faculty staff.
Every user performed both experiments once. Be-
fore the first experiment started, a complete training
(using the spheres dataset) was performed to get fa-
miliar with the two interaction techniques to evaluate:
DAAPMed and CP techniques. The test was divided
into two blocks, one for each technique. The order
of the blocks was chosen randomly in order to avoid
skewing one of the techniques with a learning effect.
As said before, the test consisted of two kind of
experiments: selecting two predefined points, and
measuring a certain magnitude defined by two points.
For the first experiment, we asked the users to intro-
duce two anchor points (P
1
and P
2
) at positions that
were marked in the model with the use of a cone rep-
resentation (see Figure 4). Once completed, we stop
tracking the movements of the user until she is ready
for the next experiment. The second experiment con-
sisted of taking a measure (calculated as a distance
between two anchor points). We refer to this calcu-
lation as Thickness. The specification of this exper-
iment was accompanied with different descriptions
and pictures of the goal (see Figure 5). None of the
users involved in the experiment had any problem un-
derstanding the objective of the experiment. Users
can repeat the selection of a point as many times they
need. But once the point was validated by the user, he
or she could not repeat its placement.
4.2.1 Results
A repeated measures within subjects design was used.
The independent variable was the technique and the
dependent variables were the set of tracked variables.
A one-way analysis of variance (ANOVA) comparing
both techniques was use.
Table 1 summarizes the statistical analysis of the
relevant variables. For each variable the mean and the
standard deviation are shown. The first experiment is
tagged as P
1
and P
2
, corresponding to the two anchor
points. Second experiment is tagged as T hickness.
Regarding Completion Time, there is significant
evidence in all the experiments that DAAPMed per-
formed better than CP. For P
1
(p = 0.028, F = 5.83),
for P
2
(p = 0.008, F = 9.35) and for Thickness (p =
0.044, F = 4.79). Figure 6 shows the total time for
each technique.
Figure 6: Results of the completion task timings. The boxes
show the interquartile range with the median as the horizon-
tal bar. The whiskers extend to the minimum and maximum
of the data. CP exhibits longer selection times.
Regarding Input Device Footprint, we measured
the length of the total path which the device took to
complete the experiment. We have found a significant
effect on the Input Device Footprint variable for P
1
(p = 0.036, F = 5.24) and for P
2
(p = 0.004, F =
11.70). Figure 7 illustrates the effect. The reduction
of footprint is especially important since a handheld
6-DOF device is being used, which can lead to fatigue
with extended use (Ware and Slipp, 1991).
Figure 7: Input device footprints. The boxes show the in-
terquartile range with the median as the horizontal bar. The
whiskers extend to the minimum and maximum of the data.
For point selection it is clear that DAAPMed method per-
formed significantly better than CP.
We also split the movement done by the device
taking into account whether the movement was due
to an exploration phase (rotating or translating the
model) or due to the selection phase. We have only
found significative statistical difference between the
two techniques for P
2
(p = 0.007, F = 9.44), for the
rest of the experiments DAAPMed performed bet-
ter comparing means and standard deviations. With
CP technique, the user performs similar amount of
moves during navigation and during selection. On
GRAPP2013-InternationalConferenceonComputerGraphicsTheoryandApplications
314
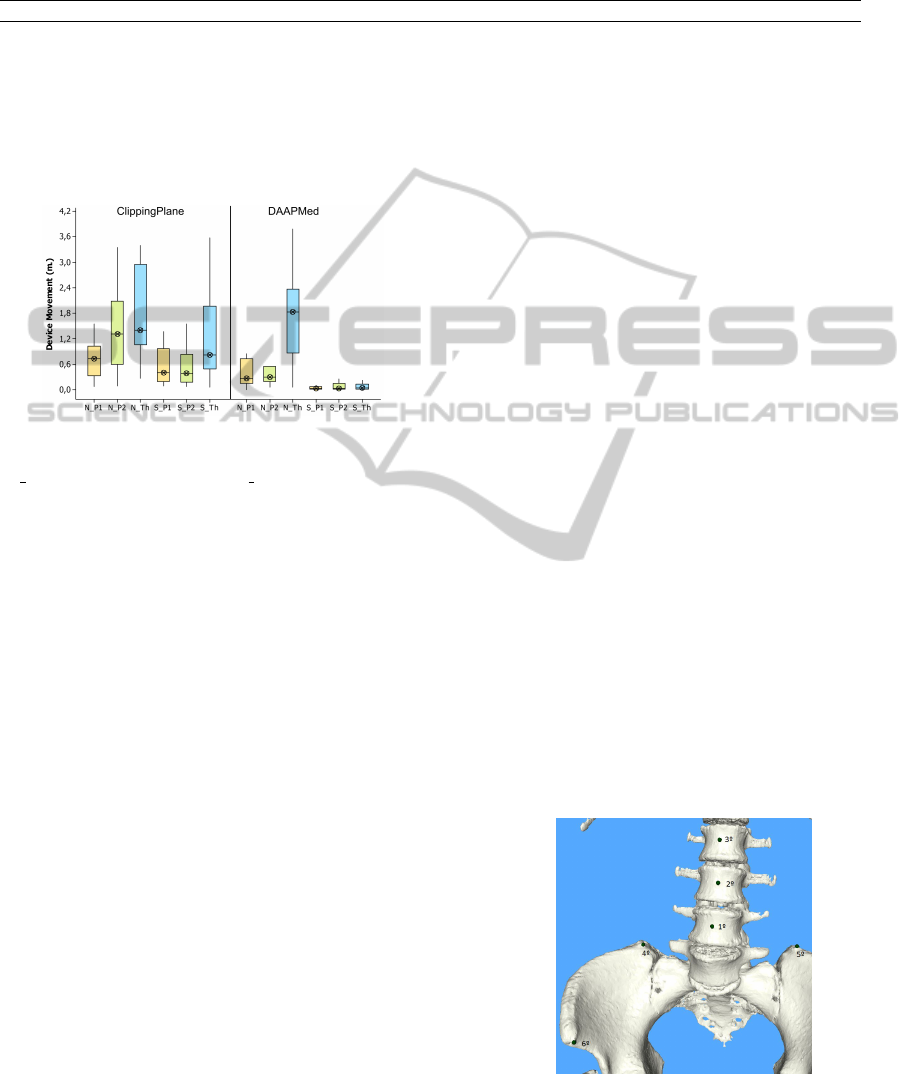
Table 1: The overall statistical results of the evaluation shown as means and standard deviations of the variables measured for
the tooth model. Regarding the mean and the standard deviation, DAAPMed is superior to CP. The one-way ANOVA analysis
showed which differences were statistically significative.
CP DAAPMed
P
1
P
2
Thickness P
1
P
2
Thickness
Accuracy 0.76 ± 0.23 0.93 ± 1.37 1.15 ± 0.81 0.562 ± 0.229 1.37 ± 3.13 1.081 ± 0.79
Completion Time 62.42 ± 34.08 73.8 ± 47.1 119.8 ± 65.5 43.07 ± 36.54 41.1 ± 25.7 84.1 ± 43.4
Movement Tool 3.711 ± 2.75 4.86 ± 4.81 7.92 ± 5.57 2.335 ± 3.26 1.88 ± 1.46 5.42 ± 3.31
Movement User 1.942 ±1.53 2.41 ±2.33 4.281 ± 3.23 1.331 ± 1.87 1.261 ± 1.04 2.835 ± 1.79
the other hand, when selecting using DAAPMed tech-
nique, users devoted a larger effort to the navigation
phase than to the selection one (see Figure 8).
Figure 8: Input device footprints. The displacement car-
ried out by the device is split in two states: navigation
(N {P
1
,P
2
,T h}) and selection (S {P
1
,P
2
,T h}).The boxes
show the interquartile range with the median as the horizon-
tal bar. The whiskers extend to the minimum and maximum
of the data.
We also measured the movement carried out by
the user. In all cases, our system requires a lower
amount of movement by the user. The analysis shows
that the movement done in DAPPMed is significantly
less than CP for P
2
(p = 0.009, F = 8.72) and for
Thickness (p = 0.03, F = 5.62).
Thus, we can conclude that our system behaves
better than CP.
Concerning the accuracy, the mean values show
better performance for our technique. However, we
did not find significant statistical differences. The
reason could be that with CP technique you can get
enough precision if you know exactly the point you
have to select. In order to do a deeper analysis, we
perform another test which is closer to a real medical
scenario since we use points with anatomical signifi-
cance.
We have also tracked another set of variables, such
as the number of points selected before validating
them, or the number of exploration versus selection
phases, but we could not extract any behavior or pat-
tern from those.
4.3 Test 2: Anatomic-based Points
We have carried out a second experiment where the
workflow is closer to a real medical environment.
The selection points are points with specific anatomic
meaning commonly used to place anchor points or
measuring distances. The objectives of this test were
twofold: a) Testing if our VR application was as
accurate than the desktop application and, b) find-
ing whether DAAPMed technique was more accurate
than the CP technique.
To carry out this analysis we use a specific
desktop-based application for the morpho-analysis of
the abdominal air (Accarino et al., 2009). In this ap-
plication, users had to mark a set of points on the
skeleton of a model in order to infer some measures.
Using this application, we marked the set of points
shown in Figure 9. The exact location of these points
were saved to a file in order to evaluate the accuracy
reached in a VR setup. Users, with the helping of the
image shown in Figure 9, have to locate these points
as accurately as possible.
Data Preparation. The model used was taken from a
medical dataset. It has a resolution of 512×512×369
and a voxel dimension of 2.042
2
× 3.56mm. The
desktop-application uses a mesh representation of the
data extracted from the volume dataset using the
Marching Cubes algorithm. Our application uses the
same volume model visualized with a DVR algo-
rithm.
Subjects and Procedure. 13 subjects participated in
this test: 10 male and 3 female, ranging between 23
Figure 9: Model used in the second test. This test confirms
that DAAPMed is as accurate as a clinical environment in
a desktop-based computer and more accurate than the CP
technique.
DAAPMed:AData-awareAnchorPointSelectionToolforMedicalModelsinVREnvironments
315

and 40.
In this experiment we proceed in the same way as
the first test. Each participant performs the test once.
Before the experiment, users were provided with a
short (1-3 min.) training session. The test was di-
vided into two blocks, one for each technique: CP
and DAAPMed. The order of the blocks was chosen
randomly in order not to introduce some learning ef-
fect.
4.3.1 Results
The results are summarized in Table 2. The first and
second rows show the mean and the standard devia-
tion for both techniques. The third and fourth rows
show the statistical significance information (p anf
F). For all the points introduced (except P
4
and P
5
),
the DAAPMed technique shows significant statistical
difference with respect CP. We do not have a clear
idea on the lack of significance of points P
4
and P
5
,
but it might be that the specification of their corre-
sponding positions was not as clear as with the others.
Figure 10 shows a boxplot for all the tasks performed.
We also compared the accuracy with the desktop
approach and obtained errors that did not differ sig-
nificantly, which demonstrates that we may achieve
comparable results in a VR environment. In both
cases, the error performed was below the voxel size.
Figure 10: Accuracy by technique. The boxes show the
interquartile range with the median as the horizontal bar.
The whiskers extend to the minimum and maximum of the
data.
4.4 Post-questionnaire Results
To complete the information, we also asked the sub-
jects to fill some questionnaires, to know the prefer-
ences of the users between the two techniques. All
responses in the post-questionnaire were measured on
a Likert scale of 1-5, where 1 meant the worst value
and 5 was the best value. The results are shown in Fig-
ure 11. The answers seem to indicate that DAAPMed
metaphor is more suitable than the CP technique.
The users noted two major problems with respect
Figure 11: Results obtained from a personal preference
evaluation questionnaire. These results show that the users’
perceptions are quite positive with our tool.
to our technique. The first one is the inherent jitter-
ing of the tracker, that made selection affect user per-
formance. Only two users agreed in that it seems to
produce a more relevant effect to the ray-based selec-
tion than to the plane-based. Furthermore, in all the
experiments, the ray-based approach showed a better
behavior than the clipping-planes system. The sec-
ond issue was the lack of ray refinement: most users
suggested that a fine tuning of the ray, after its initial
positioning would be welcome. We let this work for
future improvements.
5 CONCLUSIONS AND FUTURE
WORK
We have presented a new interaction technique for
selecting points in a volume dataset. This selection
technique follows the ray casting paradigm, enhanced
with an automatic calculation of the set of suitable
points of interest by an on-the-fly determination of the
isosurfaces along the ray path. The feedback with the
interaction is enhanced with a meaningful visualiza-
tion called Helper Views that provides context for the
ray selection and shows occluded detected candidate
points that would be otherwise invisible to the user
without posterior and ad-hoc volume manipulation.
The user study showed that our technique is easy
to learn and to use. Despite the limited precision of
the 3D input devices, our technique achieves a precise
3D interaction thanks to the automatic anchor point
calculation provided by the system. Users felt more
comfortable and achieved better results with our sys-
tem than with the clipping plane technique.
In the future we would like to continue working
on the improvement of the accuracy with the current,
imprecise devices, and we also want to carry out a
study of the overall system with medical experts.
GRAPP2013-InternationalConferenceonComputerGraphicsTheoryandApplications
316

Table 2: The overall statistical results of the evaluation shown as means and standard deviations of the tolerance error. We
can clearly see how the DAPPMed metaphor provides better results for all the tasks than the CP method.
P
1
P
2
P
3
P
4
P
5
P
6
CP 2.944 ± 1.305 3.018 ± 1.495 3.171 ± 1.729 2.336 ±0.879 2.066 ± 1.095 2.070 ± 1.169
DAAPMed 1.293 ± 0.671 1.701 ± 0.703 1.605 ± 0.501 1.766 ± 0.570 1.789 ± 0.424 0.280 ± 0.078
p,F 0.002 - 16.55 0.011 - 9.01 0.005 - 11.58 0.187 - 1.96 0.385 - 0.81 0.001 - 17.42
ACKNOWLEDGEMENTS
The authors want to thank all the participants involved
in the user study. This work has been supported by the
project TIN2010-20590-C01-01 of the Spanish Gov-
ernment.
REFERENCES
Accarino, A., Perez, F., Azpiroz, F., Quiroga, S., and
Malagelada, J. (2009). Abdominal distention results
from caudo-ventral redistribution of contents. Gas-
troenterology, 136:1544–1551.
Bowman, D., Kruijff, E., LaViola, J., and Poupyrev, I.
(2004). 3D User Interfaces: Theory and Practice.
Addison-Wesley,Pearson Education.
Bowman, D. A., Johnson, D. B., and Hodges, L. F. (1999).
Testbed evaluation of virtual environment interaction
techniques. In Proceedings of the ACM symposium on
Virtual reality software and technology, pages 26–33.
Bowman, D. A., Wingrave, C. A., Campbell, J. M., Ly,
V. Q., and Rhoton, C. J. (2002). Novel uses of pinch
gloves for virtual environment interaction techniques.
Virtual Reality, 6:122–129.
Gallo, L., De Pietro, G., and Marra, I. (2008). 3d interac-
tion with volumetric medical data: experiencing the
wiimote. In Proceedings of the 1st international con-
ference on Ambient media and systems, pages 14:1–
14:6.
Grossman, T. and Balakrishnan, R. (2006). The design and
evaluation of selection techniques for 3d volumetric
displays. In Proceedings of the Symposium on User
interface software and technology, pages 3–12. ACM.
Hagedorn, J., Joy, P., Dunkers, S., and Peskin, A. (2007).
Measurement tools for the immersive visualization en-
vironment: Steps toward the virtual laboratory. Jour-
nal of Research of the National Institute of Standards
and Technology, 112(5):257–270.
Hanson, A. J. (1992). The rolling ball. In Graphics Gems
III, pages 51–60. Academic Press.
Hastreiter, P., Tom, B., Eberhardt, K. E. W., and Ertl,
T. (1998). Fast analysis of intracranial aneurysms
based on interactive direct volume rendering and ct
angiography. In CTA, Medical Image Computing
and Computer-Assisted Intervention (MICCAI), pages
660–669. Springer.
Hinckley, K., Pausch, R., and Goble, J. (1994a). A three-
dimensional user interface for neurosurgical visualiza-
tion. In In the SPIE Conf. on Medical Imaging, pages
126–136. SPIE.
Hinckley, K., Pausch, R., Goble, J., and Kassell, N. (1994b).
A survey of design issues in spatial input. In Proceed-
ings of the Symposium on User interface software and
technology, pages 213–222. ACM.
K
¨
onig, A. H., Doleisch, H., Gr
¨
oller, E., and Brain, T. H.
(1999). Multiple views and magic mirrors - fmri visu-
alization of the human brain.
Mine, M. (1995). Virtual environment interaction tech-
niques. Technical report, UNC Chapel Hill CS Dept.
Monga, O., Deriche, R., Malandain, G., and Cocquerez,
J. P. (1990). Recursive filtering and edge closing: two
primary tools for 3-d edge detection. In Proceedings
of the first european conference on Computer vision,
pages 56–65. Springer-Verlag.
Olwal, A. and Feiner, S. (2003). The flexible pointer: An in-
teraction technique for augmented and virtual reality.
In Proceedings of ACM Symposium on User Interface
Software and Technology, pages 81–82.
Preim, B., Tietjen, C., Spindler, W., and Peitgen, H. O.
(2002). Integration of measurement tools in medical
3d visualizations. In Visualization ’02, pages 21–28.
IEEE Computer Society.
Qi, W. and Martens, J.-B. (2005). Tangible user interfaces
for 3d clipping plane interaction with volumetric data:
a case study. In Proceedings of the 7th international
conference on Multimodal interfaces, pages 252–258.
Reitinger, B., Schmalstieg, D., Bornik, A., and Beichel, R.
(2006). Spatial analysis tools for virtual reality-based
surgical planning. 3D User Interfaces, 0:37–44.
R
¨
ossling, I., Cyrus, C., Dornheim, L., Boehm, A., and
Preim, B. (2010). Fast and flexible distance measures
for treatment planning. International Journal of Com-
puter Assisted Radiology and Surgery, 5:633–646.
Song, P., Goh, W. B., Fu, C.-W., Meng, Q., and Heng, P.-A.
(2011). Wysiwyf: exploring and annotating volume
data with a tangible handheld device. In Proceedings
of the 2011 annual conference on Human factors in
computing systems, pages 1333–1342. ACM.
Ware, C. and Slipp, L. (1991). Using velocity control to
navigate 3d graphical environments: A comparison of
three interfaces. In Human Factors and Ergonomic
Studies (HFES) Meeting, pages 25–32.
DAAPMed:AData-awareAnchorPointSelectionToolforMedicalModelsinVREnvironments
317
