
Semantic Visualization in Social Network Analysis
A Social Network Analysis Example Built using Tom Sawyer Perspectives
Liangrong Yi, Wendy Feng and Brendan Madden
Tom Sawyer Software, 1997 El Dorado Avenue, Berkeley, CA, U.S.A
Keywords: Social Network, Semantic Visualization, Tom Sawyer Perspectives.
Abstract: With the rapid development of social network websites, the need for social network analysis has been
increasing dramatically. Visualization is a very powerful tool in social network analysis. Tom Sawyer
Perspectives is an advanced visualization software package and it integrates several visualization techniques
including interactive visualization, data filtering, semantic zooming, search, animation and combination of
multiple views. We propose to use a composite solution in social network analysis, present a case study of
using Tom Sawyer Perspectives and validate its effectiveness.
1 INTRODUCTION
A social network is a structure made up of a set of
actors (individuals or organizations) and the links
between these actors. The extensive growth of
online social networking led to extremely large
network. Visualization is an effective way to analyze
the large volume of data from social networks.
We propose to integrate several semantic
visualization techniques in social network analysis.
The techniques include interactive visualization,
filtering, semantic zooming, multiple views, search
and animation. We also present a Twitter data
analysis example to explain this composite solution.
2 RELATED WORK
Visualization of social network has a long history.
Computers started to be used in the visualization of
social network from early 1970’s. In recent years,
many researchers have been working in this area.
We just list a few here. Ham and
Wijk (2004)
proposed a scalable and interactive visualization
approach using a combination of semantic and
geometrical distortion. Gloor et al., (2004) described
a visual social browser for exploring the emails
communications over time. Heer and Boyd (2005)
designed a visualization system for playful end-user
exploration and navigation of online social
networks. Upon the requirements from several social
science researchers, Henry and Fekete (2006)
developed a network visualization system with both
node-link diagrams and matrices. Kwak et al.,
(2012) created a prototype of visualizing a personal
timeline by adding multiple social contexts of
tweets.
3 VISUALIZILING TWITTER
DATA USING TOM SAWYER
PERSPECTIVES
This section introduces Tom Sawyer Perspectives
and gives an example of using it in social network
visualization.
3.1 Tom Sawyer Perspectives
Tom Sawyer Perspectives is a graphics-based
software package for creating advanced data
visualization applications. It includes two graphic
modules — the Designer and the Previewer, and also
a set of API libraries. Developers usually use the
Designer to define schemas, data bindings and visual
representations of data and view design results in the
Previewer.
3.2 Data Collection
The purpose of the Twitter data analysis project is to
visualize tweets related to the topic of visualization.
550
Yi L., Feng W. and Madden B..
Semantic Visualization in Social Network Analysis - A Social Network Analysis Example Built using Tom Sawyer Perspectives.
DOI: 10.5220/0004289105500553
In Proceedings of the International Conference on Computer Graphics Theory and Applications and International Conference on Information
Visualization Theory and Applications (IVAPP-2013), pages 550-553
ISBN: 978-989-8565-46-4
Copyright
c
2013 SCITEPRESS (Science and Technology Publications, Lda.)

In approximately 3 hours, we collected over 100
tweets related to the topic. The dataset is kind of
small and the project is for demonstration only.
3.3 The Twitter Data Analysis Example
We will demonstrate how multiple techniques
provided by Tom Sawyer Perspectives are used for
visualizing the Twitter data.
3.3.1 Interactive Visualization
The schema of this project includes two element
types: User and Status. The User element represents
a Twitter user and the Status element represents a
Twitter message.
The User elements and the Status elements are
drawn as nodes in the graph. An edge is added into
the drawing if a user posts a tweet; if a status post is
in reply to a user; if a post is a retweet of a status; if
a tweet mentions a user; or a tweet has a tag. Those
different relations are colored differently. Figure 1 is
the screenshot of the drawing view.
The select, pan, interactive zooming and
highlighting tools make it easy to navigate the
drawing. The user can select/highlight one or a
couple of objects, zoom in/out to focus on a small
part of the graph or the whole picture, and pan to
change the viewport. Tom Sawyer Perspectives also
provides four layout styles: circular, hierarchical,
symmetric and orthogonal. The drawing view in
Figure 1 is displayed in symmetric layout.
3.3.2 Semantic Zooming
The standard zooming is also recognized as
geometric zooming. In standard zooming, objects
change only by sizes. However objects can change
shapes, details or presences according to the context
in semantic zooming (Boulos, 2003). Social network
visualizations usually generate graphs with huge
number of nodes and edges. When looking at the
whole picture, it’s hard to distinguish objects, not to
mention capturing the details. But when zooming in,
users are generally interested in some particular
objects and eager to know more about them.
In the Twitter project, different levels of details
are shown in the graph, depending on the zoom
level. When zooming in, the status node shows an
icon and also the excerpt of the message text (see
Figure 2). When zooming away, instead of using a
scaled-down version, only the icon is displayed (see
Figure 1).
3.3.3 Filtering
One important feature of Tom Sawyer Perspectivesis
the capability of flexible filtering. This gives us the
control of what to be included in the views and it is
particularly important in visualizing large data.
Figure 1: The drawing view of the twitter example.
SemanticVisualizationinSocialNetworkAnalysis-ASocialNetworkAnalysisExampleBuiltusingTomSawyer
Perspectives
551
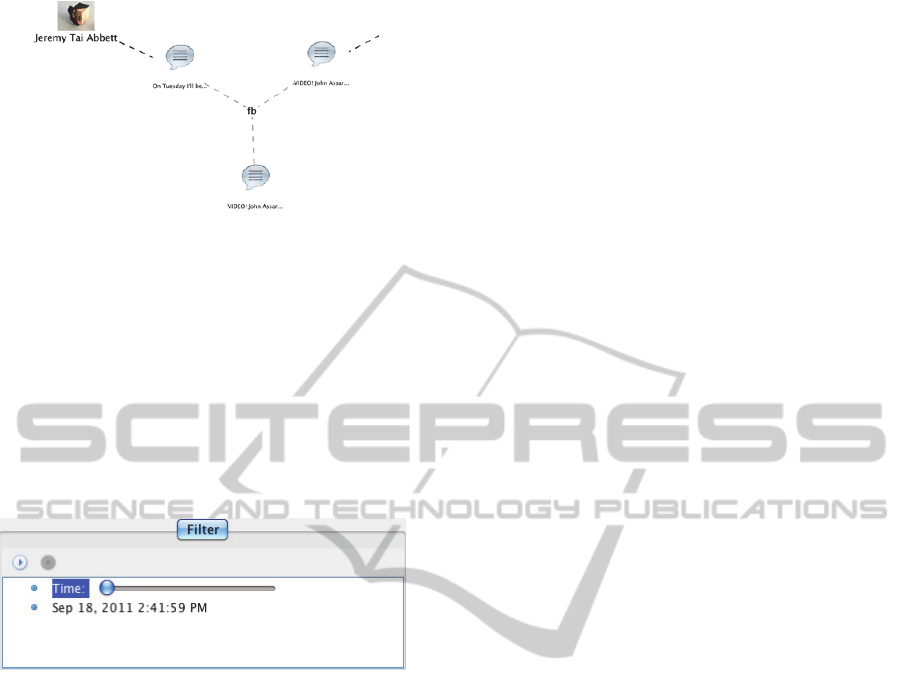
Figure 2: The excerpt of the zoomed in drawing view.
A filter in Tom Sawyer Perspectives is basically
a set of conditions. Only the data satisfy the
conditions of the filter will be populated.
A filter is added to the project to investigate the
temporal generation of this series of tweets. The
condition for the User elements is that the
TimeStamp attribute is less than CurrentTime. The
condition for the Status elements is similar. A slider,
as shown in Figure 3, controls the value of
CurrentTime.
Figure 3: The filter.
If the user moves the slider to the left most, the
earliest posts during this time period will display. If
the slider is put at the right most, all the information
from the data source will be displayed (see Figure
1).
Instead of viewing all the tweets in one big
picture, we can explore the tweets generation
process. Who posted the first one? Who replied?
These are all clear in the drawing view.
3.3.4 Multiple Views
Graphs are a good solution for visualizing social
networks. However, due to the large size and the
limitation of resolution and screen size of
computers, social network graphs usually end up
cluttered and rather illegible (Viegas and Donath,
2004). One good method in visual analytics is to use
coordinated and multiple views (Roberts, 2007).
Tom Sawyer Perspectives provides multiple
views, including drawings, tables, trees, and
inspectors. Thus we can easily analyze data from
different perspectives.
Besides the drawing view we already discussed,
we add two table views and an inspector view to the
project, as shown in Figure 4.
The drawing view graphically represents the
tweets related to “visualization”. In the drawing
view, the relationships among users and tweets
become quite clear and it also gives us a big picture
of what’s going on in that time period. The table
views provide a more organized perspective of the
data. Each user or tweet is listed in the table as a
record. We can also sort the data by any column. For
example, messages can be sorted by their time
stamps. The inspector view focuses on one particular
element and offers more details. In Figure 4, the
view displays the attribute values of user
“numeroteca”.
The synchronized selection and highlighting
integrate multiple views seamlessly in a single
project so that we can better explore and understand
the structure, relationship and semantics of the social
network.
3.3.5 Search
How to locate a particular actor from a large number
of nodes in a social network graph? This doesn’t
sound to be an easy task unless we can search on the
graph. In Tom Sawyer Perspectives, a search
configuration enables searching for specific model
elements based on the values of specific attributes of
the model elements.
With the help of the search feature, users can
quickly look for particular information in the large
social network. If we want to find out whether
someone named “Andrew” posted visualization
related messages during our interested time frame,
just type “Andrew” in the search box at the top right
corner of the drawing view. The matched nodes will
then be highlighted.
3.3.6 Animation
In section 3.3.3, we described the capability of
filtering the messages according to their posted time
stamps. We can even improve this by enabling
animation. When pressing the Play button (as shown
in Figure 3), the slider will automatically move from
left to right, and the filter condition changes
accordingly. The tweets generation process will be
shown like a movie in the drawing view. Temporal
reasoning provides a good way to explore the
network over time, gives us clues of the
development and trend of the social network which
will be critical in decision making.
IVAPP2013-InternationalConferenceonInformationVisualizationTheoryandApplications
552

Figure 4: Multiple views.
4 CONCLUSIONS
Tom Sawyer Perspectives is a powerful visualization
tool that includes several advanced features, such as
user interaction, semantic zooming, filtering,
multiple views and search. We built a Twitter
analysis project and integrated those semantic
visualization features to analyze the data. Tom
Sawyer Perspectives is an advanced software
development kit to support the growing demand for
big data analysis, and capable of building high
performance and high scalability data visualizations.
The solution demonstrated in this paper can be
extended to real applications with large datasets.
REFERENCES
Boulos, M. N. K., (2003). The Use of Interactive
Graphical Maps for Browsing Medical / Health
Internet Information Resources. International Journal
of Health Geographics, 2(1), 1-14.
Gloor, P. A., Laubacher, R., Zhao Y., Dynes, S. B. C.
(2004). Temporal Visualization and Analysis of Social
Networks, NAACSOS Conference.
Ham, F. and Wijk, J. J., (2004). Interactive Visualization
of Small World Graphs, IEEE Symposium on
Information Visualization (InfoVis 2004), 199-206.
Heer, J. and Boyd, D., (2005). VIZSTER: Visualizing
Online Social Networks, IEEE Symposium on
Information Visualization (INFOVIS 05), 32-39.
Henry, N. and Fekete, J., (2006). Matrix Explorer: a Dual-
Representation System to Explore Social Networks,
IEEE Transactions on Visualization and Computer
Graphics, 12(5), 677-684.
Kwak, H., Hong, Y., You, J. and Moon, S., (2012).
Visualizing a Personal Timeline by Adding Multiple
Social Contexts, Workshop on Social Media
Visualization (SocMedVis), 14-17.
Roberts, J. C., (2007). Coordinated and Multiple Views in
Exploratory Visualization, Fifth International
Conference on Coordinated and Multiple Views in
Exploratory Visualization, 61-71.
Viegas, F. B., Donath, J., (2004). Social Network
Visualization: Can We Go Beyond the Graph,
Workshop on Social Networks, CSCW’04, 6-10.
SemanticVisualizationinSocialNetworkAnalysis-ASocialNetworkAnalysisExampleBuiltusingTomSawyer
Perspectives
553
