
Segmentation of Kinect Captured Images using Grid based 3D
Connected Component Labeling
Aniruddha Sinha
1
, T. Chattopadhyay
1
and Apurbaa Mallik
2
1
Innovation Lab, Tata Consultancy Services, Kolkata, India
2
Indian Statistical Institute, Kolkata, India
Keywords:
Kinect, 3D Segmentation, 3D Connected Component, Grid based Approach.
Abstract:
In this paper authors have presented a grid based 3-Dimensional (3D) connected component labeling method
to segment the video frames captured using Kinect RGB-D sensor. The Kinect captures the RGB value of
the object as well as its depth using two different cameras/sensors. A calibration between these two sensors
enables us to generate the point cloud (a 6 tuple entry containing the RGB values as well as its position along
x, y and z directions with respect to the camera) for each pixel in the depth image. In the proposed method we
initially construct the point clouds for all the pixels in the depth image. Then the space comprising the cloud
points is divided into 3D grids and then label the components using the same index which are connected in the
3D space. The proposed method can segment the images even where the projection of two spatially different
objects overlaps in the projected plane. We have tested the segmentation method against the HARL dataset
with different grid size and obtained an overall segmentation accuracy of 83.8% for the optimum grid size.
1 INTRODUCTION
Human activity recognition from camera captured im-
ages/videos is an important research topic for last
few decades because of its business implications in
surveillance, retails, etc. Some such methods can be
found in (Trinh, 2011), (Gabbur, 2011) and (Trinh,
2012). Segmentation (Alon, 2009) of the input video
prior to activity recognition is one of the approaches
proposed in some of those methods. These meth-
ods have a clear edge over the other methods in
terms of getting a better recognition accuracy for the
frames/images with multiple activities. One of the
most commontechniquesunderlying such approaches
is connected component analysis (Hu, 2003).
Since last few years, Kinect has emerged as one of
the most popular consumer electronics product as a
gaming platform (Teardown, 2011). Kinect includes
a camera to sense the RGB values as well as an In-
fra Red (IR) camera to sense the depth of the object
(Owens, 2012). So the above mentioned human ac-
tivity detection problem gets a new paradigm with the
onset of such a popular RGB-D sensor like Kinect.
One such set of Kinect captured gray scale and depth
images for Human Activity Recognition experiments
can be found from the dataset (Wolf, 2012) published
by LIRIS for Human Activity Recognition and Local-
ization (HARL). The problem of segmentation using
connected component analysis also needs to be modi-
fied with the onset of such RGB-D sensor like Kinect
because these RGB-D sensor data allow us to properly
segment the objects which are overlapping in their 2D
projection plane though residing in different planes in
3D world as shown in the Figure 1. In this Figure two
men are shaking hands and the other two are not con-
nected in the real world. However it seems that all
these four men are touching each other in the projec-
tion as we see in the image.
Figure 1: Apparently touching objects in 2D projection
plane (From HARL dataset).
Related state of the art for HARL problem is very
less as human detection problem using RGB-D data
is relatively newer one. One such solution proposed
by Xia et. al. in (Xia, 2012) has a limitation that it
327
Sinha A., Chattopadhyay T. and Mallik A..
Segmentation of Kinect Captured Images using Grid based 3D Connected Component Labeling.
DOI: 10.5220/0004289303270332
In Proceedings of the International Conference on Computer Vision Theory and Applications (VISAPP-2013), pages 327-332
ISBN: 978-989-8565-47-1
Copyright
c
2013 SCITEPRESS (Science and Technology Publications, Lda.)
can work only if the skeleton of the human in the im-
ages are detected accurately. Surface normals on the
3D cloud points are used for people detection in (Heg-
ger, 2012). They detect people in walking, sitting and
other postures. However, there is no analysis done
while multiple people are interacting among them-
selves. So there is a need of segmentation of human
being prior to recognize the activity. Some methods
for segmenting such RGB-D sensor data can be found
in (Donoser, 2006). The automatic segmentation of
3D objects are proposed by (Tombari, 2011) using the
local consistency of the labels obtained from the fea-
ture data. Most of the previous works perform feature
extraction and segmentation on the cloud point (Heg-
ger, 2012) which tries to eliminate the effect of noise
using the local consistency parameter. However, this
technique is computationally expensive. The reasons
for the noise (Weerasinghe, 2012) are mostly due to
reflections of the IR from specular surfaces, interfer-
ences with outdoor lights or indoor IR sources, pres-
ence of objects with black colour and range or dis-
tance limitation in Kinect which is approximately 12
feet.
In this paper, we attempt a new technique of seg-
mentation of objects by initially converting the cloud
points to voxels by grid formation followed by 3D
connected component labeling. The voxelization not
only reduces the computational complexity of the
connected component analysis but also helps in elim-
inating the noise in the depth data. In the present
work we have used the concept of grid formation for
streaming 3D data as described in (Isenburg, 2009)
and extended that to segmentation. We propose to use
the count of the cloud points in a 3D grid and con-
sider only those grids having the counts more than
a threshold while ignoring the remaining grids. The
count values of the grids are used for segmentation us-
ing connected component labeling (Molinier, 2005),
(Kalogerakis, 2010).
The paper is organized as follows: Section 2 gives
the description of the proposed approach of segmen-
tation, section 3 gives the experimental results, fol-
lowed by discussions on the results in section 4 and
finally the conclusion is given in section 5.
2 PROPOSED METHOD
The method of voxel based 3D segmentation pro-
posed in this paper has three stages - (i) creation of
cloud points from the depth and the color image, (ii)
binary voxel creation from cloud points by grid for-
mation, (iii) 3D connected component analysis on the
binary grid voxels.
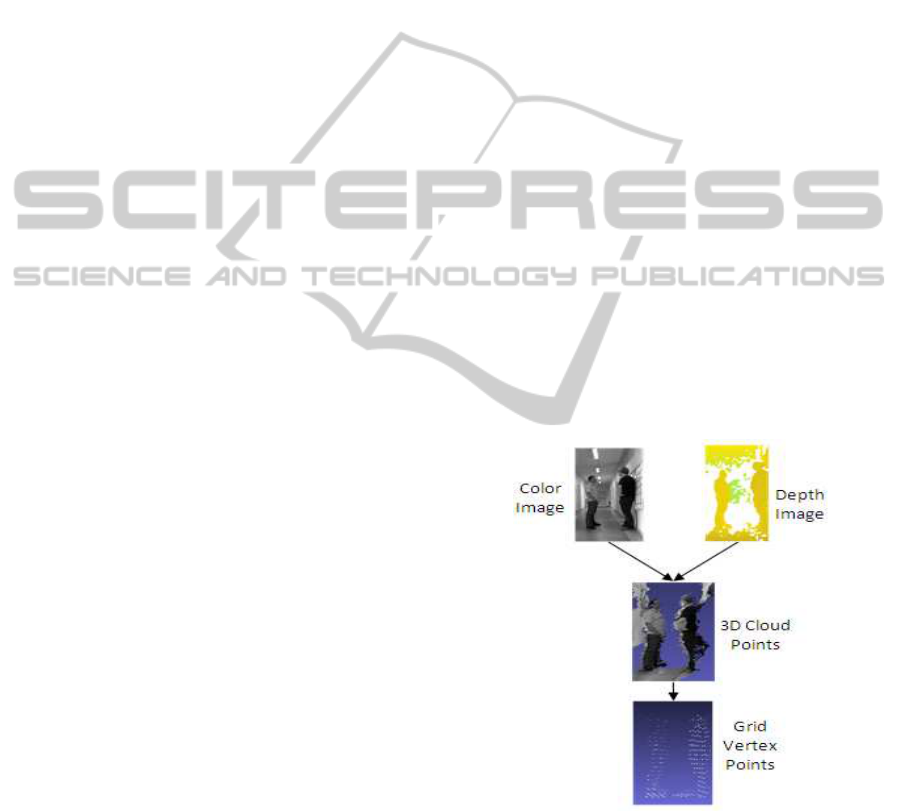
2.1 Creation of Cloud Points
The Kinect device provides color image (CI) and
depth image (DI) for every frame. The 3D cloud
points are generated from the color and the depth im-
age using the intrinsic and extrinsic parameters of the
Kinect camera (Khoshelham, 2012). The entire pro-
cess is shown in Figure 2. The color image shown
in this figure is a gray image, as the dataset (Wolf,
2012) used in the paper has the gray image instead of
color images. However, in general the image would
be a color image. A summary of the steps are given
below:
• For every pixel (depth) p
d
in the DI, the {x,y,z}
co-ordinates in the 3D world co-ordinate system
are derived using the intrinsic parameters of the
depth camera.
• For every pixel (depth) p
d
in the DI, the corre-
sponding pixel p
c
= {r,g,b} in CI is derived using
the extrinsic parameters of the Kinect depth and
color camera.
• For every p
d
in the DI, a 3D cloud point (V
c
)
is generated as a 6-tuple entry given by V
c
=
{x,y,z,r,g,b}.
The space (S
c
) encompassed by all the cloud points
is given by eqn. 1. The next step is to derive grid
vertices as explained in the next section.
Figure 2: Creation of Cloud Points and Grid Vertices.
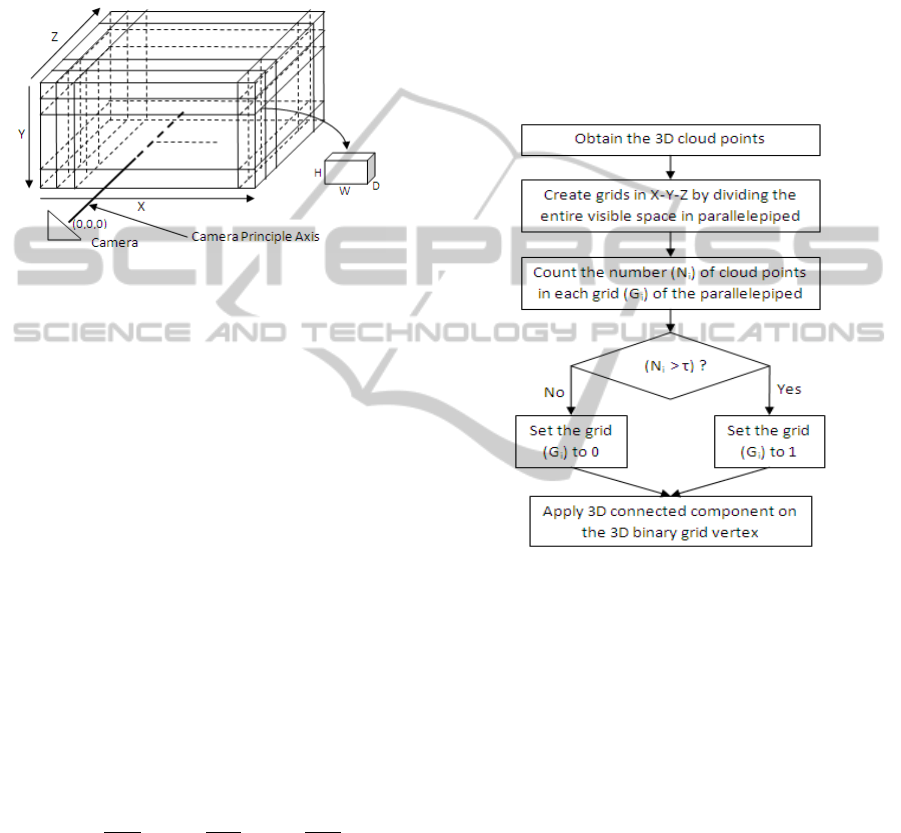
2.2 Grid Formation for Voxelization
The space (S
c
) visible by Kinect is divided into small
grids or parallelepiped along the width (X), height (Y)
and depth (Z). The direction of X and Y are the same
as the direction of X
d
and Y
d
of the depth image plane
for Kinect and direction of Z is perpendicular to the
VISAPP2013-InternationalConferenceonComputerVisionTheoryandApplications
328
X
d
-Y
d
plane. The formation of the grid is shown in
Figure 3 where the 3D world co-ordinate (x,y,z) of the
depth camera in Kinect is assumed to be (0,0,0). Sim-
ilar voxelization technique is also presented in (Gorte,
2004) for segmentation of trees using laser scans. The
flowchart for the binary voxel creation is shown in
Figure 4. The cloud points for the entire space S
c
Figure 3: Creation of Grid in 3D space.
is represented by eqn. 1 where X
nmax
, Y
nmax
are the
individual maximum absolute co-ordinates of all the
cloud points V
c
{x,y,z,r,g,b} in negative direction of
the X, Y respectively; X
pmax
, Y
pmax
are the same in
the positive direction of the X, Y respectively. Z
max
is
the individual maximum co-ordinate of all the cloud
points V
c
{x,y,z,r,g,b} in Z direction.
S
c
= {V
c
(x, y,z,r, g, b) | − X
nmax
≤ x ≤ X
pmax
,
−Y
nmax
≤ y ≤ Y
pmax
, 0 ≤ z ≤ Z
max
}
X
max
= X
nmax
+ X
pmax
Y
max
= Y
nmax
+Y
pmax
(1)
The space S
c
is divided into grids of size W, H and
D in X, Y and Z directions respectively as shown in
Figure 3. The index for the i
th
grid G
i
is given by
eqn. 2, where W
n
, H
n
and D
n
are the number of grids
and w, h and d are the indices to the grid in X, Y and
Z directions respectively. The notation ’*’ indicates
multiplication.
i = w+ h∗W
n
+ d ∗W
n
∗ H
n
W
n
=
X
max
W
, H
n
=
Y
max
H
, D
n
=
Z
max
D
(2)
The number of cloud points, N
i
in i
th
grid, G
i
is com-
puted as shown in eqn. 3, where S
G
i
c
is the space of
the cloud points V
c
which belong within the grid G
i
.
N
i
=
∑
x,y,z∈S
G
i
c
V
c
(x, y,z,r, g, b) (3)
In case of noise, the countN
i
would be very less. Thus
the grids with counts above a threshold (τ) are treated
as validgrids. The vertex V
Gi
={0,1} correspondingto
the grid G
i
contains the binary information as shown
in eqn. 4 and is termed as binarized grid vertex.
V
Gi
= 1 if N
i
≥ τ
V
Gi
= 0 if N
i
< τ
(4)
The co-ordinates of the grid vertex V
Gi
are the mean
of the co-ordinates of the point clouds V
c
belonging
within the grid G
i
. The size of the grid is configurable.
Larger grid size reduces the computational complex-
ity at the cost of loss in spatial resolution. Hence we
perform an experiment to see the effect of grid size on
the segmentation accuracy of human being.
Figure 4: Creation of Voxels and Connected Components.
2.3 Segmentation using Component
Labeling
The method of connected component labeling is as
described below:
• Each of the binarized 3D grid vertices V
Gi
as are
taken as the input. Each vertex (V
Gi
) corresponds
to the grid G
i
as described in eqn. 4
• For each vertex now we start to define a label start-
ing from 2 and increment the label valuewhenever
a new label needs to be used.
• For each i
th
grid in the first search for its 26 neigh-
bours.
• If V
Gi
= V
Gj
= 1 and V
Gj
is unlabeled, then label
V
Gj
with the label of V
Gi
. Where i is the grid
under consideration and j is any of the 26 neigh-
bouring vertex of i.
• If V
Gi
= 0 and V
Gj
= 1 and V
Gj
is unlabeled, mark
V
Gj
with a new label
SegmentationofKinectCapturedImagesusingGridbased3DConnectedComponentLabeling
329

• If V
Gi
= V
Gj
and V
Gj
= 1 and V
Gj
is already la-
beled, mark the label of V
Gj
and V
Gi
as same label
and keep track of it using an additional array.
• If V
Gk
and V
Gj
have different labels and V
Gi
is un-
labeled, then put a new label to i but keep track
of labels of i, j, k in a table where i is the grid
under consideration and j and k are two different
adjacent grids of i.
• Go through the table after a complete pass on the
image and resolve the conflicts.
• All the grid points are recursively traversed (Wu,
2005) to complete the labeling process.
Finally the size of the k
th
component C
k
is measured
using the volume Vol
C
k
of the component as given in
eqn. 5.
Vol
C
k
=
∑
i∈C
k
V
Gi
(5)
The components which are greater than a threshold
(τ
c
) are considered as potential human being.
3 RESULTS
In this section we are going to discuss our experiment
set up and experimental results. We have tested our
algorithm against the HARL data set (Wolf, 2012)
published by LIRIS for a competition on Human Ac-
tivity Recognition in ICPR 2012. This data set con-
tains human activities that can be classified into 10
classes. Among these 10 classes, the segmentation
problem becomes more difficult for the videos con-
taining human-human interactions and the possibility
of wrong segmentation is also higher for these activ-
ities. So we have selected three types of activities
namely (i) discussion of two or more people, (ii) one
person is giving some item to other one, and (iii) hand
shaking of two people to test our proposed method.
The details of the test data is given in Table 1.
Table 1: Details of Test Data.
Total number of activity 3
Total number of Videos 45
Total number of Clips 50
Total number of Frames 2163
Total number of Human 4732
We have tested our method against different grid
sizes to find the optimum grid size on a subset of the
above described test dataset. The subset consists of
4 of videos (V1, V2, V3, and V4) as shown in Ta-
ble 2, where each video contains 3 and more clips.
We have varied the grid sizes W, H and D in steps
of 10 cm along the X, Y and Z directions respec-
tively. Our experimentalresults on these different grid
sizes are shown in Table 2. The segmentation accu-
racy is derived by comparing the number of correct
human segmentation against the manually generated
ground truth. Results show that the segmentation ac-
curacy degrades with the increase of grid size along
z direction. The main reason behind it is that the
width/breadth of the image of a human being standing
at a distance of 1 to 5 meters from the camera with the
camera parameters derived from Kinect is less than 10
cm. So the possibility of two human being standing
on a cube of bigger grid size is greater than that of the
possibility of a single man standing in that grid. As
a consequence the possibility for wrong segmentation
in a bigger grid size is also higher than the possibility
of an error in the relatively smaller grid size.
Table 2: Segmentation Accuracy (%) Vs Grid size (cm) -
The W,H,D contains the grid sizes and V1,V2,V3,V4 con-
tains the accuracy values for four videos respectively.
W H D V1 V2 V3 V4
10 10 10 80 84 93.03 79.31
10 10 20 65.71 51 41.37 44.82
10 10 30 25.71 34 24.13 31.34
10 20 10 0 0 0 6.8
10 20 ≥20 0 0 0 0
10 30 ≥10 0 0 0 0
20 10 10 5.71 0 0 0
20 10 ≥20 0 0 0 0
20 20 ≥10 0 0 0 0
20 30 ≥10 0 0 0 0
30 10 10 14.48 0 0 6.8
30 10 ≥20 0 0 0 0
30 20 ≥10 0 0 0 0
30 30 ≥10 0 0 0 0
We have benchmarked our proposed method
against the traditional 2D segmentation method on the
test data mentioned in Table 1. Table 3 shows that the
accuracy of segmentation of the proposed method out
performs the gray value based 2-D connected compo-
nent approach. The overall accuracy for 3D approach
is 83.8% as against 52.3% for 2D approach.
Table 3: Segmentation Accuracy (%) for 2D and 3D ap-
proach.
Activity 2D approach 3D approach
Discussion 54.3 79.2
Give and take 58.6 78.2
Hand shaking 44.5 91.6
The details of the segmentation accuracy (%)
along with its sources of errors has been described
in Table 4. This table shows the occurrence of the
VISAPP2013-InternationalConferenceonComputerVisionTheoryandApplications
330
segmentation errors coming from under segmentation
(US) and over segmentation (OS) for different types
of activities. It can be noted that the errors due to
US is much higher compared to errors due to OS.
This is due to the fact that the grid formation tends to
merge two components which are actually separated
but their boundaries lying within the same grid.
Table 4: Segmentation Accuracy (%) for 3D approach.
Activity Clips OS US Correct
Discussion 16 2 18.8 79.2
Give and take 14 2.3 19.5 78.2
Hand shaking 20 1.4 7 91.6
The 2D based approach has a time complexity of
O(n
2
) where as the standard 3D based approaches
have an complexity of O(n
3
). We have reduced the
complexity by our proposed grid formation technique
as the grid size is significantly bigger than a voxel
with single cloud point. In our experiments we have
found that the number of grid vertices V
G
is approxi-
mately 100 times less than the number of cloud points
V
c
. Thus for a VGA resolution image obtained from
Kinect, the proposed method is producing better seg-
mentation accuracy compared to the 2D connected
component based approach at the cost of marginally
higher computational complexity.
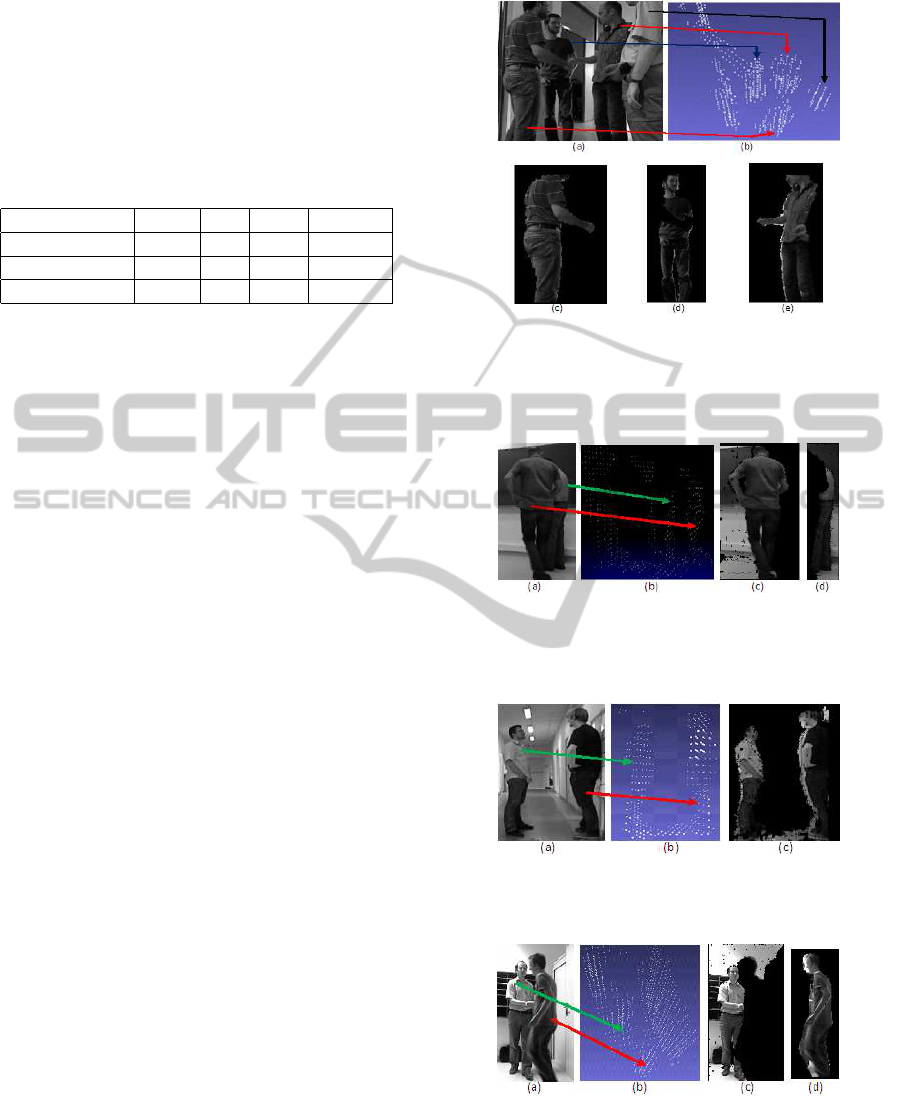
4 DISCUSSION
We now critically analyze some of the interesting
cases. The segmentation results for the Figure 1 are
shown in Figure 5. It shows the grid vertices, cor-
rect segmentation of the interacting people in the fore-
ground and separate segments for the background per-
son. The image with the grid vertices (Figure 5(b)) is
slightly rotated for better understanding and visibility.
The correspondence between the human in the image
and the grid vertices are shown using colored arrows.
It can be observed that the grid creation using the 3D
cloud points depth information eases the segmenta-
tion process compared to the normal 2D segmenta-
tion. There are scenarios where people are partially
occluded as shown in Figure 6. It can be seen that due
to the separation in the depth the people are correctly
segmented.
A scenario of under-segmentationis shown in Fig-
ure 7. Here two people are in discussion activity. It
can be seen that a single connected component is cre-
ated containing two people where the connection is
via the floor. This can be either handled by detect-
ing the ground plane or in general performing ero-
sion on the 3D grid vertices. A sample case of over-
Figure 5: Segmentation of interacting human beings -
(a) The original image (from HARL dataset), (b) Bina-
rized Grid vertices, (c) Segmented foreground human doing
handshake, (d) Segmented background human, (e) Another
segmented foreground human doing handshake
Figure 6: Segmentation of partially occluded interacting hu-
man beings - (a) The original image (from HARL dataset),
(b) Binarized Grid vertices, (c) Segmented human closer to
the Kinect, (d) Partially occluded segmented human
Figure 7: Under-Segmentation of interacting human beings
- (a) The original image (from HARL dataset), (b)Binarized
Grid vertices, (c) Segmentation of human during discussion.
Figure 8: Over-Segmentation of interacting human beings -
(a) The original image (from HARL dataset), (b) Binarized
Grid vertices, (c) Segmented human doing handshake, (d)
Another segmented human doing handshake
segmentation is shown in Figure 8 where in spite of
two people involved in handshake they are separately
SegmentationofKinectCapturedImagesusingGridbased3DConnectedComponentLabeling
331

segmented. This is due to the fact that there is a dis-
continuity between the right wrist of the person on
the right and the body itself. The discontinuity is
due to the occlusion as can be seen from the Figure
8(a). Hence the grid vertices are not present in that
occluded region leading to over segmentation.
5 CONCLUSIONS
In this paper we have proposed a method of segmen-
tation for RGB-D image frame using grid based con-
nected component analysis. Experiments performed
on HARL dataset indicate improved human segmen-
tation accuracy compared to standard 2D segmenta-
tion approach. The formation of grid reduces the
processing complexity as well as handles the noisy
depth information obtained from Kinect. The pro-
posed method has two limitations namely (i) under
segments the image/video frame if the person is lean-
ing over a wall and (ii) over segments when a human
being is spread over two adjacent grids and one of the
grid has a voxel count less than our defined threshold
value. We have left the adaptive grid size selection
and wall/floor estimation that might solve the existing
limitations as a future scope of research.
ACKNOWLEDGEMENTS
The authors would like to thankfully acknowledge the
help and support from Prof. Dipti Prasad Mukherjee
of ECSU unit of Indian Statistical Institute and Ms
Sangheeta Roy, Mr. Brojeshwar Bhowmick and Mr.
Kingshuk Chakravarty of Innovation Labs, TCS.
REFERENCES
C. Wolf, J. Mille, L.E Lombardi, O. Celiktutan, M. Jiu, M.
Baccouche, E Dellandrea, C.-E. Bichot, C. Garcia, B.
Sankur, (2012). The LIRIS Human activities dataset
and the ICPR 2012 human activities recognition and
localization competition. Technical Report RR-LIRIS-
2012-004, LIRIS Laboratory, March 28th, 2012.
Donoser, M.; Bischof, H. (2006). 3D Segmentation by
Maximally Stable Volumes (MSVs). Pattern Recogni-
tion, 2006. ICPR 2006. 18th International Conference
on , vol.1, no., pp.63-66.
Owens, J. (2012). Object Detection using the Kinect. U.S.
Army Research Laboratory ATTN: RDRL-VTA, Ab-
erdeen Proving Ground MD 21005, March 2012.
Martin Isenburg and Jonathan Shewchuk (2009). Stream-
ing Connected Component Computation for Trillion
Voxel Images. MASSIVE Workshop, June 2009.
K. Wu, E. Otoo and K. Suzuki. (2005). Two strate-
gies to speed up connected component labeling al-
gorithms. Technical report, 2005. Technical Report,
LBNL-59102.
Evangelos Kalogerakis, Aaron Hertzmann, Karan Singh,
(2010). Learning 3D Mesh Segmentation and Label-
ing. ACM Transactions on Graphics, Vol. 29, No. 3,
July 2010.
B. Gorte, N. Pfeifer (2004). 3D Image Processing to Re-
construct Trees from Laser Scans. Proceedings of
the 10th annual conference of the Advanced School
for Computing and Imaging (ASCI), Ouddorp, the
Netherlands, 2004.
Matthieu Molinier, Tuomas Hme and Heikki Ahola (2005).
3D-Connected components analysis for traffic moni-
toring in image sequences acquired from a helicopter.
In Proceedings of the 14th Scandinavian conference
on Image Analysis (SCIA’05), Heikki Kalviainen,
Jussi Parkkinen, and Arto Kaarna (Eds.). Springer-
Verlag, Berlin, Heidelberg, 141-150.
Frederik Hegger, Nico Hochgeschwender, Gerhard K.
Kraetzschmar and Paul G. Ploeger. (2012). People
Detection in 3d Point Clouds using Local Surface Nor-
mals. RoboCup, Mexico, 2012.
F. Tombari, L. Di Stefano, S. Giardino. (2011). Online
Learning for Automatic Segmentation of 3D Data.
IEEE/RSJ Int. Conf. on Intelligent Robots and Systems
(IROS ’11), 2011.
J. Hu, G. Farin, M. H. (2003). Statistical 3D Segmen-
tation With Greedy Connected Component Labelling
Refinement Research OnlinID paper-0017, 2003
L. Xia, C.-C. Chen, and J. K. Aggarwal, (2012). View In-
variant Human Action Recognition Using Histograms
of 3D Joints. The 2nd International Workshop on Hu-
man Activity Understanding from 3D Data (HAU3D),
CVPR 2012.
H. Trinh, Q. Fan, S. Pankanti et al. (2011). Detecting Hu-
man Activities in Retail Surveillance Using Hierarchi-
cal Finite State Machine. International Conference
on Acoustics, Speech and Signal Processing (ICASSP)
2011.
Hoang Trinh, Quanfu Fan, Prasad Gabbur, Sharath Pankanti
(2012). Hand tracking by binary quadratic program-
ming and its application to retail activity recognition.
CVPR 2012: 1902-1909.
Prasad Gabbur, Sharath Pankanti, Quanfu Fan, Hoang Trinh
(2011). A pattern discovery approach to retail fraud
detection. KDD 2011: 307-315.
J. Alon, V. Athitsos, Q. Yuan and S. Sclaroff. (2009). A uni-
fied framework for gesture recognition and spatiotem-
poral gesture segmentation. IEEE PAMI, vol. 31, pp.
16851699, 2009.
The teardown. (2011). Engineering Technology, vol. 6,
no.3, pp. 94-95, April 2011.
I.P. Tharindu Weerasinghe, Janaka Y. Ruwanpura, Jeffrey
E. Boyd, and Ayman F. Habib. (2012). Application
of Microsoft Kinect sensor for tracking construction
workers. Construction Research Congress 2012, May
21-23.
Khoshelham, K., Oude Elberink, S. (2012). Accuracy and
resolution of kinect depth data for indoor mapping ap-
plications. Sensors, vol. 12, 1437-1454.
VISAPP2013-InternationalConferenceonComputerVisionTheoryandApplications
332
