
Visualization of Large Ontologies with Landmarks
Zong Lei Jiao
1
, Qiang Liu
1
, Yuan-Fang Li
1
, Kim Marriott
1,2
and Michael Wybrow
1,2
1
Faculty of Information Technology, Monash University, Clayton, Victoria 3800, Australia
2
National ICT Australia, Victoria Laboratory, Melbourne, Australia
Keywords:
Ontology, Visualization, Interaction.
Abstract:
Ontologies are building blocks of the Semantic Web and are essential for knowledge representation and data
integration. Interactive visualization is an important tool for the understanding of ontologies, especially large
ones. In this paper, we present a novel hierarchical ontology visualization method for effectively visualizing an
ontology’s global landmarks, local structure and individual class’ details. We have implemented a visualization
system that can handle large ontologies efficiently. Preliminary evaluation indicates that the method and the
system can be effectively used to understand large ontologies.
1 INTRODUCTION
Ontologies underpin the Semantic Web. They de-
scribe domain knowledge using classes (abstract con-
cepts), predicates (binary relationships) and individu-
als (concrete instances). A class represents a set of in-
dividuals and a predicate represents a binary relation
between elements of two classes. Ontologies have
been successfully applied in a number of domains to
facilitate the representation, inference and integration
of knowledge and data (Ruttenberg et al., 2009; Smith
et al., 2007; Bizer et al., 2009).
As ontology use has become more prevalent, the
number and size of ontologies has increased rapidly.
Some of the largest ontologies—such as SNOMED
CT (Stearns et al., 2001), the Galen Ontology (Rogers
and Rector, 1996) and the Gene Ontology (Ashburner
et al., 2000)—contain tens and even hundreds of thou-
sands of classes and predicates. This makes under-
standing, maintenance and application of them a ma-
jor challenge. New methods and systems are needed
that support effective interrogation and comprehen-
sion of such large ontologies.
When understanding a large ontology two of the
most fundamental tasks are: (1) find a particular class
of interest and understand its relationship with other
classes in the ontology, and (2) understand the overall
structure of the ontology, in particular the taxonomy
of classes and properties, i.e., their inheritance hierar-
chy.
Information visualization techniques have been
applied to help with these tasks, with a large number
of different approaches proposed over the years (Kati-
fori et al., 2007; Lanzenberger et al., 2010). These ap-
proaches include 2D and 3D visualization, and range
from simple indented list and tree-based layout meth-
ods to space filling and distortion based techniques.
However, it is fair to say that none of the existing tech-
niques or systems are adequate.
In their comprehensive survey (Katifori et al.,
2007), Katifori et. al. point out a number of common
deficiencies of current systems. These include:
Clutter — that the visualization produced is messy
and not easy to make sense of, and made worse
with the increase in ontology size,
Structure — the visualization does not effectively
show the overall hierarchical structure of the on-
tology taxonomy,
Scalability — medium and large ontologies are not
handled efficiently, and
Inspection — it is difficult to interactively inspect
and interrogate the ontology in different ways, in-
cluding search, highlight and querying.
In this paper, we tackle the problem of visualizing
large OWL (Horrocks et al., 2003) and OWL 2 (Grau
et al., 2008) ontologies and present a novel visual-
ization method and system that address the deficien-
cies identified above. Our main contributions are two-
fold:
• The proposal of a novel tri-view land-
mark+local+axiom ontology visualization
model that addresses the problems of clutter and
structure.
461
Jiao Z., Liu Q., Li Y., Marriott K. and Wybrow M..
Visualization of Large Ontologies with Landmarks.
DOI: 10.5220/0004289904610470
In Proceedings of the International Conference on Computer Graphics Theory and Applications and International Conference on Information
Visualization Theory and Applications (IVAPP-2013), pages 461-470
ISBN: 978-989-8565-46-4
Copyright
c
2013 SCITEPRESS (Science and Technology Publications, Lda.)

• The development of a scalable and feature-rich
ontology visualization engine that supports this
model. The engine implements efficient, auto-
matic graph layout algorithms and is capable of
visualizing and interrogating large ontologies effi-
ciently, hence addressing the issues of scalability
and inspection.
Our visualization model consists of three separate
views that allow the user to visualize classes and prop-
erties in an OWL ontology in increasing granularity:
landmark view, local view and axiom view. Firstly,
an orthogonal tree-based landmark view of the class
(resp. property) hierarchy is maintained. This land-
mark view provides a quick global perspective for
the entire ontology. Since it is infeasible to show all
classes for large ontologies, this view displays a sim-
plified hierarchy using a number of inferred and user-
defined landmark or key classes.
Secondly, a local view presents the full inheri-
tance hierarchy for a small number of classes (resp.
properties). The user can browse within this view by
expanding and collapsing branches of hierarchy, and
by changing the particular class (resp. properties) on
which the local view is focused.
Thirdly, an axiom view shows the OWL axioms of
a particular selected class (resp. property) and the as-
sociated anonymous expressions using a nested rect-
angles visualization based on the expression syntax.
We have implemented our ontology visualization
method as a plugin for the Dunnart (Dwyer et al.,
2008) constraint-based diagram editor. A screenshot
of the system visualizing the well-known Galen On-
tology (Rogers and Rector, 1996) can be seen in Fig-
ure 1. Note that Galen is a large ontology that contains
more than 23,000 classes and 63,000 axioms.
The visualization engine includes a number of
novel features:
• Efficient, automatic layered tree-like layout of the
inheritance hierarchies in the landmark view and
local view.
• Synchronized, bidirectional navigation between
the landmark view and local view.
• Automatic selection and dynamic update of the
landmark classes (resp. properties) in the land-
mark view.
• Flexible search and highlighting capabilities.
• Fast loading of large ontologies via a database
backend.
• Natural visualization of anonymous class (prop-
erty) expressions and axioms in the axiom view.
The rest of the paper is organized as follows. Sec-
tion 2 briefly surveys relevant works. Section 3 dis-
cusses our landmark+local+axiom visualization ap-
proach, including a detailed description of the system
functionality and performance. Section ?? concludes
the paper and presents directions for future work.
2 BACKGROUND
2.1 Semantic Web Ontologies
Mainstream ontology languages such as OWL (Web
Ontology Language) (Horrocks et al., 2003) and
OWL 2 (Grau et al., 2008) are defined based on ex-
pressive description logics (Baader and Nutt, 2003).
The most important kind of object in an ontology
are the classes. These are organized in an inheritance
hierarchy called the class taxonomy. A key require-
ment of ontology visualization is to be able to under-
stand this taxonomy. Ontologies may contain multi-
ple inheritance so this is not a true hierarchy but rather
a DAG (directed acyclic graph). While inheritance
is the primary relationship relating classes, an ontol-
ogy language also includes a number of language con-
structs that can be used to construct complex expres-
sions and axioms to describe and relate classes, pred-
icates and individuals using other properties.
For example, the Campylobacter class in the
Galen Ontoolgy (shown in both Figure 1 and Fig-
ure 2) is defined with the following axioms and class
expressions (in the OWL Manchester syntax):
The definition of class Campylobacter
Class: Campylobacter
SubClassOf:
Bacterium
hasCellMorphology some
(CellMorphology and
(hasAbsoluteState some flagellated))
hasShape some (Shape and
(hasAbsoluteState some curving))
isActedOnSpecificallyBy some
(Gramstaining and
(hasEffectiveness some
(Effectiveness and
(hasAbsoluteState some ineffective))))
In the above ontology snippet an OWL
class, Campylobacter, is being defined. The
SubClassOf axioms define four super classes for
this class, three of which are anonymous, nested
class expressions that restrict the membership of
this class. Such class expressions include existential
quantification and class conjunction.
The semantics of an ontology is based on its in-
terpretation I (Baader and Nutt, 2003). A class C
is interpreted (denoted C
I
) as a set of individuals. A
predicate p is interpreted (denoted p
I
) as a set of pairs
IVAPP2013-InternationalConferenceonInformationVisualizationTheoryandApplications
462
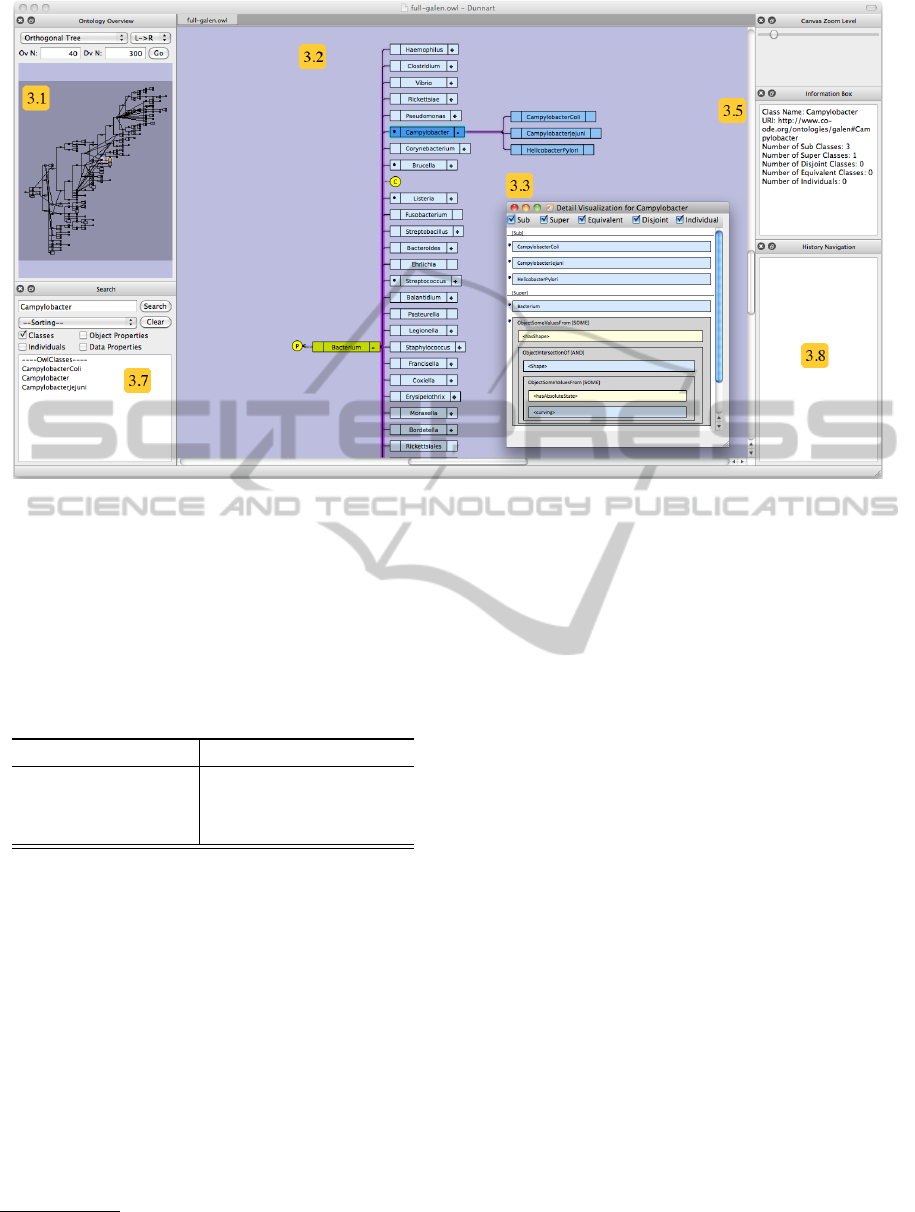
Figure 1: Screenshot of our system being used to visualize the Galen Ontology. The landmark view is shown on the left
(Section 3.1), the local view in the center (Section 3.2), and the axiom view for one class (Campylobacter) in the inset
window (Section 3.3). The information pane of the class Campylobacter is shown in top right, below the canvas zoom
control (Section 3.5). Search and highlighting can be performed in the bottom left panel (Section 3.7), and history navigation
is show in bottom right (Section 3.8).
hx, yi that are mapped under p. The interpretation-
based semantics of the axioms and expressions used
in the above example can be found in Table 1 below.
Table 1: Semantics of some OWL axioms and definitions.
Axiom/Expression definition
A SubClassOf: B A
I
⊆ B
I
A and B
A
I
∩ B
I
p some C {x|∃y.hx, yi ∈ p
I
∧ y ∈ C
I
}
The number and size of ontologies have been
growing steadily over the past decade with the in-
creased adoption of the Semantic Web and Linked
Data (Bizer et al., 2009) techniques. In domains
like bioinformatics, a number of large ontologies have
been used as an important tool for the task of captur-
ing domain knowledge and facilitating knowledge ex-
change and data integration (Ruttenberg et al., 2009;
Smith et al., 2007).
Some well-known and widely-used ones that are
available on the BioPortal ontology repository
1
in-
clude the Galen ontology, the Gene Ontology, the
NCBI organismal classification ontology, the NCI
Thesaurus ontology and the SNOMED CT (clinical
terms) ontology. These large ontologies contain tens
1
http://bioportal.bioontology.org/
(accessed 2012-11-28)
of thousands up to almost a million classes. Thus,
there is a pressing need for visualization systems to
assist in the understanding and maintenance of such
large ontologies.
2.2 Ontology Visualization
Quite a number of visualization techniques have been
employed in different systems to facilitate the navi-
gation and interrogation of OWL and RDFS ontolo-
gies. A number of ontology visualization systems are
catalogued in (Lanzenberger et al., 2010), with a fo-
cus on tools that support ontology mapping and align-
ment. A comprehensive survey (Katifori et al., 2007)
categories these systems according to their visualiza-
tion approaches. The survey also critically analyses
the visualization systems, and identifies a number of
common flaws. As discussed in Section 1, these short-
comings can be grouped into the following categories:
clutter, structure, scalability and inspection.
In the rest of this subsection, we briefly introduce
the main visualization approaches and discuss their
advantages and shortcomings.
Indented List is a basic, textual visualization ap-
proach that arranges classes (resp. properties) in a tree
view. This approach is employed by most ontology
VisualizationofLargeOntologieswithLandmarks
463
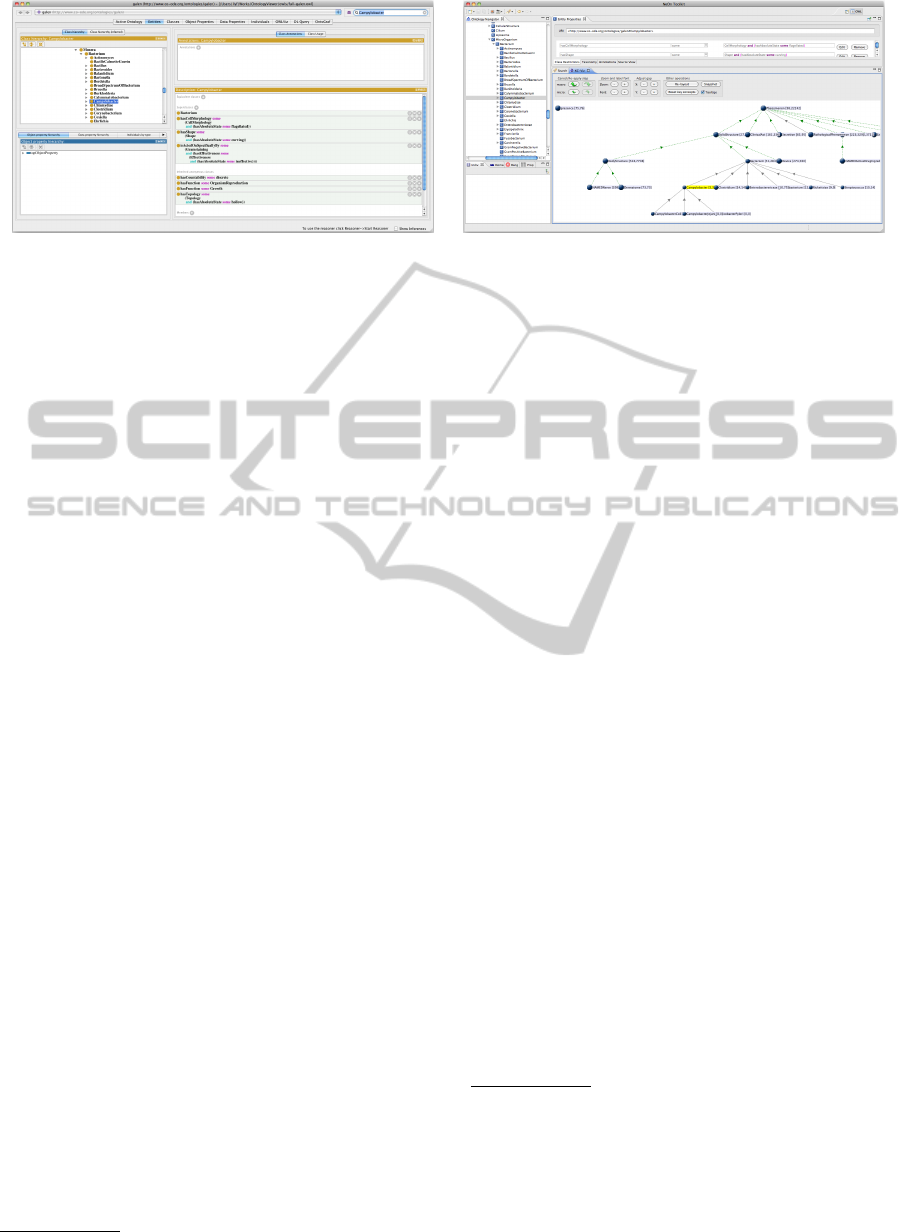
(a) Prot
´
eg
´
e’s visualization of the Galen Ontology, showing
the axioms of the Campylobacter class.
(b) KC-Viz’s visualization of the Galen Ontology, showing
the axioms of the Campylobacter class.
Figure 2: Visualization of the Galen Ontology produced by Prot
´
eg
´
e and KC-Viz, focused on the same OWL class,
Campylobacter, as in Figure 1.
editors, including the popular Prot
´
eg
´
e ontology edi-
tor (shown in Figure 2(a)). The main advantages of
this approach includes intuitiveness, familiarity, non-
overlapping of labels and fast browsing.
A disadvantage is that indented lists are not well
suited to handling multiple inheritance. However,
since multiple inheritance is not that common, some
ontology visualization tools, such as Prot
´
eg
´
e,
2
using
representations designed for hierarchical data handle
multiple inheritance by duplicating the concept and
its sub-concepts in the hierarchy under each of its par-
ents. We believe such duplication is confusing to the
user and leads to an unnecessary increase in the size
of the visualization.
Lack of an overview and the poor use of space
have also been identified as shortcomings of indented
lists. Nevertheless, the indented list is recognized as a
baseline visualization approach that can be combined
with other techniques. Note that in Figure 2(a) only a
small portion of the hierarchy is shown in the indented
list on the left. Hence, indented lists suffer from the
issues of structure.
Node-link Graphs and Trees are another intuitive
approach to visualizing hierarchies where nodes rep-
resent classes and edges represent inheritance rela-
tionships. It naturally captures the usually hierarchi-
cal inheritance relationship among classes in an on-
tology and for moderately sized networks it can, at
least in principle, clearly show the sub-class relation-
ship and the class structure. The main disadvantage
is that it is not a particularly compact representation
and networks with more than a few hundred textu-
ally labelled nodes are not really understandable when
viewed on a standard screen. Also, depending upon
the layout method, there may be efficiency issues for
large ontologies. Hence applications, including On-
2
http://protege.stanford.edu/ (accessed 2012-11-28)
toViz,
3
that employ such an approach suffer from
clutter and inspection issues (Katifori et al., 2006).
Zoomable (nested) approaches such as Jambalaya
4
and CropCircles
5
place child nodes inside their par-
ents and allow nodes to be zoomed in and out. Be-
ing effective in locating specific nodes, zoomable ap-
proaches have difficulty in handling labels and main-
taining a global overview. Such nested visualization
systems therefore face clutter and structure issues.
Also, in the case of multiple inheritance they require
duplication of a concept and its sub-concepts in the
hierarchy under each of its parents.
Space-filling techniques aim at making full use of
the display area by filling the space with nodes. A
node’s display area is subdivided among its descen-
dant nodes, with the size of a node allocated in pro-
portion to the node’s size, number of child nodes, etc.
Systems based on this technique, such as Treemap,
6
are effective in visualizing ontologies with a shallow
inheritance hierarchy (2 to 3 levels). However, they
are not as effective in presenting the structure of the
ontology. Similarly, they suffer from the issue of
structure.
Focus + Context or Distortion techniques allow
the view to be distorted to focus on a particular node,
while shrinking the other nodes. Such approaches,
3
http://protegewiki.stanford.edu/wiki/OntoViz
(accessed 2012-11-28)
4
http://thechiselgroup.org/2004/07/06/jambalaya/
(accessed 2012-11-28)
5
http://www.mindswap.org/2005/cropcircles/
(accessed 2012-11-28)
6
http://www.cs.umd.edu/hcil/treemap/
(accessed 2012-11-28)
IVAPP2013-InternationalConferenceonInformationVisualizationTheoryandApplications
464

including Hyperbolic Tree Visualization,
7
facilitate
easy navigation in the hierarchy while maintaining
contextual information (neighbor nodes). However,
hierarchies, an important concept in ontologies, are
not easily shown in such approaches. These systems
face the problem of structure.
Except Prot
´
eg
´
e, all of the above approaches fo-
cus on showing the structure of the ontologies, but not
on showing the details of individual classes (proper-
ties). Hence, they all face the problem of inspection.
Prot
´
eg
´
e, being an ontology editor, combines the in-
dented list view with a panel that shows the details of
individual nodes in the list. The details of a class are
shown in the bottom right panel in Figure 2(a).
More recently, concept diagrams have been ap-
plied to visualize a number of different relations of a
group of classes and properties (Howse et al., 2011).
Visual notations are defined for various ontological
axioms and expressions such as class disjointness,
equivalence and all values from. However, this pro-
posed visualization method has not been implemented
yet and it is unclear how effective it will be in han-
dling large groups of classes and properties.
Other recent works including (da Silva and Fre-
itas, 2011; Vercruysse et al., 2012) face similar issues
to those outlined above.
Recently, KC-Viz (Motta et al., 2011), a node-
link-based ontology visualization tool has been de-
veloped as part of the NeON project.
8
KC-Viz uses
a hybrid representation of an indented list for class
listing and a node-link graph for local structure. The
node-link graph is initialized with a number of key
concepts, concepts that are deemed to be important
by some metrics, to provide an initial, quick sum-
mary of the entire ontology. These behave like land-
marks. However, an overview containing just the
landmarks is not preserved during interaction. Dur-
ing exploration the node-link graph is expanded as
non-key concepts are explored. The key concepts
are not visually distinguished from regular, non-key
concepts. Thus the utility of the key concept view
is limited once more concepts are added to the visu-
alization. The structure and clutter issues intrinsic
to the indented list and node-link graph methods are
also present in KC-Viz. KC-Viz’s visualization of the
Campylobacter class in the Galen Ontology can be
found in Figure 2(b).
Observing that only a handful of visualization sys-
tems are capable of handling ontologies with more
than 100,000 nodes, it is concluded (Katifori et al.,
7
http://jowl.ontologyonline.org/HyperBolicTree.html
(accessed 2012-11-28)
8
http://www.neon-foundation.org/
(accessed 2012-11-28)
2007) that scalability is an important issue in ontol-
ogy visualization.
From the above discussion it can be clearly seen
that no single visualization approach effectively ad-
dresses the four deficiencies we identified above. This
observation motivated us to propose a novel tri-view
visualization approach that alleviates such problems.
3 ONTOLOGY VISUALIZATION
WITH
LANDMARK+LOCAL+AXIOM
VIEWS
From the last section, it is clear that a key problem
in ontology visualization is how to provide a mean-
ingful overview of the class taxonomy for large on-
tologies that can be computed efficiently and which is
smoothly integrated with detailed information about
a particular class. While many previous approaches
have used techniques designed for single inheritance
hierarchies, we believe that it is important to use a
visualization that can naturally handle DAGs arising
because of multiple inheritance. The most common
representation for a DAG in information visualization
applications is a hierarchical or layered tree-like net-
work diagram. However, as we have discussed, while
well suited to showing taxonomies with a few hun-
dred nodes it does not scale to larger taxonomies.
Because of the very large number of classes in
large taxonomies we do not believe it makes sense to
show all of the classes at once. These taxonomies are
so large that even if each class uses only a few pixels,
this will take up most of the screen space. We be-
lieve a better approach is to use representative classes
in the taxonomy to provide an overview. These rep-
resentative classes act as landmarks for navigation,
and the position of individual classes in the taxon-
omy is understood w.r.t. the landmark classes in the
overview. The use of a landmark overview for navi-
gating in large networks has previously been used for
visualizing the structure of large websites (Mukher-
jea and Hara, 1997). In a closely related idea, the pa-
pers (Peroni et al., 2008; Motta et al., 2011) suggest
providing an abstraction of the taxonomy by showing
the sub-taxonomy for selected key concepts. How-
ever, as discussed in the previous section, the design
of their visualization model differs significantly from
ours.
In this section we detail our novel tri-view ap-
proach to ontology visualization including the inter-
action model and the interesting implementation is-
sues we encountered when building a system based
VisualizationofLargeOntologieswithLandmarks
465
on the model. The model has three kinds of views:
the landmark view which provides an overview of
the structure of the class (or property) taxonomy by
showing a sub-taxonomy for landmarks which com-
prise automatically identified key concepts as well as
user-specified landmarks; a local view that shows all
concepts in some sub-network of the taxonomy. Both
the landmark and local view of the taxonomy use a
layered network representation. The final view, the
axiom view details the properties associated with a
class. The user can open multiple local and axiom
views with different focal areas, if they desire.
3.1 Landmark View
The landmark view consists of the sub-hierarchy con-
necting the landmark nodes. The first time that an
ontology is viewed with our tool the initial landmarks
must be determined. This is relatively costly. How-
ever as the landmarks are stored between sessions this
needs only be done once for that ontology.
Our starting point for finding the n key concepts
for the landmark view is the algorithm given in Per-
oni et al. (Peroni et al., 2008). This uses a set of
static measures to calculate a score for each concept
in ontologies. These measures include natural cate-
gories, density, coverage, and popularity. Natural cat-
egories aim to identify concepts that are information-
rich in a psycho-linguistic sense. Density highlights
the information-rich concepts in an ontological sense.
The popularity criterion aims to identify concepts that
are particularly common. Coverage is used to ensure
that no important parts are ignored. We found that
this algorithm was very slow for large ontologies and
modified it as follows: we no longer check for cover-
age as this was expensive and in practice makes little
difference; rather than performing a Google search to
find out how popular a particular concept is, we use
the number of times it appears in the ontology axioms.
However this static measure is only the initial de-
termination: the choice of key concepts evolves dy-
namically as a result of user interaction. The number
of times the concept is selected in either the landmark
view or local view is tallied to give a good indication
of its importance. Furthermore, we allow the user
to directly promote or demote concepts to the land-
mark view. The final importance score for each con-
cept is computed by combining the static and dynamic
scores, then sort the scores and obtains the list of key
concepts.
A subontology for the key concepts is then ex-
tracted. Multiple inheritance in the ontology is re-
moved from the subontology by first computing the
depth of each concept from the root and then treat-
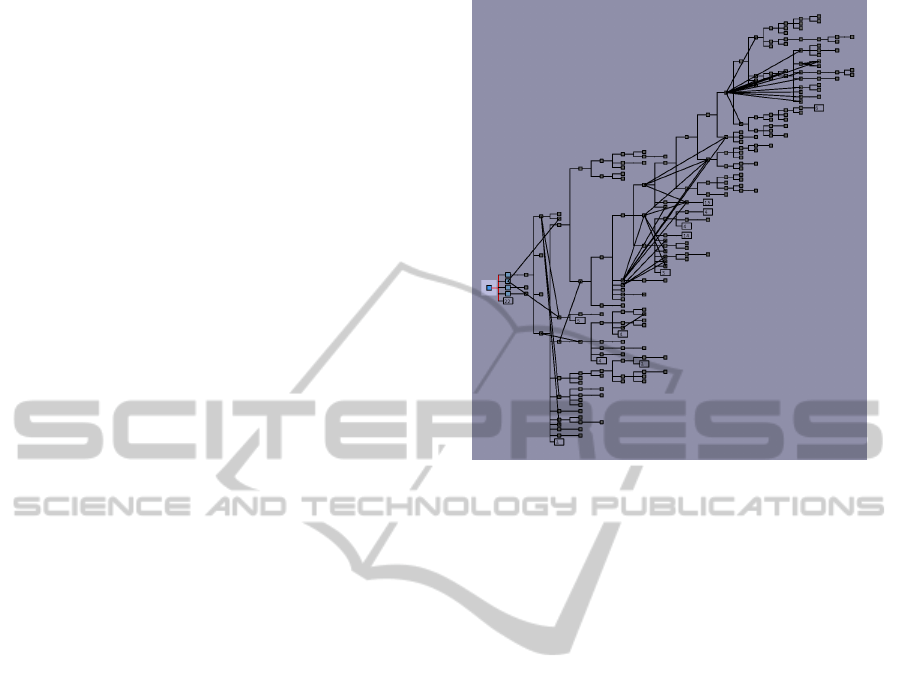
Figure 3: Screenshot of landmark view (Galen Ontology).
Non-orthogonal edges indicate multiple inheritance.
ing a concept with multiple parents as the child of its
deepest parent. We compute the layout using Walker’s
layered tree layout algorithm with the modifications
to ensure linearity (Walker, 1990; Buchheim et al.,
2002). Finally, the removed parent-child edges are
reintroduced into the tree once we have computed the
layout, as shown in Figure 3. Organizing nodes based
on their lexicographical ordering has been shown to
improve the usability of graphs. This is the reason we
use a modification of Walker’s algorithm rather than
a standard DAG layout algorithm such as Sugiyama
layered layout (Sugiyama et al., 1981) which reorders
nodes within levels.
We also perform one additional simplification of
the resulting tree. When there are multiple leaf nodes
(nodes without any children) of a single parent above
some threshold, we collapse these down to a single
larger node in the landmark view. The main reason
for this is to make better use of space and to prevent
particularly broad trees from being very long in the x
or y dimension.
The landmark tree is scaled uniformly to fit within
the landmark pane of the interface, which is can itself
be resized and repositioned by the user. When the
user hovers over nodes in this view, a tooltip will show
the name of the concept beneath the cursor. Clicking
anywhere in this view chooses a new focal area based
on the landmarks in closest proximity to the mouse
cursor. A square highlight is drawn around landmarks
that are part of the current focal area, as shown with
the root node of the tree in Figure 3.
IVAPP2013-InternationalConferenceonInformationVisualizationTheoryandApplications
466
3.2 Local View
The local view shows a subset of the taxonomy,
which we refer to as the focal area. This is a user-
configurable amount of concepts, but we prefer a de-
fault of 40 nodes to keep the network understandable
and manageable. The local view is centered around a
single focal concept, either selected by the user click-
ing in the local view, a search result, or the clos-
est concept to the point they clicked in the landmark
view. In order to understand the relationship between
the local view and the landmark view, this node, its
parents and children are shown with a distinct color
coding in both views, as shown in the center pane of
Figure 1. In both views, the focal node Thing are
coded in darker blue whereas its child nodes are coded
in lighter blue. If the focal concept is not a landmark
then the closest landmark to it (graph theoretically) is
color coded in the landmark view. In addition, if the
user brushes (hovers their mouse) over any concept
in the local view, a red circle is momentarily drawn
around the closest corresponding concept in the land-
mark view.
We use constrained network layout (Dwyer
et al., 2006) together with orthogonal edge rout-
ing (Wybrow et al., 2010) to perform the layout of
the local view. For the purpose of layout, we consider
the network in the local view to be a tree, discarding
edges causing multiple inheritance. We then traverse
this tree and assign a level for each node based on its
distance from the root node. Next we perform force-
directed layout, constraining nodes on each level to
be aligned with each other, and ordering between lev-
els (causing the tree to flow in a particular direction).
The initial force-directed aspect of the layout causes
leaves from separate branches to move apart from
each other and not be intertwined (see center pane of
Figure 1). Constraints are effectively used to ensure
that the layout is layered and that the relative place-
ment of concepts shared between the landmark view
and local view is the same. We also apply additional
constraints to prevent nodes from overlapping. This
ensures that their labels remain readable.
Edges between nodes are drawn as orthogonal
routes made of horizontal and vertical line segments
with rounded corners. We position the middle seg-
ment of edges in the channel bordered by the largest
nodes in each level. We also adjust the position within
this channel to distinguish between bundles of edges
connecting common parents or children, as can be
seen between the middle levels in Figure 1.
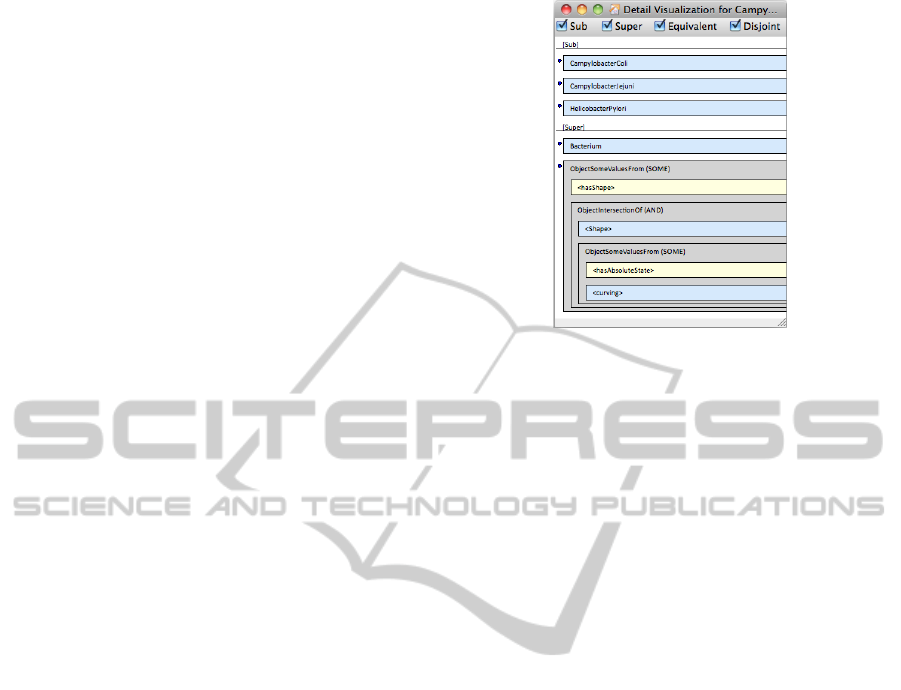
Figure 4: Screenshot of the Axiom view for the
Campylobacter class (Galen Ontology).
3.3 Axiom View
The concept taxonomy, while important, is not the
only relationship between concepts. A separate ax-
iom view window shows the axioms associated with
the focal concept. More exactly this shows the sub-
, super-, equivalent-, and disjoint-class axioms that
directly refer to that concept. Figure 4 shows this
window for the Campylobacter class, with some sub
classes and (anonymous) super classes. The user can
choose to show the formula textually or using nested
rectangles based on the syntax similar to the repre-
sentation used in Xing for XML queries in (Erwig,
2003).
3.4 Viewing Properties
The properties in the ontology are presented in a simi-
lar way to the concepts: a separate property local view
shows the taxonomy while a property axiom view
shows the domain and range of a selected property
and the properties it is associated with. In theory an-
other landmark view could be provided for properties
but in practice we have found that the complete prop-
erty taxonomy can usually be shown in the local view.
3.5 Information Pane
An information pane shows textual information about
the current focal concept, as shown in Figure 5. We
use it to show statistics about the focal concept, and
information that is difficult to display elsewhere in the
visualization, such as the fully qualified URI of the
concept.
VisualizationofLargeOntologieswithLandmarks
467
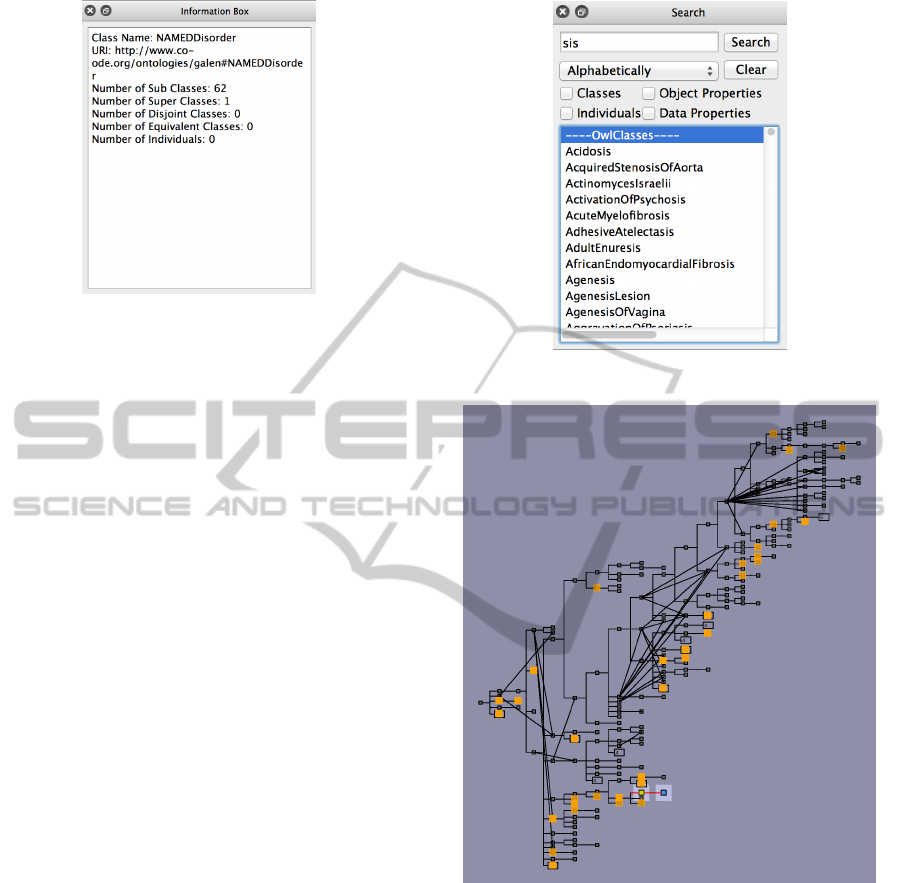
Figure 5: Screenshot of Information Pane (Galen Ontol-
ogy).
3.6 Navigation
The effectiveness of any ontology visualization tool
depends crucially on how easy it is to navigate
through the ontology to find the detailed information
the user is interested in while still keeping track of
where they are in the ontology.
The local view is the main way of viewing con-
cepts in the ontology. A new area of focus is trig-
gered by the user double-clicking on a particular con-
cept in the landmark view, local view, axiom view,
property view or search results list. This selected con-
cept is placed in the middle of the local view and its
immediate ancestors and descendants are shown with
it along with the closest key concepts from the land-
mark view. Each node is displayed with a box at ei-
ther end. Where the concept has ancestors or descen-
dants, the node will show a “+” or “-” symbol that the
user can click to show or hide its parents or children.
The changes to the layout due to nodes being added or
removed is smoothly animated. This allows the user
to explore the neighborhood surrounding the concepts
initially chosen to be displayed in the local view.
The user can promote a concept in the local view
to the landmark view. When this happens the layout
for the landmark view is recomputed and the layout
changes are smoothly animated. This is useful if the
user wishes to provide their own points of interest, or
wish to augment the inferred key concepts with their
own prior knowledge.
3.7 Search and Highlighting
The tool provides a powerful search mechanism. This
is accessible to the user via the Search pane, as shown
in Figure 6. The user can enter a search term. The
system will return a list of classes, individuals and
properties that match the user’s search term. All these
Figure 6: Screenshot of Search Pane (Galen Ontology).
Figure 7: Screenshot of Landmark View with highlighted
search results (Galen Ontology).
matches will be highlighted in both the landmark view
(see for example Figure 7) and the local view. The
user can hover their mouse cursor over any item in the
search results list to cause only that item to be high-
lighted in the landmark and local view (or the closest
concept to it in the case of the landmark view). The
user may click on any item in the search results list to
make that the focal concept and cause the local view
to update to a new focal area. This dual search design
allows the user to find and select any concept within
the entire ontology but can also be used to effectively
search and highlight information already shown in the
local view without causing that view to switch to a
IVAPP2013-InternationalConferenceonInformationVisualizationTheoryandApplications
468

Table 2: Loading times for various ontologies (in msec.) from a database.
Name Nodes First load Ontology data Key concepts Drawing Total
ICNP 3,291 yes 1,489 27,700 641 29,830
no 1,479 266 748 2,493
Galen Ontology 23,142 yes 7,214 636,541 822 644,577
no 7,075 7,459 696 15,230
Gene Ontology 35,228 yes 11,215 1,603,332 2,180 1,616,727
no 10,751 96,919 2,797 110,467
different focal area.
3.8 Navigation History
The system also offers a Navigation History pane.
This pane shows an ordered list of concepts selected
via the landmark view, local view, axiom view, prop-
erty view or search results list when determining a
new focal area for the local view. This allows the
users to quickly navigate back to previous areas of
interest within the local view.
3.9 Performance
A typical problem with existing ontology visualiza-
tion tools and editors is slow loading times. This is
predominantly due to the OWL standard for ontol-
ogy specification being an XML-based language and
the default technique for reading it being via the Java
OWLAPI. We found this to be prohibitively slow for
loading large ontologies (ten to fifteen minutes to read
the entire Galen Ontology and more than thirty min-
utes to read the Gene Ontology). Thus, we believe
that it makes much more sense to use a database to
store the ontology and efficiently load sections of it as
required. The database can then be optimized for the
particular queries that individual systems require.
We have developed a translation tool that reads an
OWL ontology and stores its contents in a SQLite
9
database. Our ontology visualization engine can sub-
sequently read the ontology data from the database
much more quickly. The calculation of key concepts
is also computationally expensive. Hence, the key
concepts are stored in the database to speed up sub-
sequent loading by avoiding recalculation. Table 2
shows some time measurement (in msec.) for loading
and working with various-sized real-world ontologies
from database. It can be observed that for medium-
to large-sized ontologies, our database-based loading
approach (second row for each ontology) achieves a
dramatic performance improvement of up to 40-fold.
9
http://www.sqlite.org/ (accessed 2012-11-28)
ACKNOWLEDGEMENTS
NICTA is funded by the Australian Government as
represented by the Department of Broadband, Com-
munications and the Digital Economy and the Aus-
tralian Research Council. We acknowledge the sup-
port of the ARC through Discovery Project Grant
DP0987168 and DP110101390.
REFERENCES
Aroyo, L., Welty, C., Alani, H., Taylor, J., Bernstein, A.,
Kagal, L., Noy, N. F., and Blomqvist, E., editors
(2011). The Semantic Web - ISWC 2011 - 10th Inter-
national Semantic Web Conference, Bonn, Germany,
October 23-27, 2011, Proceedings, Part I, volume
7031 of Lecture Notes in Computer Science. Springer.
Ashburner, M., Ball, C. A., Blake, J. A., et al. (2000). Gene
Ontology: Tool for the Unification of Biology. Nat
Genet, 25(1):25–29.
Baader, F. and Nutt, W. (2003). Basic description logics. In
Baader, F., Calvanese, D., McGuinness, D., Nardi, D.,
and Patel-Schneider, P., editors, The description logic
handbook: theory, implementation, and applications,
pages 43–95. Cambridge University Press.
Bizer, C., Heath, T., and Berners-Lee, T. (2009). Linked
data — The story so far. International Journal
on Semantic Web and Information Systems (IJSWIS),
5(3):1–22.
Buchheim, C., J
¨
unger, M., and Leipert, S. (2002). Improv-
ing Walker’s algorithm to run in linear time. In Graph
Drawing, pages 347–364. Springer.
da Silva, I. C. S. and Freitas, C. M. D. S. (2011). Using visu-
alization for exploring relationships between concepts
in ontologies. In Proceedings of the 2011 15th In-
ternational Conference on Information Visualisation
(IV’11), pages 317–322. IEEE Computer Society.
Dwyer, T., Koren, Y., and Marriott, K. (2006). Ipsep-
cola: An incremental procedure for separation con-
straint layout of graphs. Visualization and Computer
Graphics, IEEE Transactions on, 12(5):821–828.
Dwyer, T., Marriott, K., and Wybrow, M. (2008). Dun-
nart: A constraint-based network diagram authoring
tool. In Tollis, I. G. and Patrignani, M., editors, Graph
Drawing, volume 5417 of Lecture Notes in Computer
Science, pages 420–431. Springer.
VisualizationofLargeOntologieswithLandmarks
469

Erwig, M. (2003). Xing: A visual xml query language.
Journal of Visual Languages & Computing, 14(1):5–
45.
Grau, B. C., Horrocks, I., Motik, B., Parsia, B., Patel-
Schneider, P., and Sattler, U. (2008). OWL 2: The
next step for OWL. Journal of Web Semantics: Sci-
ence, Services and Agents on the World Wide Web,
6:309–322.
Horrocks, I., Patel-Schneider, P. F., and van Harmelen, F.
(2003). From SH I Q and RDF to OWL: The Making
of a Web Ontology Language. Journal of Web Seman-
tics, 1(1):7–26.
Howse, J., Stapleton, G., Taylor, K., and Chapman, P.
(2011). Visualizing ontologies: A case study. In
(Aroyo et al., 2011), pages 257–272.
Katifori, A., Halatsis, C., Lepouras, G., Vassilakis, C., and
Giannopoulou, E. G. (2007). Ontology visualization
methods - a survey. ACM Comput. Surv., 39(4).
Katifori, A., Torou, E., Halatsis, C., Lepouras, G., and Vas-
silakis, C. (2006). A Comparative Study of Four On-
tology Visualization Techniques in Prot
´
eg
´
e: Exper-
iment Setup and Preliminary Results. In Informa-
tion Visualization, 2006. IV 2006. Tenth International
Conference on, pages 417 –423.
Lanzenberger, M., Sampson, J., and Rester, M. (2010). On-
tology visualization: Tools and techniques for visual
representation of semi-structured meta-data. J. UCS,
16(7):1036–1054.
Motta, E., Mulholland, P., Peroni, S., d’Aquin, M., G
´
omez-
P
´
erez, J. M., Mendez, V., and Zablith, F. (2011). A
novel approach to visualizing and navigating ontolo-
gies. In (Aroyo et al., 2011), pages 470–486.
Mukherjea, S. and Hara, Y. (1997). Focus+ context views of
world-wide web nodes. In Proceedings of the eighth
ACM conference on Hypertext, pages 187–196. ACM.
Peroni, S., Motta, E., and d’Aquin, M. (2008). Identifying
key concepts in an ontology, through the integration
of cognitive principles with statistical and topological
measures. In Domingue, J. and Anutariya, C., editors,
ASWC, volume 5367 of Lecture Notes in Computer
Science, pages 242–256. Springer.
Rogers, J. and Rector, A. (1996). The galen ontology. In
Proceedings of Medical Informatics Europe (MIE 96),
pages 174–178. IOS Press.
Ruttenberg, A., Rees, J., Samwald, M., and Marshall, M. S.
(2009). Life Sciences on the Semantic Web: the Neu-
rocommons and Beyond. Briefings in Bioinformatics,
10(2):193–204.
Smith, B. et al. (2007). The OBO Foundry: Coordinated
Evolution of Ontologies to Support Biomedical Data
Integration. Nat Biotech, 25(11):1251–1255.
Stearns, M. Q., Price, C., Spackman, K. A., and Wang, A. Y.
(2001). SNOMED clinical terms: overview of the de-
velopment process and project status. In Proc AMIA
Symp, pages 662–666, College of American Patholo-
gists, Northfield, IL, USA.
Sugiyama, K., Tagawa, S., and Toda, M. (1981). Methods
for visual understanding of hierarchical system struc-
tures. IEEE Transactions on Systems, Man, and Cy-
bernetics, 11(2):109–125.
Vercruysse, S., Venkatesan, A., and Kuiper, M. (2012).
OLSVis: an animated, interactive visual browser for
bio-ontologies. BMC Bioinformatics, 13(1):116+.
Walker, J. Q. (1990). A node-positioning algorithm for
general trees. Software Practice and Experience,
20(7):685–705.
Wybrow, M., Marriott, K., and Stuckey, P. (2010). Orthogo-
nal connector routing. In Graph Drawing, pages 219–
231. Springer.
IVAPP2013-InternationalConferenceonInformationVisualizationTheoryandApplications
470
