
A Novel Regression Method for Software Defect Prediction
with Kernel Methods
Ahmet Okutan
1
and Olcay Taner Yıldız
2
1
Mobipath Erenet Yazılım Ltd, Kadık
¨
oy, Istanbul, Turkey
2
Computer Engineering, Is¸ık University, S¸ile, Istanbul, Turkey
Keywords:
Defect Prediction, SVM, Kernel Methods.
Abstract:
In this paper, we propose a novel method based on SVM to predict the number of defects in the files or classes
of a software system. To model the relationship between source code similarity and defectiveness, we use
SVM with a precomputed kernel matrix. Each value in the kernel matrix shows how much similarity exists
between the files or classes of the software system tested. The experiments on 10 Promise datasets indicate that
SVM with a precomputed kernel performs as good as the SVM with the usual linear or RBF kernels in terms of
the root mean square error (RMSE). The method proposed is also comparable with other regression methods
like linear regression and IBK. The results of this study suggest that source code similarity is a good means of
predicting the number of defects in software modules. Based on the results of our analysis, the developers can
focus on more defective modules rather than on less or non defective ones during testing activities.
1 INTRODUCTION
Predicting the number of defects or the extent of de-
fectiveness in the software modules is a very crucial
issue. With a successful prediction process, devel-
opers can spend their time more effectively as they
would deal with the most defective parts of the soft-
ware system rather than reinspecting the defect free
modules. As a result of a well-advised testing, the
probability of fixing the residual defects would in-
crease and more qualified software products would
be delivered to the end users. Moreover, since more
defects would be fixed during the testing phase, the
maintenance costs will decrease and this will lead to
a decrease in the total cost of the project itself.
Software metrics are used in defect prediction
studies and there are different types of metrics used in
the literature like McCabe (McCabe, 1976) and Hal-
stead metrics (Halstead, 1977). Menzies et al. show
that how the code metrics are used to build predictors
is much more important than which particular metrics
are used. Furthermore, they also suggest that McCabe
and Halstead metrics are intra module metrics and
new metrics showing the interactions among differ-
ent modules (inter module metrics) shall be used that
yield better defect predictors (Menzies et al., 2007).
Similarly, Zimmermann and Nagappan suggest that,
understanding of the dependencies that exist between
different pieces of the code is very important to pre-
dict the defect-proneness of software systems (Zim-
mermann and Nagappan, 2009).
Machine learning based techniques are used fre-
quently in defect prediction studies. Random for-
est (Kaur and Malhotra, 2008), linear discriminant
analysis (Munson and Khoshgoftaar, 1992), artificial
neural networks (Kaur et al., 2009), K-nearest neigh-
bour (Boetticher, 2005), Bayesian networks (Pai and
Dugan, 2007) and support vector machine based clas-
sifiers (Lessmann et al., 2008) (Hu et al., 2009) (Xing
et al., 2005) (Gondra, 2008) are some of the machine
learning algorithms that are used in the fault predic-
tion literature.
In this paper, we propose a novel method to pre-
dict the number of defects in the software modules by
focusing on the source code similarity. We generate
a precomputed kernel matrix that shows the similar-
ity among different classes or modules of the soft-
ware system and use this matrix as a precomputed
kernel for SVM to predict the number of defects or
the extent of defectiveness. To extract the similarities
among different classes or modules we use the plagia-
rism tool MOSS (Aiken, 1997).
This paper is organized as follows: In Section 2,
we give a background on kernel machines. In Sec-
tion 3, we present a brief review of previous work on
kernel methods and software defect prediction using
216
Okutan A. and Taner Yıldız O. (2013).
A Novel Regression Method for Software Defect Prediction with Kernel Methods.
In Proceedings of the 2nd International Conference on Pattern Recognition Applications and Methods, pages 216-221
DOI: 10.5220/0004290002160221
Copyright
c
SciTePress

kernel machines. We explain our proposed method
in Section 4 and give the experiments and results in
Section 5 before we conclude in Section 6.
2 KERNEL MACHINES
2.1 Support Vector Machines
Let’s assume that we have a training set where y
t
’s are
output values corresponding to each x
t
input vector.
In SVM regression proposed by Vapnik et al.
(Cortes and Vapnik, 1995) the goal is to find a func-
tion g(x) that has at most ε deviation from the actually
obtained target y
t
values for all of the training data,
and at the same time is as flat as possible. It means
that the error e introduced by the function g(x) must
be less than ε for all possible x inputs. If the function
g(x) is defined as:
g(x
t
) = w
T
x
t
+ b (1)
the ε-sensitive error function can be defined as:
e
ε
(y
t
, g(x
t
)) =
0 if
|
y
t
− g(x
t
)
|
< ε
|
y
t
− g(x
t
)
|
− ε otherwise
(2)
where for the function to be flat, w should be small.
To ensure a small w, we can minimize
k
w
k
2
=
(w
T
w). Then, we can write this problem as a convex
optimization problem of:
Minimize
1
2
k
w
k
2
(3)
s. t.
y
t
− (w
T
x
t
+ b) ≤ ε
w
T
x
t
+ b − y
t
≤ ε
To control the sensitivity of SVM and tolerate possi-
ble outliers, slack variables (ξ
+
, ξ
−
) are introduced.
Then the problem changes slightly and becomes an
optimization problem of
Minimize
1
2
k
w
k
2
+C
∑
t
(ξ
t
+
+ ξ
t
−
) (4)
s. t.
y
t
− (w
T
x
t
+ b) ≤ ε + ξ
t
+
w
T
x
t
+ b − y
t
≤ ε + ξ
t
−
ξ
t
+
, ξ
t
−
≥ 0
where the constant C > 0 determines the trade-off be-
tween the flatness of g(x) and the amount up to which
deviations larger than ε are tolerated and two types of
slack variables (ξ
+
, ξ
−
) are used, for positive and neg-
ative deviations, to keep them positive. This formula-
tion also corresponds to the ε-sensitive error function
given in Equation 2. The Lagrangian is:
L
p
=
1
2
k
w
k
2
+C
∑
t
(ξ
t
+
+ ξ
t
−
)
−
∑
t
α
t
+
(ε + ξ
t
+
− y
t
+ w
T
x
t
+ b)
−
∑
t
α
t
−
(ε + ξ
t
−
+ y
t
− w
T
x
t
− b)
−
∑
t
(µ
t
+
ξ
t
+
+ µ
t
−
ξ
t
−
) (5)
Taking the partial derivatives of the Lagrangian and
substituting the results we get the dual:
L
d
= −
1
2
∑
t
∑
s
(α
t
+
− α
t
−
)(α
s
+
− α
s
−
)(x
t
)
T
x
s
− ε
∑
t
(α
t
+
+ α
t
−
) −
∑
t
y
t
(α
t
+
− α
t
−
) (6)
subject to
0 ≤ α
t
+
≤ C, 0 ≤ α
t
−
≤ C,
∑
t
(α
t
+
− α
t
−
) = 0
When we solve this, we see that all instances that fall
in the regression tube have α
t
+
= α
t
−
= 0 where these
are instances that are fitted with enough precision. On
the other hand, the support vectors are either α
t
+
> 0
or α
t
−
> 0 and are of two types. They can either be the
instances on the boundary of the regression tube and
can be used to calculate b in g(x). Instances that fall
outside of the regression tube are of the second type
and we do not have a good fit for them (α
t
+
= C).
The dot product (x
t
)
T
x
s
in Equation 6 can be re-
placed with a suitable kernel function K(x
t
, x
s
) to
have a nonlinear fit. For example, when we use a
polynomial kernel we can fit to a polynomial or when
we use a Gaussian kernel we can have a nonparamet-
ric smoothing model.
3 PREVIOUS WORK
Gondra (Gondra, 2008) compares the performance of
Artificial Neural Network (ANN) with SVM and con-
cludes that SVM is a better defect prediction tech-
nique when compared with ANN since its accuracy is
higher. Elish and Elish (Elish and Elish, 2008) com-
pare the performance of SVM with eight statistical
and machine learning methods in terms of accuracy,
precision, recall and the F-measure and suggest that
the performance of SVM is better than or at least com-
petitive with other statistical and machine learning
ANovelRegressionMethodforSoftwareDefectPredictionwithKernelMethods
217
methods. Arisholm et al. (Arisholm et al., 2007) com-
pare the performance of SVM with other techniques
like C4.5, neural networks, and logistic regression in
terms of precision, recall, and the AUC. Although
they suggest that C4.5 classification tree method per-
forms better than other techniques in general, the re-
sults are comparable in terms of the AUC where the
AUC for SVM is 83.7% which is better than the AUC
value of the six out of eight methods tested. Shin et
al. (Shin et al., 2007) show that defect proneness pre-
diction is possible even with just line of code (L) and
cyclomatic complexity (V) metrics using radial basis
function with Gaussian kernel. Hu et al. (Hu et al.,
2009) show that SVM is more successful than ANN
in terms of accuracy to predict software risks.
4 PROPOSED METHOD
We propose to use SVM with a precomputed kernel
matrix to predict the number of defects in classes or
files of the software systems. To generate the precom-
puted kernel matrix, we use the MOSS (Aiken, 1997)
plagiarism detection tool which uses finger print ap-
proaches rather than considering lexical similarities
only. We believe that defective code pieces have sim-
ilar attributes in common and this similarity can be
used to predict defectiveness.
Imagine a software system that has N files where a
file is represented as f
i
. Then the precomputed kernel
matrix we generate from MOSS is represented as:
K =
K( f
1
, f
1
) K( f
1
, f
2
) ... K( f
1
, f
N
)
K( f
2
, f
1
) K( f
2
, f
2
) ... K( f
2
, f
N
)
... ... ... ...
K( f
N
, f
1
) K( f
N
, f
2
) ... K( f
N
, f
N
)
(7)
where K( f
i
, f
j
) shows the similarity between files f
i
and f
j
.
The kernel matrices generated for our data sets
are valid kernels since they satisfy the positive semi-
definiteness property. If any symmetric but non semi-
positive matrix is not a valid kernel, there are some
alternative ways of converting it to a valid kernel (Wu
et al., 2005). Furthermore, we normalize the precom-
puted kernels to their unit norm, since normalization
may effect the generalization ability and may result in
a smaller range for C.
MOSS (Measure Of Software Similarity) is a tool
developed by Alex Aiken and hosted by Stanford Uni-
versity (Aiken, 1997). MOSS uses robust winnow-
ing algorithm, which is more efficient and scalable
since it selects fewer finger prints for the same quality
of results than previous algorithms tried (Schleimer
et al., 2003). While generating a similarity output
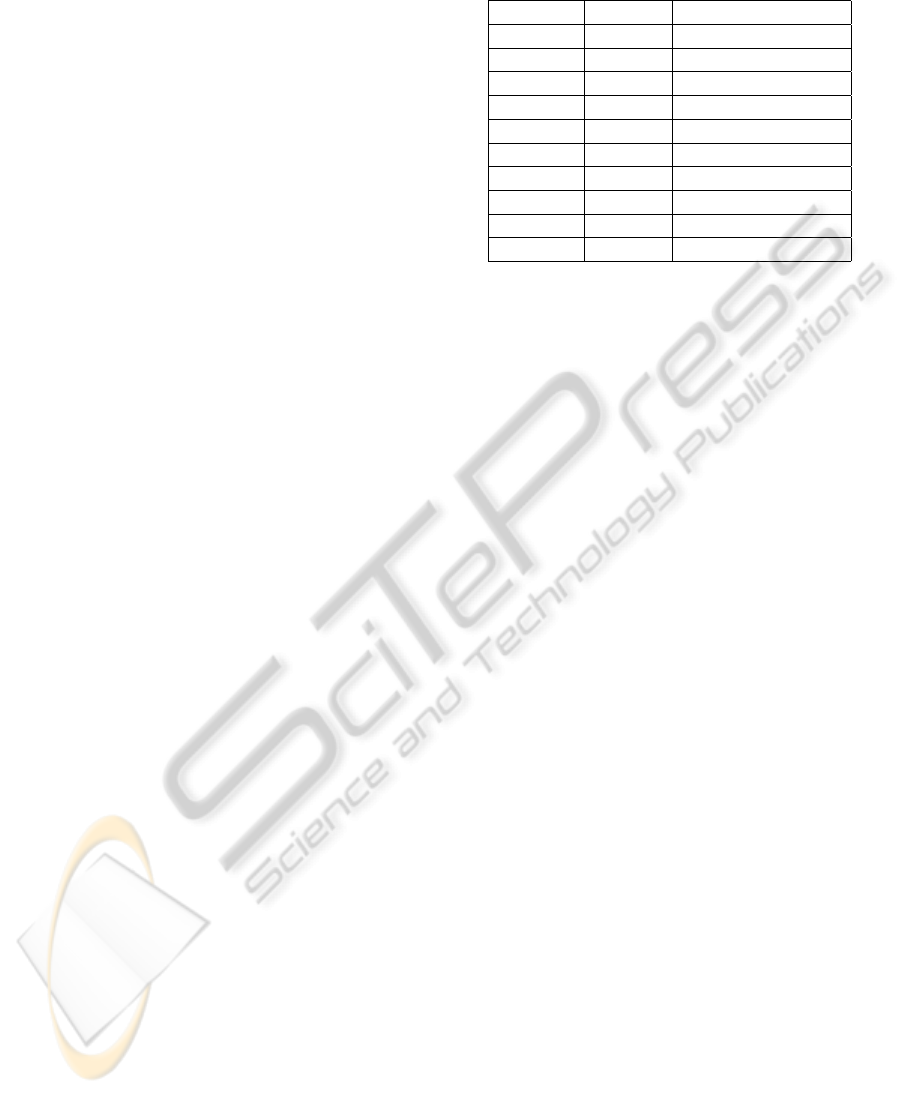
Table 1: The 10 data sets used in the experiments.
Data Set Version Num. of Instances
Camel 1.0 339
Tomcat 6.0 858
Poi 3.0 442
Xalan 2.5 803
JEdit 4.0 306
Velocity 1.5 214
Ant 1.7 745
Lucene 2.4 340
Synapse 1.2 256
Ivy 2.0 352
with MOSS, its parameters m and n need to be tuned
carefully. m represents the maximum number of times
a given passage may appear before it is ignored, so
we select m very large (1,000,000) not to ignore any
similarity. Furthermore, n represents the maximum
number of similarities to include in the results and we
select it as 5,000 that is large enough to take into ac-
count all meaningful similarities for our case.
5 EXPERIMENTS AND RESULTS
5.1 Experiment Design
We use Weka (Hall et al., 2009) to compare the perfor-
mance of our proposed kernel method (PCK-SVM)
with linear, RBF kernels and other defect prediction
methods LR and IBK. In each experiment, 5×2 fold
cross-validation is used and all the necessary param-
eters of SVM (C, ε, and γ) are tuned. Furthermore,
we compare all techniques in terms of the Root Mean
Square Error (RMSE) metric. We select 10 data sets
from the Promise data repository (Boetticher et al.,
2007) (See Table 1) that are open source and have
enough entries in their defect files to be able to ap-
ply 5×2 cross validation.
We define the major steps followed for each ex-
periment below:
1. First we choose appropriate open source data sets
from Promise data repository. (See Table 1).
2. We give the source code of the data set to MOSS
and extract the similarities that exist among the
classes of the data set we chose.
3. We convert the MOSS similarity output to a pre-
computed kernel matrix that shows similarities
among the classes (or files).
4. We create a new defect file from the Promise data
defect file that includes only the file names and
ICPRAM2013-InternationalConferenceonPatternRecognitionApplicationsandMethods
218
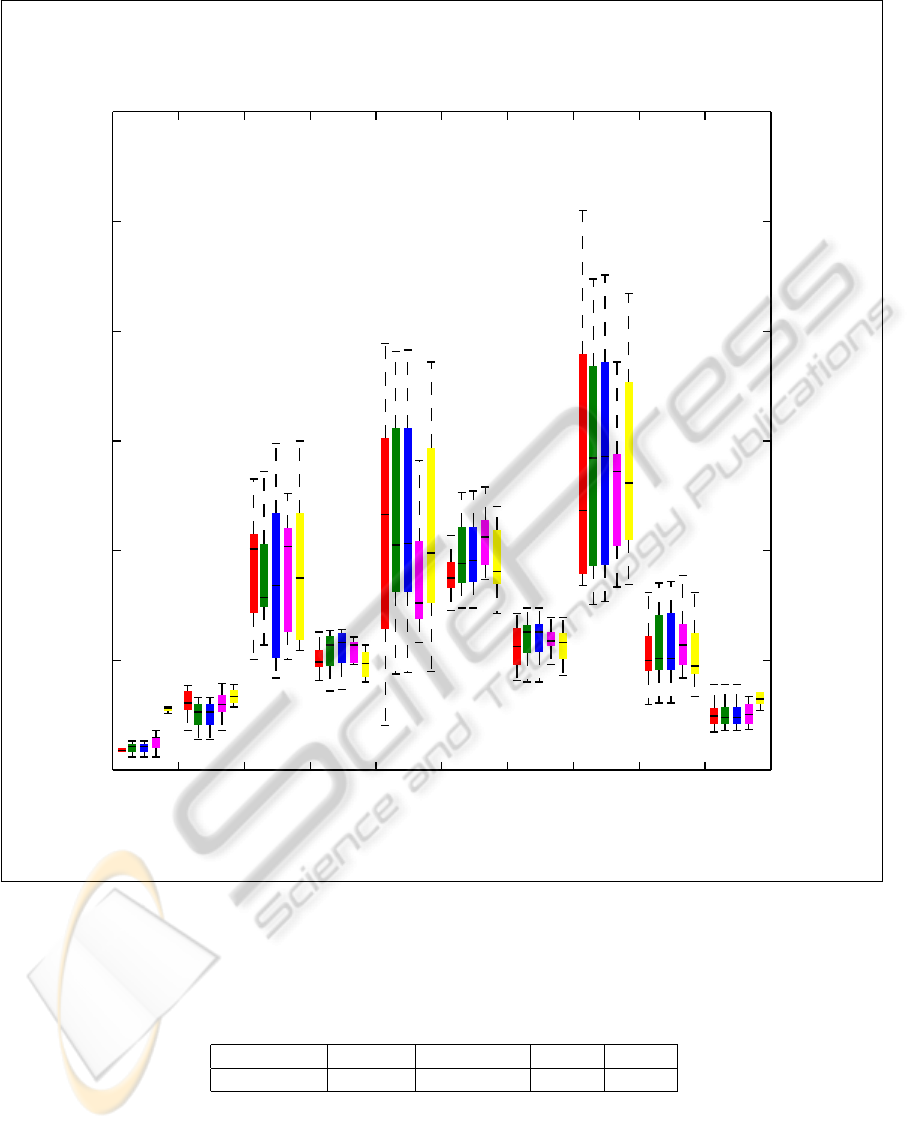
Root Mean Square Error
Camel
Tomcat
Poi Xalan
JEdit
Velocity
Ant
Lucene
Synapse
Ivy
0.0
1.0
2.0
3.0
4.0
5.0
6.0
Figure 1: Box plots of RMSE of PCK-SVM, L-SVM, RBF-SVM, IBK, and LR for 10 datasets.
Table 2: A comparison of PCK-SVM with L-SVM, RBF-SVM, LR, and IBK algorithms. The first values in each cell show
the number of cases where PCK-SVM is better than the algorithm in the column. The second values in each cell give the
number of cases where PCK-SVM is worse than the algorithm in the column. The third values in each cell, represent the
number of cases where there is a tie.
L-SVM RBF-SVM LR IBK
PCK-SVM 6, 3, 1 6, 2, 2 8, 2, 0 6, 4, 0
the number of bugs.
5. To measure the performance of the proposed
method (PCK-SVM), the defect file generated in
step 4 and the precomputed kernel found in step 3
are given as inputs to SVM regression (SMOReg)
in Weka with 5×2 cross validation.
6. To measure the performance of other kernels (L-
SVM and RBF-SVM) and existing defect predic-
tion methods (LR and IBK), the original defect
data file from Promise data repository is used.
ANovelRegressionMethodforSoftwareDefectPredictionwithKernelMethods
219
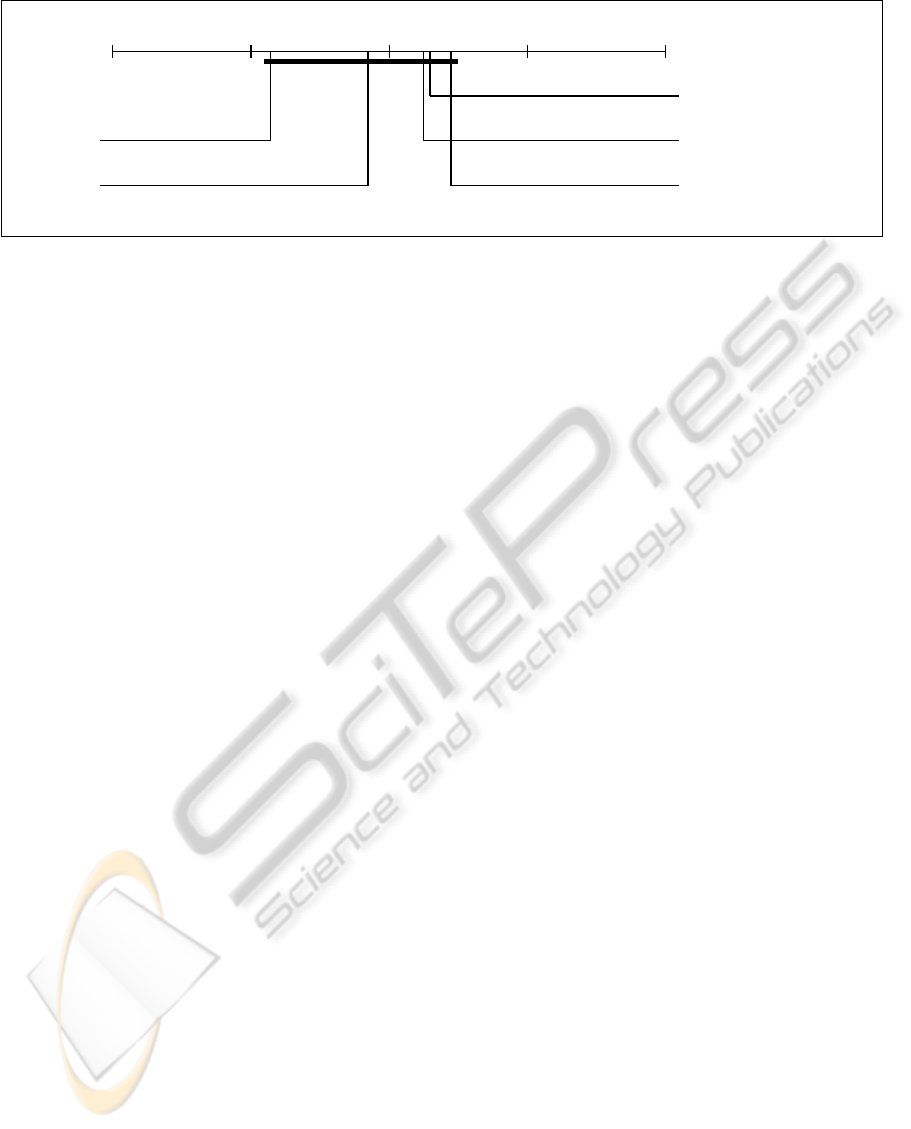
1 2
3
4
5
IBKL-SVM
LRPCK-SVM
RBF-SVM
Figure 2: The mean ranks of the PCK-SVM, L-SVM, RBF-SVM, IBK, and LR.
The results of all methods are compared using the
Root Mean Square Error (RMSE) where a smaller
error interpreted as a better fit for regression.
5.2 Results
We compare the performance of precalculated kernel
based SVM (PCK-SVM) with linear kernel (L-SVM),
RBF kernel (RBF-SVM), linear regression (LR), and
IBK algorithms. We see that PCK-SVM achieves a
smaller RMSE compared to L-SVM in 6 of 10 ex-
periments, whereas it is worse in 3 experiments and
in 1 experiment there is no difference. Similarly, it
generates better RMSE in 6 experiments, whereas it
is worse in only 2 experiments when compared to
RBF-SVM. When we compare the results with exist-
ing techniques, we observe that PCK-SVM is better
in 6 experiments but worse in 4 experiments when
compared with IBK. Similarly, for LR, it is better nu-
merically in 8 experiments and it is worse in only 2
experiments (See Table 2).
We apply the Nemenyi post hoc test (in 95 % con-
fidence interval) to detect if the performance of PCK-
SVM differs significantly from other kernels and de-
fect prediction techniques (Dem
ˇ
sar, 2006). The re-
sult of the test is shown in Figure 2. We observe that
although PCK-SVM is the best algorithm, it is still
on the same block with other algorithms and there is
no significant difference among the mean ranks of the
tested algorithms. However, since it is on the border
of the critical difference block, if more algorithms are
tested on the same data sets, it could be possible to
visualize the difference of PCK-SVM better.
We also check the statistical significance of the
results, by applying unpaired t-test (in 95 % confi-
dence interval) to the results obtained for PCK-SVM,
L-SVM, RBF-SVM, LR, and IBK methods. We see
that, although the mean ranks of the techniques are
not different statistically, we observe significant dif-
ferences for some data sets. For example, the perfor-
mance of PCK-SVM is better than LR, for Camel and
Ivy data sets with a p-value of 0.0 and 0.004 respec-
tively (See Figure 1). As a conclusion, we see that
PCK-SVM is comparable not only with existing lin-
ear and RBF kernels, but also with existing defect pre-
diction techniques in the literature i.e. LR and IBK.
6 CONCLUSIONS AND FUTURE
WORK
In this paper, we propose a new kernel method to pre-
dict the number of defects in the software modules
(classes or files). The proposed method is based on
a precomputed kernel matrix which is based on the
similarities among the modules of the software sys-
tem. We compare our novel kernel method with exist-
ing kernels in the literature (linear and RBF kernels)
and show that it achieves comparable results. Further-
more, the proposed defect prediction method is also
comparable with some existing famous defect predic-
tion methods in the literature i.e. linear regression and
IBK.
The main contributions of this research are:
• We propose a novel kernel method to predict the
number of defects in the software modules.
• Prior to test phase or maintenance, developers can
use the proposed method to easily predict the most
defective modules in the software system and fo-
cus on them primarily rather than testing each and
every module in the system. This can decrease
the testing effort and the total project cost auto-
matically.
As a future work, we plan to refine our research and
use graph based clone detection techniques which are
able to detect functional similarities and are more suc-
cessful compared to the token based techniques in ex-
tracting semantic similarities (Roy et al., 2009). We
believe that when semantic similarity is included, the
RMSE of the proposed prediction method would be
lower.
ICPRAM2013-InternationalConferenceonPatternRecognitionApplicationsandMethods
220

REFERENCES
Aiken, A. (1997). Moss (measure of software similarity).
http://cs.stanford.edu/ aiken/moss/.
Arisholm, E., Briand, L. C., and Fuglerud, M. (2007). Data
mining techniques for building fault-proneness mod-
els in telecom java software. In Software Reliability,
2007. ISSRE ’07. The 18th IEEE International Sym-
posium on.
Boetticher, G., Menzies, T., and Ostrand, T. (2007).
Promise repository of empirical software engineering
data http://promisedata.org/ repository, west virginia
university, department of computer science.
Boetticher, G. D. (2005). Nearest neighbor sampling for
better defect prediction. In Proceedings of the 2005
workshop on Predictor models in software engineer-
ing, PROMISE ’05.
Cortes, C. and Vapnik, V. (1995). Support-vector
networks. Machine Learning, 20:273–297.
10.1007/BF00994018.
Dem
ˇ
sar, J. (2006). Statistical comparisons of classifiers
over multiple data sets. Journal of Machine Learning
Research, pages 1–30.
Elish, K. O. and Elish, M. O. (2008). Predicting defect-
prone software modules using support vector ma-
chines. Journal of Systems and Software, 81.
Gondra, I. (2008). Applying machine learning to software
fault-proneness prediction. Journal of Systems and
Software, 81(2):186–195.
Hall, M., Frank, E., Holmes, G., Pfahringer, B., Reute-
mann, P., and Witten, I. H. (2009). The WEKA data
mining software: an update. SIGKDD Explorations,
11(1):10–18.
Halstead, M. H. (1977). Elements of Software Science (Op-
erating and programming systems series). Elsevier
Science Inc., New York, NY, USA.
Hu, Y., Zhang, X., Sun, X., Liu, M., and Du, J. (2009). An
intelligent model for software project risk prediction.
In International Conference on Information Manage-
ment, Innovation Management and Industrial Engi-
neering, 2009, volume 1, pages 629 –632.
Kaur, A. and Malhotra, R. (2008). Application of random
forest in predicting fault-prone classes. In Advanced
Computer Theory and Engineering, 2008. ICACTE
’08. International Conference on.
Kaur, A., Sandhu, P., and Bra, A. (2009). Early software
fault prediction using real time defect data. In Ma-
chine Vision, 2009. ICMV ’09. Second International
Conference on, pages 242 –245.
Lessmann, S., Baesens, B., Mues, C., and Pietsch, S.
(2008). Benchmarking classification models for soft-
ware defect prediction: A proposed framework and
novel findings. IEEE Transactions on Software Engi-
neering, 34:485–496.
McCabe, T. (1976). A complexity measure. IEEE Transac-
tions on Software Engineering, 2:308–320.
Menzies, T., Greenwald, J., and Frank, A. (2007). Data
mining static code attributes to learn defect predictors.
IEEE Transactions on Software Engineering, 33:2–
13.
Munson, J. C. and Khoshgoftaar, T. M. (1992). The detec-
tion of fault-prone programs. IEEE Trans. Softw. Eng.,
18:423–433.
Pai, G. and Dugan, J. (2007). Empirical analysis of soft-
ware fault content and fault proneness using bayesian
methods. IEEE Transactions on Software Engineer-
ing, 33(10):675–686.
Roy, C. K., Cordy, J. R., and Koschke, R. (2009). Compari-
son and evaluation of code clone detection techniques
and tools: A qualitative approach. Science of Com-
puter Programming.
Schleimer, S., Wilkerson, D. S., and Aiken, A. (2003). Win-
nowing: local algorithms for document fingerprinting.
In Proceedings of the 2003 ACM SIGMOD interna-
tional conference on Management of data, SIGMOD
’03, New York, NY, USA. ACM.
Shin, M., Ratanothayanon, S., Goel, A. L., and Paul, R. A.
(2007). Parsimonious classifiers for software quality
assessment. IEEE International Symposium on High-
Assurance Systems Engineering, pages 411–412.
Wu, G., Chang, E. Y., and Zhang, Z. (2005). An analysis
of transformation on non-positive semidefinite simi-
larity matrix for kernel machines. In Proceedings of
the 22nd International Conference on Machine Learn-
ing.
Xing, F., Guo, P., and Lyu, M. (2005). A novel method
for early software quality prediction based on support
vector machine. In International Symposium on Soft-
ware Reliability Engineering.
Zimmermann, T. and Nagappan, N. (2009). Predicting de-
fects with program dependencies. International Sym-
posium on Empirical Software Engineering and Mea-
surement, pages 435–438.
ANovelRegressionMethodforSoftwareDefectPredictionwithKernelMethods
221
