
Image Processing Supports HCI in Museum Application
Niki Martinel, Marco Vernier, Gian Luca Foresti and Elisabetta Lamedica
Department of Mathematics and Computer Science, University of Udine, Via Delle Scienze 206, Udine, Italy
Keywords:
Augmented Reality, Information Visualization, User Interface Design, Mobile HCI.
Abstract:
This work introduces a novel information visualization technique for mobile devices through Augmented
Reality (AR). A painting boundary detector and a features extraction modules have been implemented to
compute paintings signatures. The computed signatures are matched using a linear weighted combination of
the extracted features. The detected boundaries and the features are exploited to compute the homography
transformations. The homography transformations are used to introduce a novel user interaction technique for
AR. Three different user interfaces have been evaluated using standard usability methods.
1 INTRODUCTION
The continuous increase in power and graphics capa-
bilities of mobile devices has introduced novel visu-
alization techniques. Visualizing contents for mobile
devices is a challenging tasks because of the limita-
tion of screen size, etc. According to (Chittaro, 2006)
it’s impossible to follow a trivial porting approach
from desktop computers to mobile devices. Due to
the limitation of the screen sizes (Marois and Ivanoff,
2005) it is very hard to display a lot of information
such that it does not overload the human cognitive ca-
pabilities. According to (Chittaro, 2006) to correctly
display information on mobile devices,the visualiza-
tion design rules have to be followed.
AR techniques introduce many challenging tasks
especially for mobile devices due to the computa-
tional costs and small displays. The main goal of the
proposed work is to introduce a novel information vi-
sualization technique that allows end-users to access
paintings’ characters-based information through AR.
The proposed technique is highly innovative and
there are no similar works where the end-user is sup-
ported by an AR technique to visualize information
related to painting characters. In (Dahne and Kari-
giannis, 2002) the mobile “archeoguide” application
has been introduced to reconstruct historical sites.
In (Takacs et al., 2008) an outdoor augmented reality
system for mobile phones using Loxel-Based visual
feature organization is has been proposed.
To reach the proposed goal a dataset of paintings
has been built by taking pictures of paintings avail-
able from the web. The system exploits the signa-
ture computation module and the signature match-
ing module to compute and match paintings’ signa-
tures. Given a query painting and the matched paint-
ing, the homography estimation module is used to es-
timate the homography such that information can be
displayed through AR. The Human Device Interface
(HDI) module has been designed to provide a novel
information visualization technique. Three different
designs have been proposed and evaluated using stan-
dard evaluation methods.
2 SYSTEM DESCRIPTION
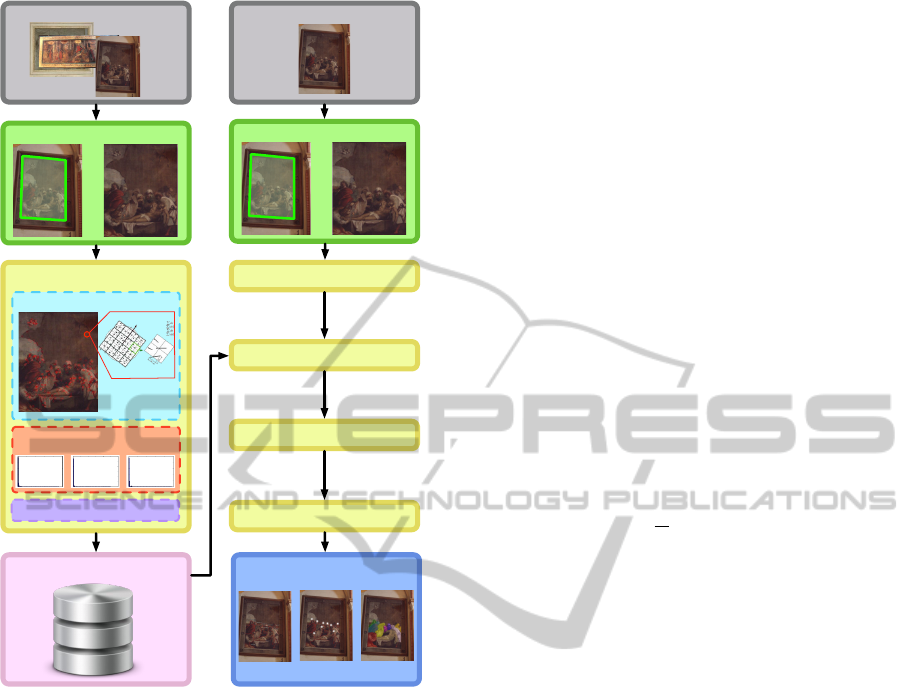
As shown in Figure 1, the proposed system exploits
four modules to achieve the proposed goal: i) the
boundary detector module, ii) the signature computa-
tion and signature matching module, iii) the homog-
raphy computation module and iv) the Human De-
vice Interface module. Before extracting the features
and computing the signature the relevant painting re-
gion of a given image is extracted using the standard
Hough Transform. The signature computation mod-
ule aligns the image boundaries such that they are or-
thogonal to each other and extracts visual based fea-
tures from such relevant regions to compute a dis-
criminative signature. The computed signatures are
stored in a dataset that is used for comparison with
real-time acquired images. The signature matching
module computes the distance between signatures to
detect the best match. Given a match between fea-
ture vectors the homography computation module es-
timates the homogrpahy transformation between the
118
Martinel N., Vernier M., Foresti G. and Lamedica E..
Image Processing Supports HCI in Museum Application.
DOI: 10.5220/0004299801180121
In Proceedings of the International Conference on Computer Vision Theory and Applications (VISAPP-2013), pages 118-121
ISBN: 978-989-8565-48-8
Copyright
c
2013 SCITEPRESS (Science and Technology Publications, Lda.)
DATASET IMAGES
BOUNDARY DETECTOR
SIGNATURE COMPUTATION
PHOG FEATURES
0 0
.
005 0
.
0
1
0
.
0
1
5 0
.
0
2
0
.
0
2
5
0
500
1000
1500
2000
2500
H
0 0
.
0
1
0
.
0
2
0
.
03 0
.
0
4
0
.
05 0
.
06
0
500
1000
1500
2000
2500
3000
S
0 0
.
005 0
.
0
1
0
.
0
1
5 0
.
0
2
0
.
0
2
5
0
500
1000
1500
2000
2500
V
PHOG FEATURES
FEATURES ACCUMULATION
SIGNATURES DATASET
ACQUIRED IMAGE
BOUNDARY DETECTOR
SIGNATURE COMPUTATION
SIGNATURE MATCHING
HOMOGRAPHY ESTIMATION
HUMAN DEVICE INTERFACE
PROPOSED DESIGNS
Figure 1: System overview. Each image is processed by the
boundary detector module and the detected relevant paint-
ing region is used to compute the painting signature. The
real-time acquired image is processed to compute the sig-
nature and to match it with the dataset signatures. Matching
signatures and features are used to compute the homogra-
phy transformation used to display content through AR.
original image and the acquired image. The estimated
homography transformation is finally exploited by the
HDI module. This module is used to overlap content-
based information to the currently acquired images
through AR.
3 SIGNATURE COMPUTATION
AND MATCHING
The signature computation module extracts image
features to compute the discriminative signature.
Given the relevant painting region R of image I two
features are computed: i) Speeded-Up Robust Fea-
tures (SURF) and ii) Pyramid of Histogram of Ori-
ented Gradients (PHOG). Before extracting the fea-
tures the transformation R
0
= T R is applied such that
the regions boundaries are orthogonal to each other.
Then R
0
is projected to the HSV color space to achieve
illumination and color invariance. SURF features F
(I)
are extracted from the given painting region R
0
as the
sum of the Haar wavelet response around each de-
tected point of interest. The PHOG feature matrix
P
(I)
∈ R
c×3
is extracted by concatenating the PHOG
histograms extracted from the three image channels.
c is the total number of histogram bins. The signature
S
(I)
of image I is defined as S
(I)
= hF
(I)
, P
(I)
i.
The signature matching module matches a query
signature S
(Q)
with the dataset signatures. Let S
(Q)
and S
(I)
be the paintings signatures of the query paint-
ing Q and the dataset painting I, respectively. Let
q, i be a match between two SURF feature descrip-
tors such that the L
2
norm distance between F
(Q)
q
and
F
(I)
i
is lower than a fixed threshold T h. F
(Q)
q
and F
(I)
i
are the q-th and the i-th SURF features of the two
given signatures. The overall SURF features distance
is computed as
d
SURF
(F
(Q)
, F
(I)
) =
1
m
(d
L
2
(F
(Q)
q
, F
(I)
i
) < T h) (1)
where m is the total number of matching SURF fea-
tures.
PHOG features are matched through a weighted
χ
2
distance as proposed in (Martinel and Micheloni,
2012). Given the PHOG feature matrices of two sig-
natures P
(Q)
and P
(I)
, the PHOG distance is computed
as
d
PHOG
(P
(Q)
, P
(I)
) =
∑
i
λ
i
χ
2
(P
(Q)
i
, P
(I)
i
) (2)
where P
(Q)
i
and P
(I)
i
are the PHOG feature vectors
computed for the signatures P
(Q)
and P
(I)
on channel
i. λ
i
is the normalization weight.
Finally a match between a query signature S
(Q)
and a dataset signature S
(I)
is computed as
argmin
I
d(S
(Q)
, S
(I)
) = αd
SURF
(F
(Q)
, F
(I)
) (3)
+ βd
PHOG
(P
(Q)
, P
(I)
)
α and β are the normalization weights.
4 HOMOGRAPHY ESTIMATION
The homography estimation module is used to com-
pute the homography transformation matrix that al-
lows overlap painting characters information to the
device display. The homography estimation is
achieved by exploiting a feature matching technique.
ImageProcessingSupportsHCIinMuseumApplication
119

Let Q and I be the query image and the dataset
matching painting. Given all the matches q, i be-
tween SURF feature descriptors the goal is to estimate
the homography transformation H
Q,I
such that K
(I)
i
=
H
Q,I
K
(Q)
q
. K
(I)
i
and K
(Q)
q
are the detected SURF in-
terest points of the matching features F
(Q)
q
and F
(I)
i
.
The approach proposed in (Brown and Lowe, 2006)
is exploited to achieve such goal.
Given a point in the original coordinate frame of
the dataset image Q, the inverse transformation matri-
ces H
Q,I
−1
and T
−1
can be used to display it onto the
image region R.
5 HUMAN DEVICE INTERFACE
Given the computed inverse homography transforma-
tions, the HDI module is used to display the infor-
mation related to a painting character through AR.
Standard Human-Computer Interaction methods have
been used to find the correct way display the informa-
tion such that users can easily interact with the user
interface without any cognitive effort. Three differ-
ent user interfaces have been designed and evaluated
respecting the usability rules.
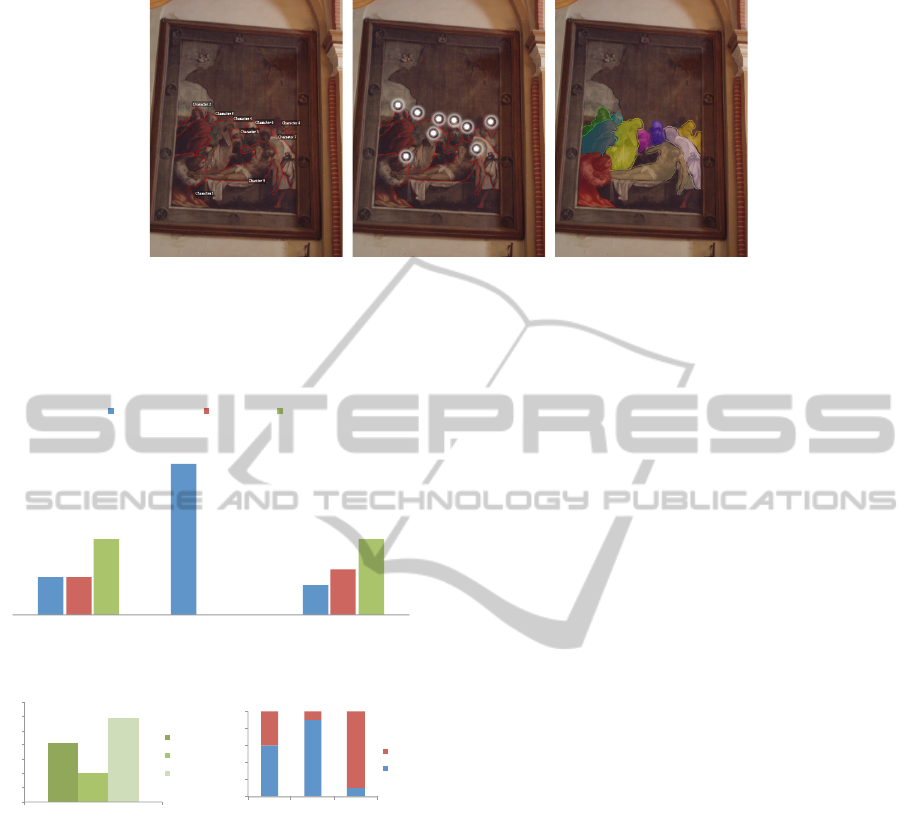
The three proposed user interfaces have been de-
signed as follows: i) painting characters edges are
highlighted with the same color and their names are
shown close to themselves. The end-user can access
character information by selecting the displayed la-
bel. ii) painting characters edges are highlighted with
the same color as before, but name labels are replaced
by blinking white circles. The end-user has to se-
lect the circle to access the character information. iii)
characters edges are displayed with different colors,
and characters silhouettes are overlapped with semi-
transparent coloured and blinking silhouettes. The
end-users have to select the semi-transparent coloured
silhouette to access the character information.
6 EXPERIMENTAL RESULTS
To evaluate the proposed designs two type of tests
have been performed: i) inspection tests and ii) end-
user tests. Inspection tests have been performed by
usability experts without the direct involvement of the
end-users.
Two types of inspection tests have been exploited:
i) heuristics tests, i.e., analytical evaluation tech-
niques that provide opinions, and ii) cognitive walk-
through tests where the HCI experts examine the ele-
25#
22#
20#
10#
16#
8#
5#
2#
0#
5#
10#
15#
20#
25#
30#
Male# Female#
Mean#Age#
Total#
Use#of#smarphone#
Use#of#AR#applica>ons#
Figure 2: Testers’ profiles. 30 testers have been selected to
perform the required task.
mentary actions that end-user needs to take to achieve
a given goal.
The proposed system has been evaluated with a
total of 30 users (Figure 2) without loss of generaliza-
tion (Nielsen and Landauer, 1993). During the brief-
ing participants were informed about the purposes of
the test, the task and its duration. Users were also
asked to fill a screening questionnaire to get infor-
mation about them. The “think-aloud” technique has
been used for test sessions, each of which lasts about
fifteen minutes. After each test a debriefing is ex-
ploited to investigate unusual or interesting events that
occurred.
The first user interface has been designed as
shown in Figure 3(a). Six participant out of ten com-
pleted the given task with an average execution time
of 8’33”. As shown in Figure 4, 25% of the users
that failed to complete the task selected different ar-
eas other than the character labels; 25% selected the
menu button; and the remaining 50% didn’t complete
the task at all. After debriefing, 90% of the partici-
pants was satisfied about the application but 40% of
them stated that the user interface was not clear.
The second designed user interface is shown in
Figure 3(b). Only one tester out of ten failed the test
selecting the menu button. 90% of the testers stated
that the proposed user interface was clear and it was
easy to reach the information related to a character.
One single tester suggested to display the white cir-
cles with different colors. As shown in Figure 5 the
second designed user interface achieves the best per-
formance both in terms of success rate and average
execution times. The average execution time required
to complete the task was about 4.1”.
The third designed user interface (Figure 3(c))
achieved the worst results. Only one tester suc-
cessfully completed the task. According to debrief-
ing questionnaire inspection, 70% of the participants
stated that the interface was not clear and 80% of them
had difficulties in recognizing the silhouette as a se-
lectable element. Most of the testers agreed that the
character recognition task was difficult due the over-
VISAPP2013-InternationalConferenceonComputerVisionTheoryandApplications
120
Character 1
Character 2
Character 3
Character 4
Character 5
Character 6
Character 7
Character 8
Charcter 9
(a) (b) (c)
Figure 3: In (a) painting characters edges are highlighted and characters names are used as selectable elements to access
character information. In (b) painting characters edges are highlighted as (a). Selectable characters names are replaced by
blinking white circles. In (c) painting characters edges and silhouettes are highlighted using different colours. Characters
silhouettes are used as selectable elements.
!"#$
%&&#$
!&#$
!"#$
&#$
'&#$
"&#$
&#$
"&#$
()*+,-$%$ ()*+,-$!$ ()*+,-$'$
./)**$0)-1$2134-$ 56-740$89+8:$ ;<4==)7$
Figure 4: Most relevant user interface issues.
8.33$
4.1$
11.7$
0$
2$
4$
6$
8$
10$
12$
14$
Time$(s)$
Design$1$
Design$2$
Design$3$
(a)
0%#
20%#
40%#
60%#
80%#
100%#
Design#1#
Design#2#
Design#3#
Failure#
Success#
(b)
Figure 5: Evaluation results: (b) average execution time; (a)
success and failures.
lapping of the colored silhouette.
Figure 4 and Figure 5 show that, for the third
user interfaces, testers that failed to complete the
task stopped before completing it or they randomly
touched the screen or selected the menu button.
7 CONCLUSIONS
The proposed work introduced a novel information
visualization for mobile devices that allows end-
users to access painting character-based information
through AR. A set of paintings signatures is computed
extracting two different types of features from the de-
tected relevant painting regions. The real-time com-
puted signatures are matched to the dataset signatures
using a weighted distance. Matching signatures are
used to estimate the homography transformation that
allows to display content through AR. Three differ-
ent designs have been evaluated to propose a novel
information visualization technique. Each design
has been evaluated using standard Human Computer-
Interaction evaluation techniques.
REFERENCES
Brown, M. and Lowe, D. G. (2006). Automatic Panoramic
Image Stitching using Invariant Features. Interna-
tional Journal of Computer Vision, 74(1):59–73.
Chittaro, L. (2006). Visualizing Information on Mobile De-
vices. Computer, 39(3):40–45.
Dahne, P. and Karigiannis, J. (2002). Archeoguide: sys-
tem architecture of a mobile outdoor augmented real-
ity system. In International Symposium on Mixed and
Augmented Reality, pages 263–264.
Marois, R. and Ivanoff, J. (2005). Capacity limits of in-
formation processing in the brain. Trends in cognitive
sciences, 9(6):296–305.
Martinel, N. and Micheloni, C. (2012). Re-identify peo-
ple in wide area camera network. In Conference on
Computer Vision and Pattern Recognition Workshops,
pages 31–36, Providence, RI.
Nielsen, J. and Landauer, T. K. (1993). A mathematical
model of the finding of usability problems. In SIGCHI
conference on Human factors in computing systems,
pages 206–213.
Takacs, G., Chandrasekhar, V., Gelfand, N., Xiong, Y.,
Chen, W.-C., Bismpigiannis, T., Grzeszczuk, R., Pulli,
K., and Girod, B. (2008). Outdoors augmented real-
ity on mobile phone using loxel-based visual feature
organization. ACM International Conference on Mul-
timedia information retrieval, page 427.
ImageProcessingSupportsHCIinMuseumApplication
121
