
Automatic Pill Identification from Pillbox Images
David E. Madsen
1
, Katie S. Payne
1,2
, Jason Hagerty
1,2
, Nathan Szanto
1
, Mark Wronkiewicz
2
,
Randy H. Moss
1
and William V. Stoecker
2
1
Department of Electrical and Computer Engineering, Missouri University of Science And Technology,
141 Emerson Electric Co. Hall, Rolla MO, U.S.A.
2
Stoecker & Associates, 10101 Stoltz Drive, Rolla MO, U.S.A.
Keywords: Color Space, Color Clustering, Segmentation, Image Analysis, Optical Character Recognition.
Abstract: There is a vital need for fast and accurate recognition of medicinal tablets and capsules. Efforts to date have
centered on automatic segmentation, color and shape identification. Our system combines these with pre-
processing before imprint recognition. Using the National Library of Medicine Pillbox database, regression
analysis applied to automatic color and shape recognition allows for successful pill identification. Measured
errors for the subtasks of segmentation and color recognition for this database are 1.9% and 2.2%,
respectively. Imprint recognition with optical character recognition (OCR) is key to exact pill ID, but
remains a challenging problem, therefore overall recognition accuracy is not yet known.
1 INTRODUCTION
Adverse reactions to both legally prescribed
medications and illicit or abused pills are a present
and growing problem (Moore et al., 2007). When
patients are brought to medical facilities in a stupor
or coma with unidentified pills, rapid pill
identification can be lifesaving. Adverse reactions
involving anti-hyperglycemic medications,
anticoagulants, and narcotics are potentially life-
threatening, and all require their own particular care
paths. Accordingly, automatic pill identification in
emergency rooms and intensive care units could lead
to better outcomes for these patients. Additionally,
automatic pill identification would give police
officers an efficient alternative to the current tedious
method of entering each pill’s features into a
database search and reduces user input errors on
pills with many characters. Furthermore, the manual
method, although it has the accuracy of human
characterized imprint, color, and shape, fails when
healthcare workers and police officers find
themselves in locations with no internet access.
Thus, there is a widespread need for automatic pill
identification.
Recently, large commercial and government pill
image databases have become available. These
databases allow development and testing of pill
identification programs. Among the very few works
to appear in the literature, Lee et al. (2012) reported
an identification accuracy of approximately 74%.
Additionally, Hartl (2010) used the Studierstube ES
framework for a mobile phone that focuses on speed.
The accuracy and robustness of pill ID systems must
be improved before pill identification systems can be
utilized in the fields of healthcare and law
enforcement.
This report details a pilot system that uses novel
segmentation, shape recognition, color, and optical
character recognition methods—all applied to pill
recognition. In this paper, our model system is the
Pillbox database (U.S. National Library of Medicine,
2012). The remainder of this article is organized in
the following sections: 2) Automatic segmentation
of pills from background, 3) Color identification, 4)
Pill shape recognition, 5) Preliminary optical
character recognition of imprint, 6) Results, and 7)
Conclusions.
2 SEGMENTATION OF PILLS
The initial task in pill recognition is segmentation,
i.e. separating Pillbox images into distinct pill and
background regions (see Figure 1). This involves
four steps: 1) Conversion of the captured pill’s
image RGB color space into L*a*b* color space, 2)
2D histogram generation along the L*-a* planes, 3)
378
E. Madsen D., S. Payne K., Hagerty J., Szanto N., Wronkiewicz M., H. Moss R. and V. Stoecker W..
Automatic Pill Identification from Pillbox Images.
DOI: 10.5220/0004303603780384
In Proceedings of the International Conference on Computer Vision Theory and Applications (VISAPP-2013), pages 378-384
ISBN: 978-989-8565-47-1
Copyright
c
2013 SCITEPRESS (Science and Technology Publications, Lda.)
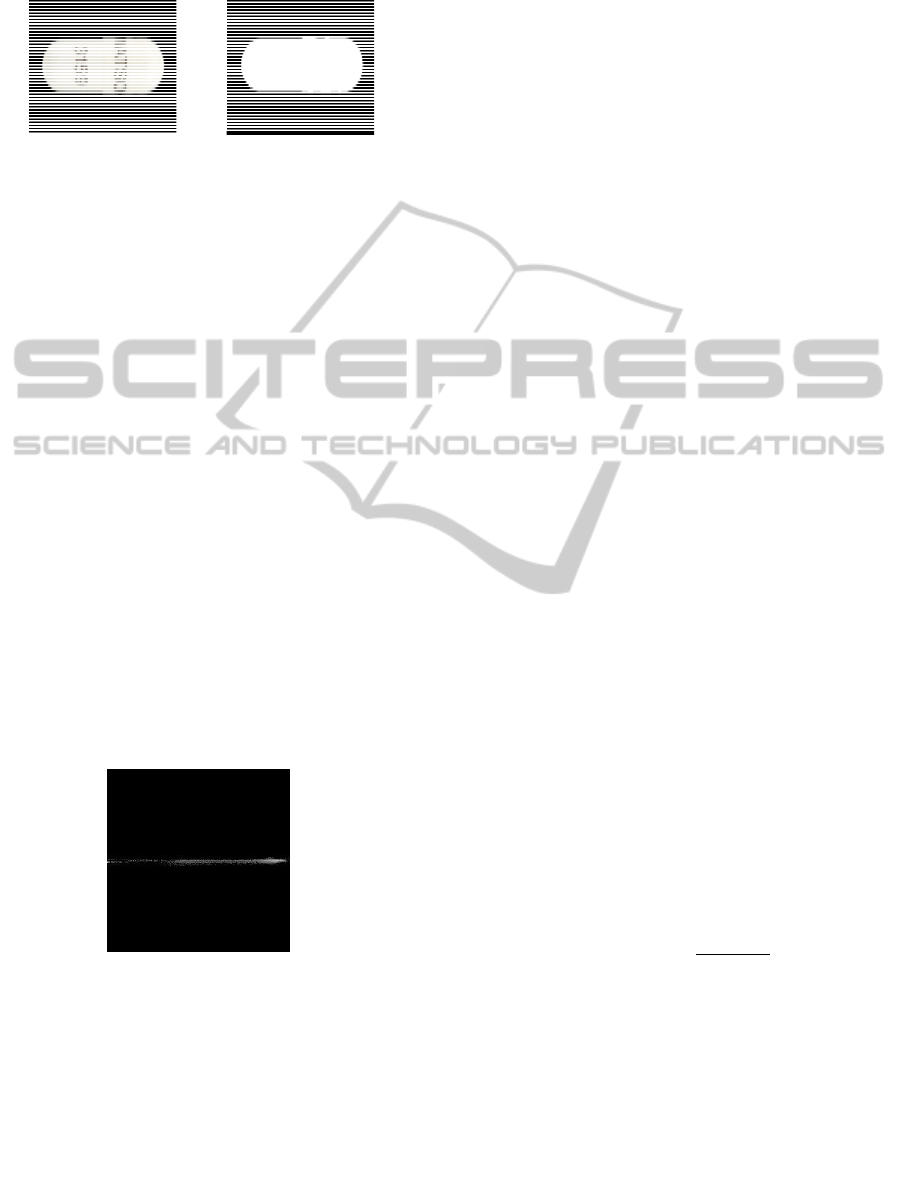
Clustering via K-means++, and 4) Binary mask
generation.
Figure 1: Original pill image (left); Final binary image
border mask using our segmentation algorithm (right).
2.1 RGB Image Conversion to L*a*B*
Space
In the RGB color space, the color temperature of
light and the demosaicing method affects the
perceived color. Therefore, conversion from RGB to
L*a*b* color space must be performed to reduce
these interferences; this process is achieved through
an intermediate color space, XYZ, described below.
The pill color in the database image and that of
the captured image are expected to be different in
practice, since the camera or the illumination
conditions for the two images are different, creating
varying colors with no common reference point
(Szeliski, 2011). The XYZ color space was created
to model the response curve of the human eye, to be
used as a common point of reference. By
transforming a color represented by an RGB value to
an XYZ value, two colors can be compared more
easily because of this common reference. L*a*b* is
a non-linear re-mapping of the XYZ color space
“where differences in luminance or chrominance are
more perceptually uniform” (Szeliski, 2011).
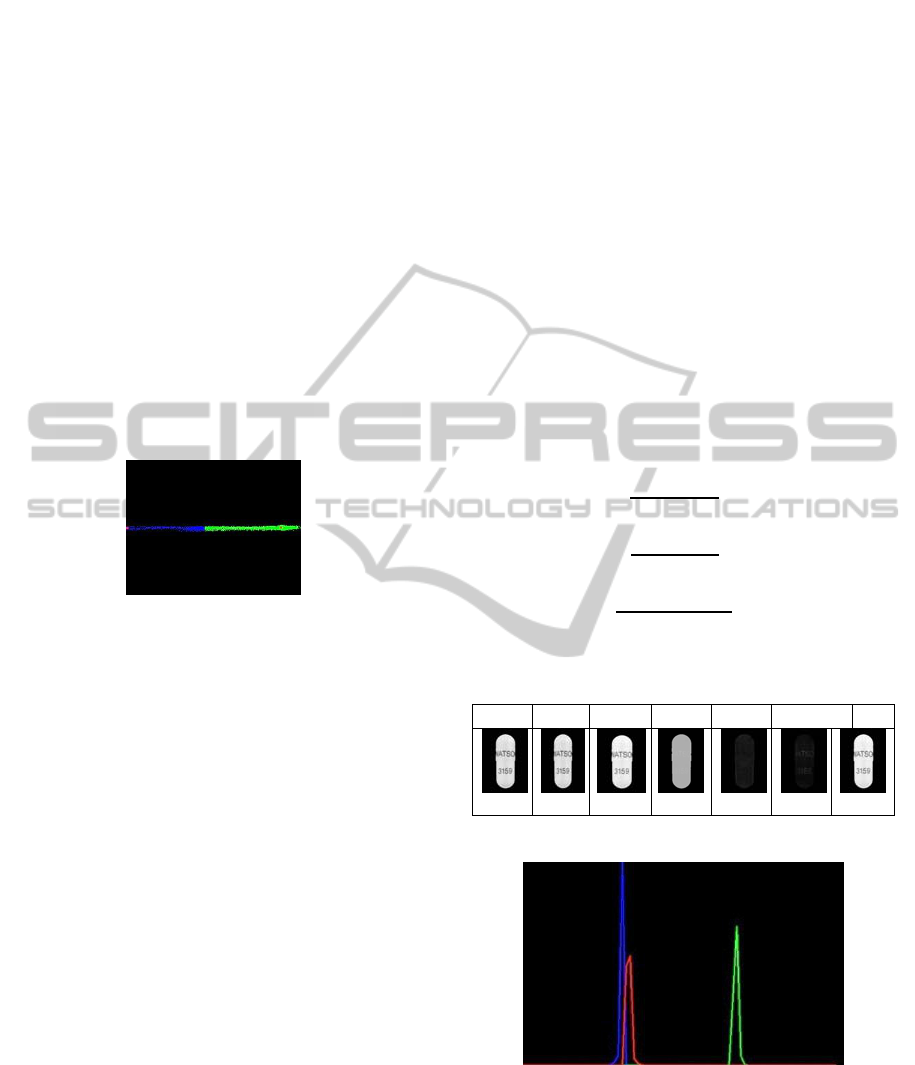
Figure 2: Log of the original histogram. This image is the
L*- a* histogram that has been modified by taking the
log(1+histogramValue) for viewing. This is done to
prevent the histogram image from being saturated when
any particular histogram bin accumulates above 255.
2.2 2D L*-a* Histogram Generation
After converting to L*a*b* space, a two-
dimensional histogram using the L* and a* planes of
the image is generated. (Figure 2) To generate the
2D histogram, 256 linearly spaced bins ranging from
0 to 255 for L*, and -127 to 128 for a*, were used
along each axis. This results in a histogram that
illustrates the number of pixels that have a particular
(L*,a*) combination.
2.3 K-Means++ Clustering
Input images are assumed to contain a single pill on
a homogenous background; as a result, two clusters
in the L*-a* histogram are expected. Therefore, a
partitioning technique to minimize the total of
Euclidean distances with two defined cluster
centroids is applied, known as K-means++
clustering. (Figure 3) A variation of the K-means++
algorithm is defined and then described below.
During initialization, Arthur’s “D
2
weighting”
method is employed (Step A) as a more intelligent
starting point of the two cluster centroids, instead of
random center initializations (Arthur and
Vassilvitskii, 2007). The algorithm then iterates
through each point on the histogram and assigns it to
the nearest cluster centroid (Step B) (Xu and
Wunsch, 2005). Once each point is assigned, the
centroids are recomputed based on newly assigned
points (Step C). The point allocation and centroid
recalculation of Steps B and C repeat until some
termination condition is met (Step D). The clustering
terminates when either 20 centroid recalculations
have occurred or the centroids move less than 0.01
spatial units.
Steps A-D:
A. Initialize clusters
and
, with centroids
and
respectively, based on K-means++
algorithm
i. Choose an initial centroid,
, uniformly at
random from data set, ℝ
2
ii. Let () indicate the smallest distance from
data point to the closest chosen centroid,
.
Choose the second centroid,
, by selecting
=
with probability
∑
(
)
B. Assign each point in the data set to the nearest
cluster centroid, i.e.
for =1,…,:
, if ||
−
|| < ||
−
||
, else
C. Recalculate the cluster centroids,
and
,
based on the current point assignments
D. Repeat Steps B, C until one of two termination
conditions is reached:
AutomaticPillIdentificationfromPillboxImages
379
i. 20 centroid updates, or
ii. Both centroids moved < .01 units in 256x256
histogram space
Because the K-means++ algorithm is sensitive to
initialization, the entire clustering process is
typically run multiple times. The “best” clustering
result can then be chosen based on a compactness
score (Equation 1), which is the total sum of squared
error (SSE) for every point to its centroid. Real-time
application is of importance here, so the K-means++
clustering is limited to three attempts. The clustering
attempt with the lowest corresponding compactness
is selected to generate the binary mask.
The compactness score is shown by Equation 1
(Itseez, 2012).
−
ℎ{1,2}
(1)
Figure 3: Segmented histogram. This image shows how
the histogram has been segmented into two clusters using
the K-means++ algorithm. The red points are the centroids
of each cluster.
2.4 Binary Mask Generation
Once the best clustering result is chosen, then the
binary pill mask is generated. Previously, each pixel
was assigned a label corresponding to its cluster. A
blank binary image of identical size as the original is
first created. The “background” cluster is then
determined by finding the cluster that has the most
member pixels contacting the image edge. This
cluster’s pixels are assigned a value of 0 on the
binary mask, while members of the second cluster,
which theoretically correspond to the pill, are
assigned a value of 1. The result is shown in Figure
1. Note that this assumes that the image fully
captures the pill. The binary pill mask is then used in
further pill characterization steps.
3 COLOR RECOGNITION
Seven hundred forty-four images were gathered
from the National Library of Medicine’s Pillbox
website (http://pillbox.nlm.nih.gov) with both front
and back views. These high-quality images were
used as the basis to develop a method to recognize
color. The idea of histogram vector multiplication as
a method for object recognition (Gonzalez and
Woods, 2008) led to investigation of a similar
approach for color histograms. Initially, histograms
previously used for pill segmentation based on XYZ
and L*a*b* color spaces resulted in an accuracy of
86.3% using logistic regression. Using the HSV
color space which, like L*a*b*, represents luma and
chroma separately, along with the captured pill’s
image RGB values, resulted in an increase in color
recognition to 98.1%.
For each channel of the HSV color space, along
with red, yellow, and blue chromaticities (See
Equations 2-4, Table I, and Figures 4 and 5),
histograms were calculated for every pill. All
histograms consisted of 80 bins ranging from 0-360
for Hue, 0-1 for Saturation, and 0-255 for Value and
scaled chromaticity.
=
++
=
++
=
+
2
(
++
)
(2)
(3)
(4)
Table 1: Histogram Channels.
Orig. C
R
C
B
C
Y
H S V
Figure 4: Blue, red, yellow chromaticity histograms.
To reduce the effects of pill imprints, a histogram
filter was developed to remove small peaks.
From the creation of six histograms for each pill,
the pills were grouped according to each of the
defined pill colors (white, yellow, orange, pink,
VISAPP2013-InternationalConferenceonComputerVisionTheoryandApplications
380
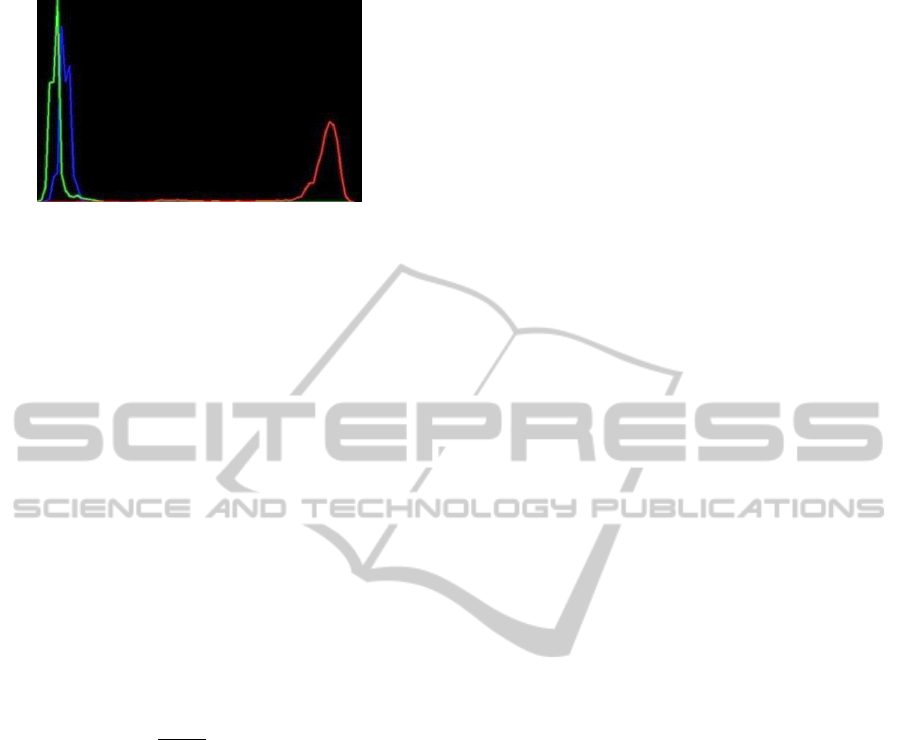
Figure 5: HSV histogram: Blue = H, Green = S. Red = V.
blue, green, brown, red, purple, gray, and tan) and
their respective histograms were averaged together.
Determination of the color of a pill starts with
using the pill segmentation mask to calculate the
normalized histogram for the six channels. Each of
the pill’s six histograms is then vector multiplied
with its respective template histogram for each of
the eleven predefined pill colors. For each color
model, six scalar values resulting from the
corresponding vector calculation are used as inputs
into a logistic regression model.
Logistic regression, or the logit model, is a
statistical analysis method by which the probability
of an event occurrence is calculated based on
predictor variables fitted to a logistic function. The
logistic function is defined as:
=
,
+
,
,
(5)
(
)
=
,
(
)
∈(0,1)
Each of the
,
coefficients is determined using
maximum likelihood estimation and represents the
weight of the predictor variable, x
n
. f(z) represents
the probability of the outcome of any item and z
represents the measure of the total contribution of all
independent variables in the model (Menard, 2001).
Here,
,
is defined as the intercept for the i
th
defined color model, and β
n,i
as the regression
coefficients of i
th
color model. The
were
previously determined using a training set to create
the logistic regression model for each of the defined
colors. The variables x
n,i
are the histogram scalar
values, which were previously described, for the i
th
color. Once the
are calculated for each of the 11
defined colors, recognition of a pill color
corresponded to the color yielding the maximum
.
In the case of a capsule with two colors, the same
technique is used, with each half of the pill
processed individually. First, the minimum bounding
rectangle of the pill’s segmentation mask is
calculated. Next, the pill mask is cut in half along
the major axis. The two masks are used to process
the pill as previously discussed.
4 SHAPE RECOGNITION
Classifying shapes was found to be most promising
when done using Hu invariant moments (Hu, 1962).
There are seven Hu moments, each independent of
rotation and scale. Using binomial regression
methods similar to those in Section 3, shapes were
matched using Hu moments.
Difficulties in shape recognition were similar to
those encountered in color recognition, namely that
shapes are not always clearly defined, as is the case
for numerous capsules and tablets. Our solution was
to create an addition shape label that grouped
together those similarly shaped pill to train our
model to use this new label as a parameter to
distinguish shapes.
5 IMPRINT RECOGNITION
The process of extracting imprint information from a
pill is one which requires the consideration of
several factors, including the luminance relationship
between inscription and the pill. Once that
information is known, two of four morphological
operators are applied to the image before using an
Optical Character Recognition (OCR) engine,
Tesseract (Smith, 2012). Inaccuracies such as
misplaced characters may sometimes occur. To
compensate for this, a basic string matching
algorithm is applied to the OCR output.
5.1 Imprint Extraction
Imprint extraction begins by determining pill color
and luminance characteristics. First, if the capsule
has two halves of different colors, the halves are
processed separately. The half-capsule shape is
automatically identified and separated into two
pictures. Each picture includes each half capsule and
therefore consists of two colors: one for the pill and
one for the homogenous background, allowing the
pictures to be processed in parallel.
Once the area of interest is acquired, the color
image is converted into a gray-scale image.
Luminance information allows determination of
whether the capsule is darker than the text or vice
versa. The appropriate gray-scale morphological
operators are then applied.
AutomaticPillIdentificationfromPillboxImages
381
Depending on the relative luminance of the pill
and text, two of four morphological operators are
applied to the image (Equations 6-11). The Black
Hat operator locates areas of an image that are
darker than their surroundings (Figure 6a), whereas
the Top Hat operator locates areas that are lighter
than their surroundings (Figure 6b) (Gonzalez and
Woods, 2008). Applying either dilation or erosion to
the image before the Black Hat/Top Hat operator
often improves OCR results. For dark text on a light
pill, dilation is used; for light text on a dark pill,
erosion is used. Previous work has shown that the
number of dilation or erosion iterations affects the
results on a pill-by-pill basis. After the appropriate
operators are applied to a given image, it is passed to
the OCR, where text extraction is attempted.
Top Hat
Black Hat
Closing
Opening
Dilation
Erosion
= −
(
∘
)
ℎ =
(
∙
)
−
∙=
(
⊕
)
⊖
∘=
(
⊖
)
⊕
⊕=
{
|
∩
≠∅}
⊖=
{
|(
)
⊆
}
(6)
(7)
(8)
(9)
(10)
(11)
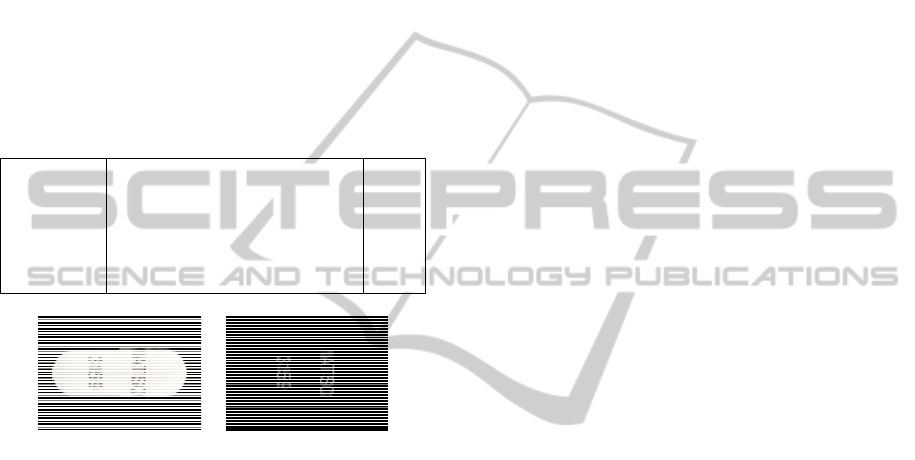
Figure 6a: Pill requiring
Black Hat operation.
Figure 6b: Results of
Black Hat operation.
5.2 Integration of Tesseract
Once a given image has been processed to
emphasize the text on the pill, it is passed to an
open-source character recognition engine known as
Tesseract (Smith, 2012). Tesseract analyzes the
image and returns the identified characters.
Typically, the OCR output will contain some
mistakes, as 100% accuracy is uncommon. A
solution to this problem is approximate string
matching with a limited vocabulary. Since only pills
are considered in this project, the possibilities of text
are limited to the imprints that are found on pills. As
a result, it is possible to construct a dictionary that
includes only the possible text outputs. By using
dynamic programming to implement the edit
distance match method (Apostolico & Galil, 1997),
each OCR result can be compared to the dictionary
entries. This method indicates which word in the
dictionary is most similar to a given OCR output;
essentially, it takes what may only be a partial match
and finds the dictionary word that it most closely
resembles. The next step in the previous example
involves passing the image in Figure 6b to Tesseract.
Due to the curvature of the pill, part of the text is
missing and, as expected, the OCR returns only the
partial match, “yVATSOi 3159.” However, by
performing string matching with limited vocabulary,
the correct imprint, “WATSON 3159,” is obtained.
6 RESULTS
The segmentation section of this algorithm was
evaluated by comparing it to a set of ideal
segmentation masks for 50 Pillbox images. By
applying a threshold across the RGB planes and
mathematically intersecting the results, an ideal pill
mask was obtained for each pill image. Note that the
“ideal” mask can easily be found in the Pillbox
images because the background is uniformly black.
A percentage error for the K-Means++ segmented
images was found by locating all pixel locations
where the two masks differed and dividing that
value by the total non-zero pixels in the ideal mask.
The algorithm’s average error was 4.05%, with a
median error of 2.2% in the image set.
In reference to color, our methods and images
from the Pillbox database achieved a high level of
accuracy based on using multiple color spaces and
classification using logistic regression. In the
situation that a color was asserted only when was
greater than zero, probit regression accurately
identified 95.8% of pills and logistic regression’s
accuracy was as high as 96.8%. When z was less
than zero, probit regression identified 96.6% correct
while logistic regression showed 98% accuracy.
With regard to pill shape, when was greater
than zero, probit and logistic regression showed
accuracies of 64.9% and 88.5%, respectively; when
less than zero, probit and logistic regression showed
accuracies of 65.5% and 90.9%, respectively.
In terms of type of pill, capsule was matched
with 98.9% accuracy and tablet at 99.6%. A negative
factor contributing to this yield is that the “tablet”
and “oval” shapes sometimes overlap.
Considering imprint, the raw OCR output often
contains words with several inaccuracies; ideally,
these mistakes would simply be fixed by finding the
dictionary word with the minimum number of edits
between an OCR word and a dictionary word. If
there are multiple dictionary words that yield the
same number of minimum edits, the final output
string will be incorrect. To quantify the results of the
imprint extraction, the edit distance match method
VISAPP2013-InternationalConferenceonComputerVisionTheoryandApplications
382

was used to count the number of edits necessary for
the final output string to be transformed into a 100%
match. An average of 2.48 edits per sample was
found to be necessary to have optimal results.
7 CONCLUSIONS
This report outlines a pill identification system that
achieves a higher degree of automatic identification
than previously reported. Further improvement is
needed prior to practical application.
7.1 More Image Testing
Images in other databases, especially those taken in
the field, have variable lighting and focus. It is likely
that our successful segmentation accuracy, with a
median error of 2.2%, will fail when algorithms are
applied to other images. Other algorithms and
additional color space dimensions such as the b*
dimension in L*a*b* color space will be attempted.
7.2 Color Recognition Improvements
Color recognition accuracy measured by logistic
regression, with a current error of 1.9%, is expected
to fail with other images. Future steps to improve
color recognition are more image blurring, RGB
histogram normalization before processing, and
adding L*a*b* to the current list of channels. We
will explore other adaptive methods to ensure that
data is not lost in the averaging method.
7.3 Shape Recognition Improvements
A secondary problem concerns shape recognition.
Of twelve shape types, the three most common are
prevalent enough such that that uncommon shapes,
e.g. teardrop or pentagonal shapes, are under-
selected. A special function for these uncommonly
shaped pills is needed.
7.4 Imprint Recognition Improvements
The algorithm for imprint extraction that has been
outlined suggests a two-part system. First, the image
should be processed in order to improve raw OCR
results. Secondly, the OCR output string should be
analyzed to limit the final output to a finite
vocabulary. Preliminary efforts have been
inconclusive. The optimal number of mathematical
morphology operations, such as repeated dilation or
erosion to produce the best results for a given image,
is not known. This currently relies largely on human
input. The techniques in string matching could also
be improved in returning only the relevant
information and excluding words of little value.
7.5 Improvements for a Practical
System
Multiple challenges must be met to complete a
working system. Fusion of the information from
shape, color, and character determination will be
needed. The images in the Pillbox database are of
higher quality than can be obtained with a
smartphone under real-life conditions. Overcoming
non-ideal lighting, irregular positioning, and limited
resolution are additional challenges that must be met
before a practical system is available for health and
law enforcement.
REFERENCES
Apostolico, A., & Galil, Z. (1997). Pattern matching
algorithms. Oxford: Oxford University Press, p. 123-
125.
Arthur, D., & Vassilvitskii, S. (2007). K-means++: The
Advantages of Careful Seeding. In Proceedings of the
eighteenth annual ACM-SIAM symposium on Discrete
algorithms, 1027-1035.
Gonzalez, R. C., & Woods, R. E. (2008). Digital Image
Processing (3
rd
ed.). New Jersey: Pearson Education.
Hartl, A. (2010). Computer-Vision Based Pharmaceutical
Pill Recognition on Mobile Phones. CESCG 14
th
Central European Seminar on Computer Graphics.
Hu, M.-K. (1962). Visual pattern recognition by moment
invariants. IRE Transactions on Information Theory,
8(2), p. 179-87.
Itseez. (2012). OpenCV. Open Source Computer Vision
Library. http://www.opencv.org
Lee, Y., Park, U., Jain, A. K., & Lee, S. (2012). Pill-ID:
Matching and retrieval of drug pill images. Pattern
Recognition Letters, 33(7), p.904-910.
Menard, S. (2001). Applied Logistic Regression (2
nd
ed.).
Thousand Oaks: Sage Publications, Inc.
Moore, T. J., Cohen, M. R., & Furberg, C. D. (2007).
Serious adverse drug events reported to the Food and
Drug Administration, 1998-2005. Archives of Internal
Medicine, 167(16), 1752-9.
Smith, R. (2012). Tesseract Code. http://code.google.com/
p/tesseract-ocr
Szeliski, R. (2011). Computer Vision: Algorithms and
Applications. New York: Springer.
Umbaugh, S. E. (2011). Digital Image Processing and
Analysis (2
nd
ed.). Boca Raton: CRC Press.
United States National Library of Medicine. (2012). Pill
Beta. National Institutes of Health.
Xu, R., & Wunsch, D. (2005). Survey of clustering
AutomaticPillIdentificationfromPillboxImages
383

algorithms. IEEE Transactions on Neural Networks,
16(3), 645-78.
VISAPP2013-InternationalConferenceonComputerVisionTheoryandApplications
384
